

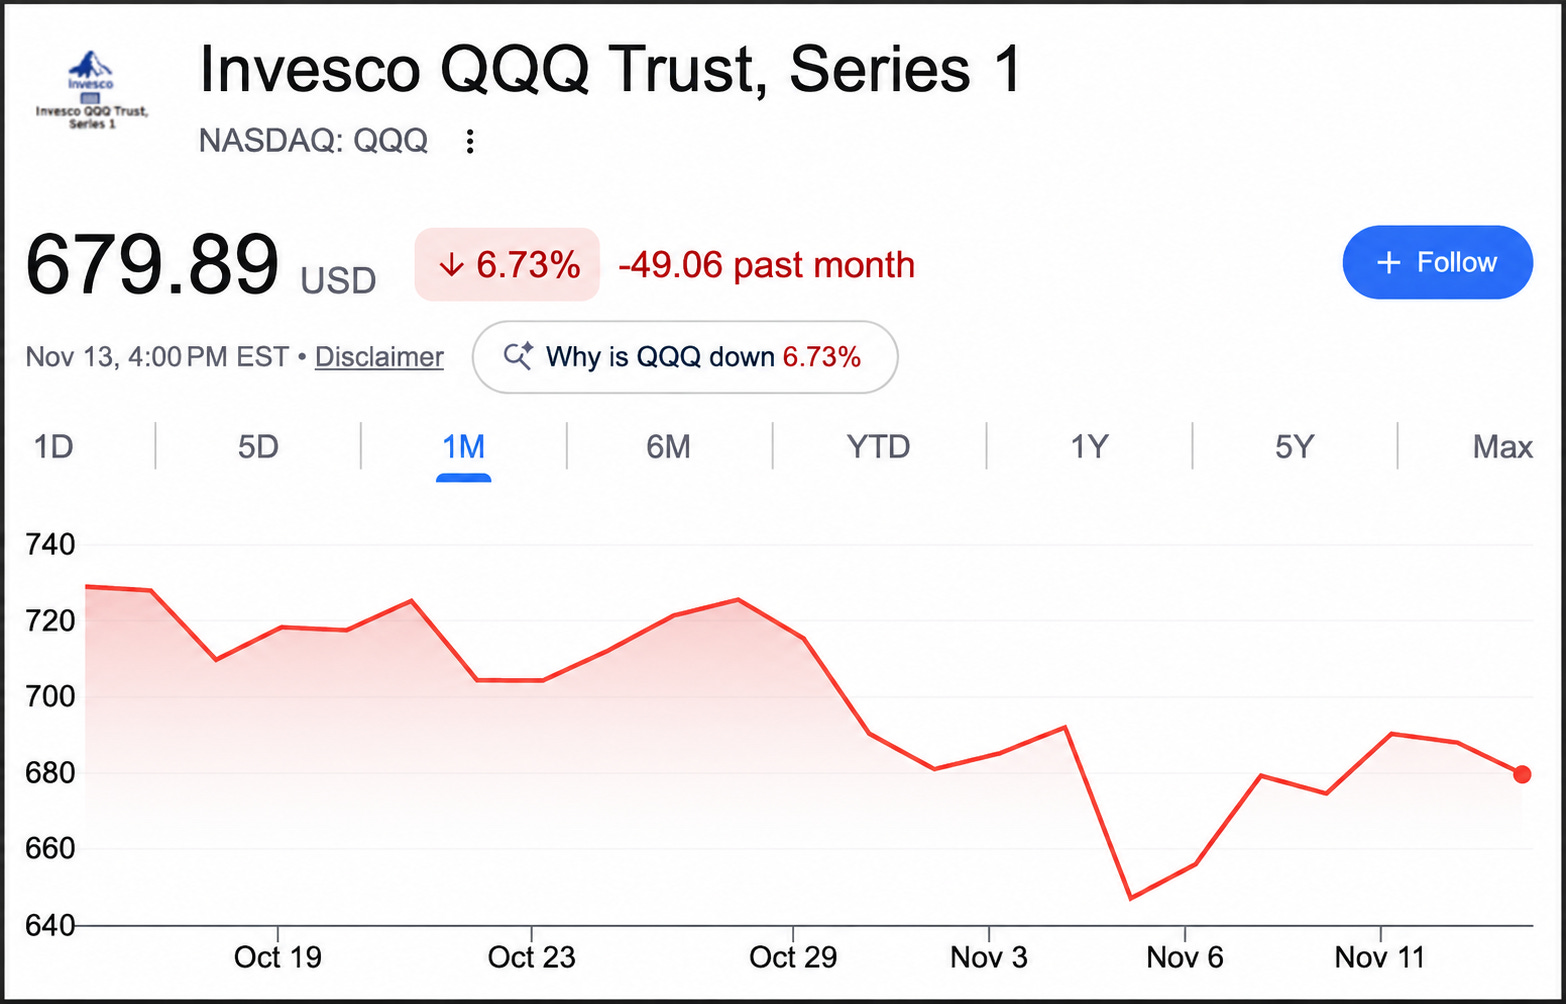
The Nasdaq is now down roughly 7% in just the last month.
While investors heavily allocated to tech are certainly feeling the pain-
So are investors who utilize option income ETFs with QQQ as their underlying index.
Think of ETFs like:
QQQI
JEPQ
TDAQ
GPIQ
These four ETFs combined have over $60B in AUM, and all of these have the Nasdaq as their underlying index.
However, something interesting is happening right now.
These ETFs may seem nearly identical on the surface level-
For example, they all provide 10%+ yields.
But there are a few small structural differences that make a massive difference in the overall performance of these funds.
So much so, that one of these High Yield ETFs is currently outperforming QQQ over the last year.
Let’s dive in.
📉 Price Return
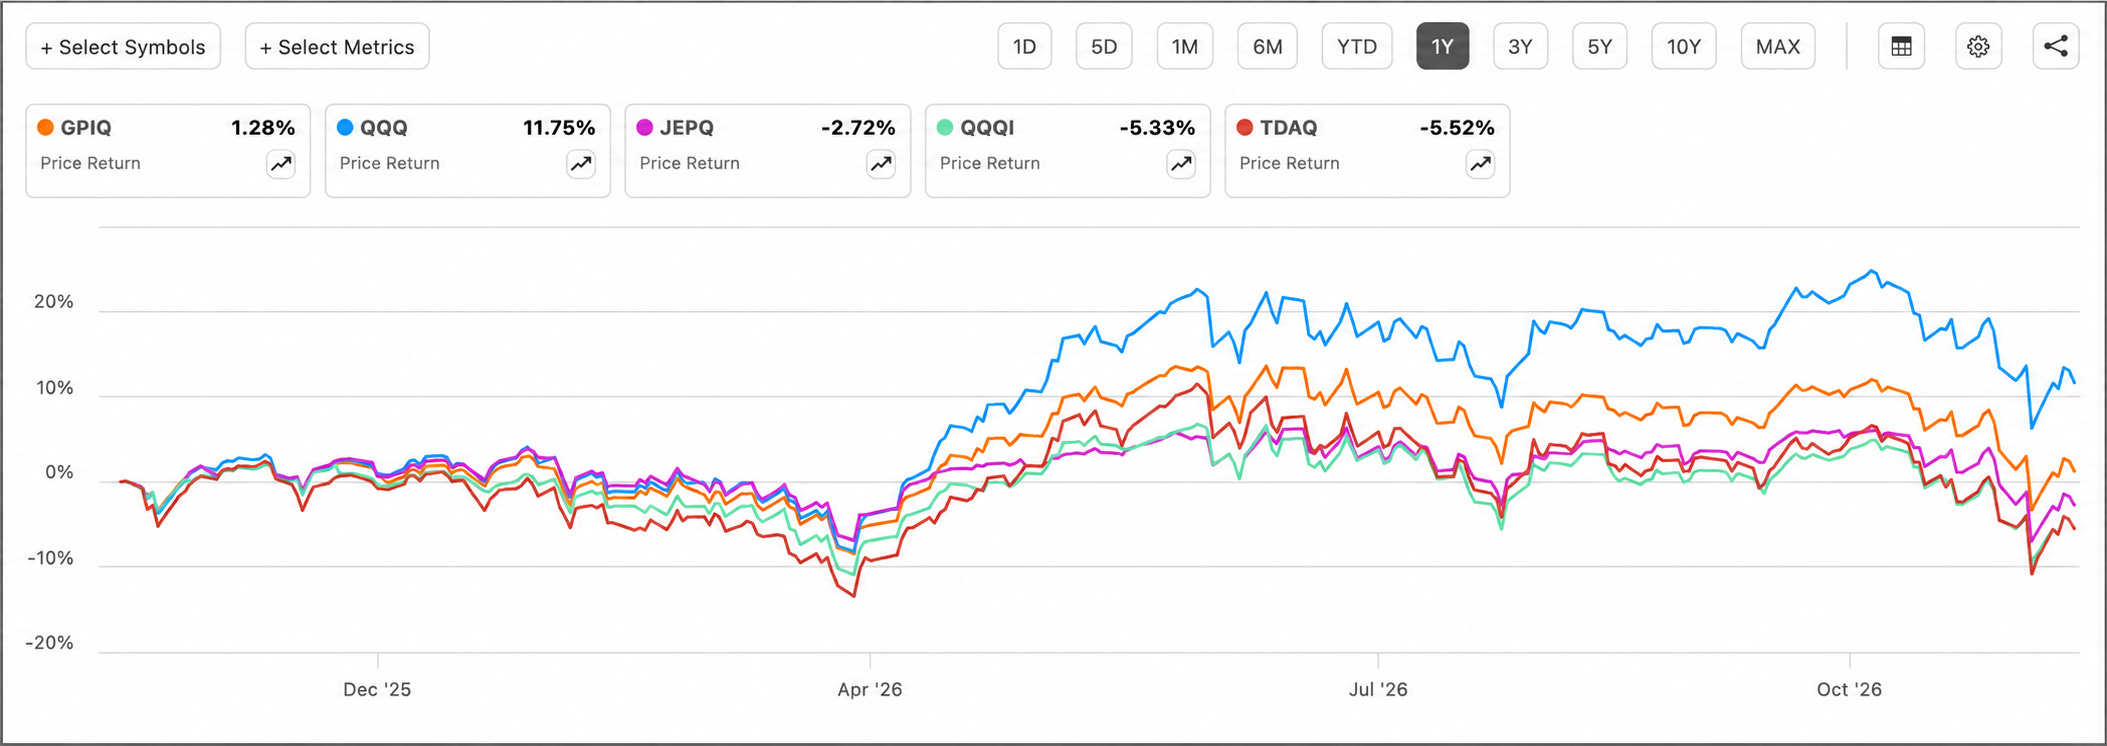
If we look at the price return for these ETFs, we can see QQQ has returned 11.75% over the last year-
A solid return.
As you would suspect from these funds, none of them have seen their share price grow at a higher rate.
This is to be expected when you understand the structure of these funds.
Their distributions are paid out of their net asset value.
In other words, when a fund pays out $0.50 per share, its share price generally drops by $0.50, all else equal.
That cash moves from the fund to your account.
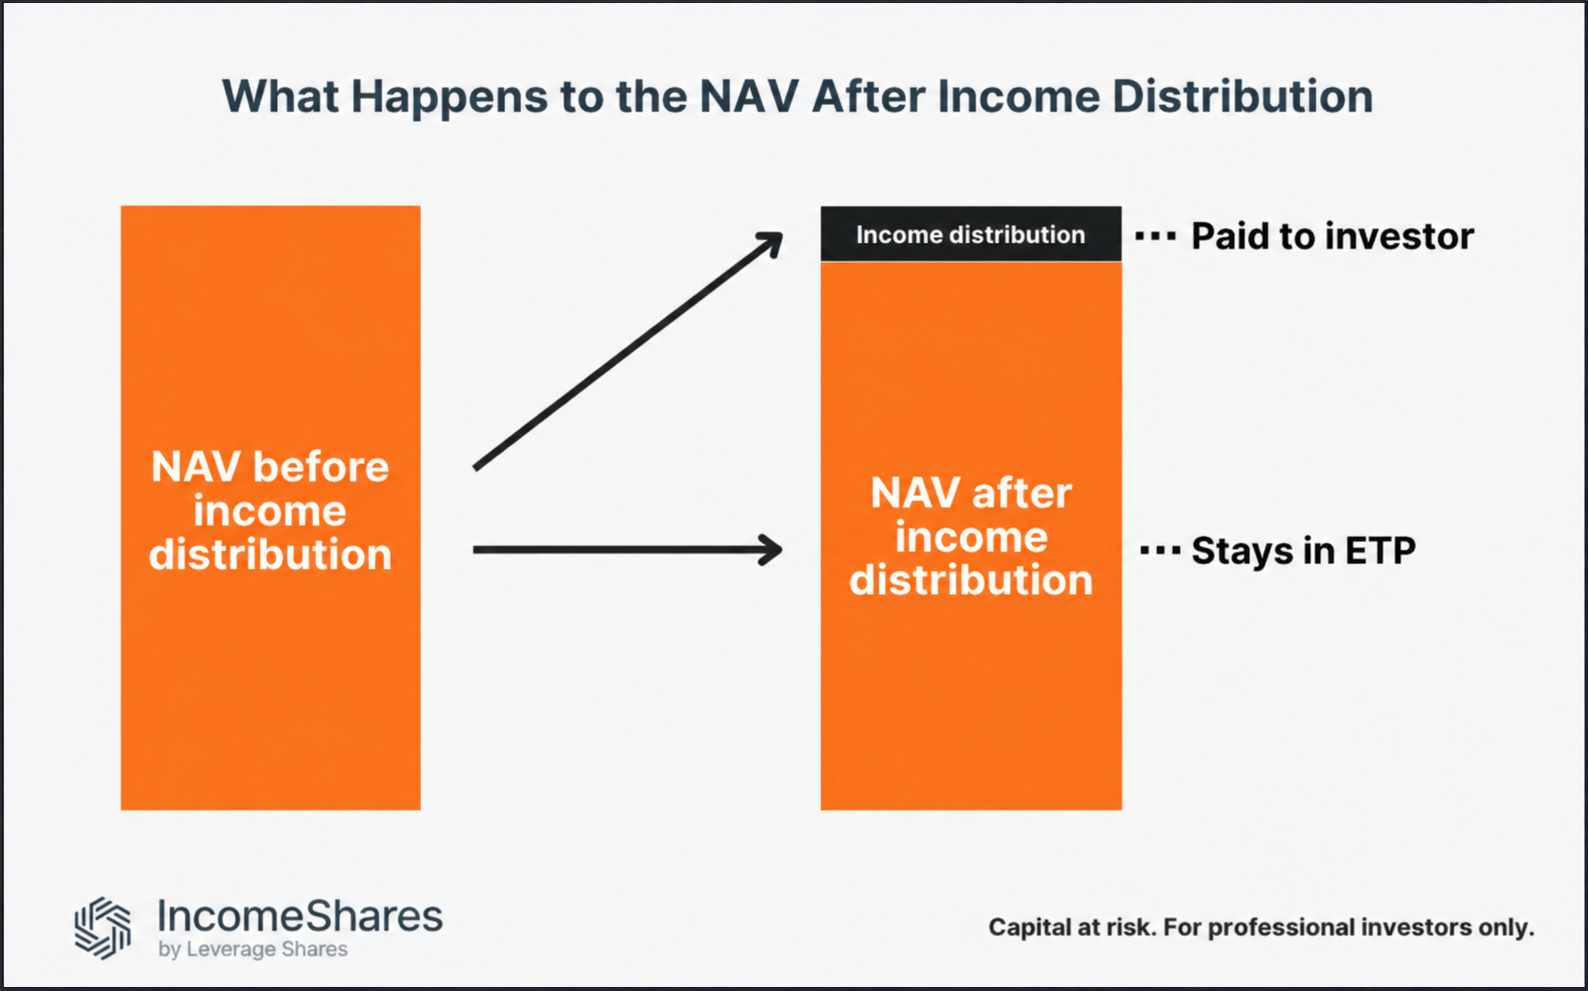
This is the tradeoff of owning option income ETFs.
But understanding this also reshapes how we think about the sustainability of the distributions of these funds.
What do I mean by this?
💵 QYLD Example
QYLD is one of the oldest option income ETFs on the market.
And it makes a great case study on what to watch out for.
Over the last 5 years, this ETF is down by nearly 23%.
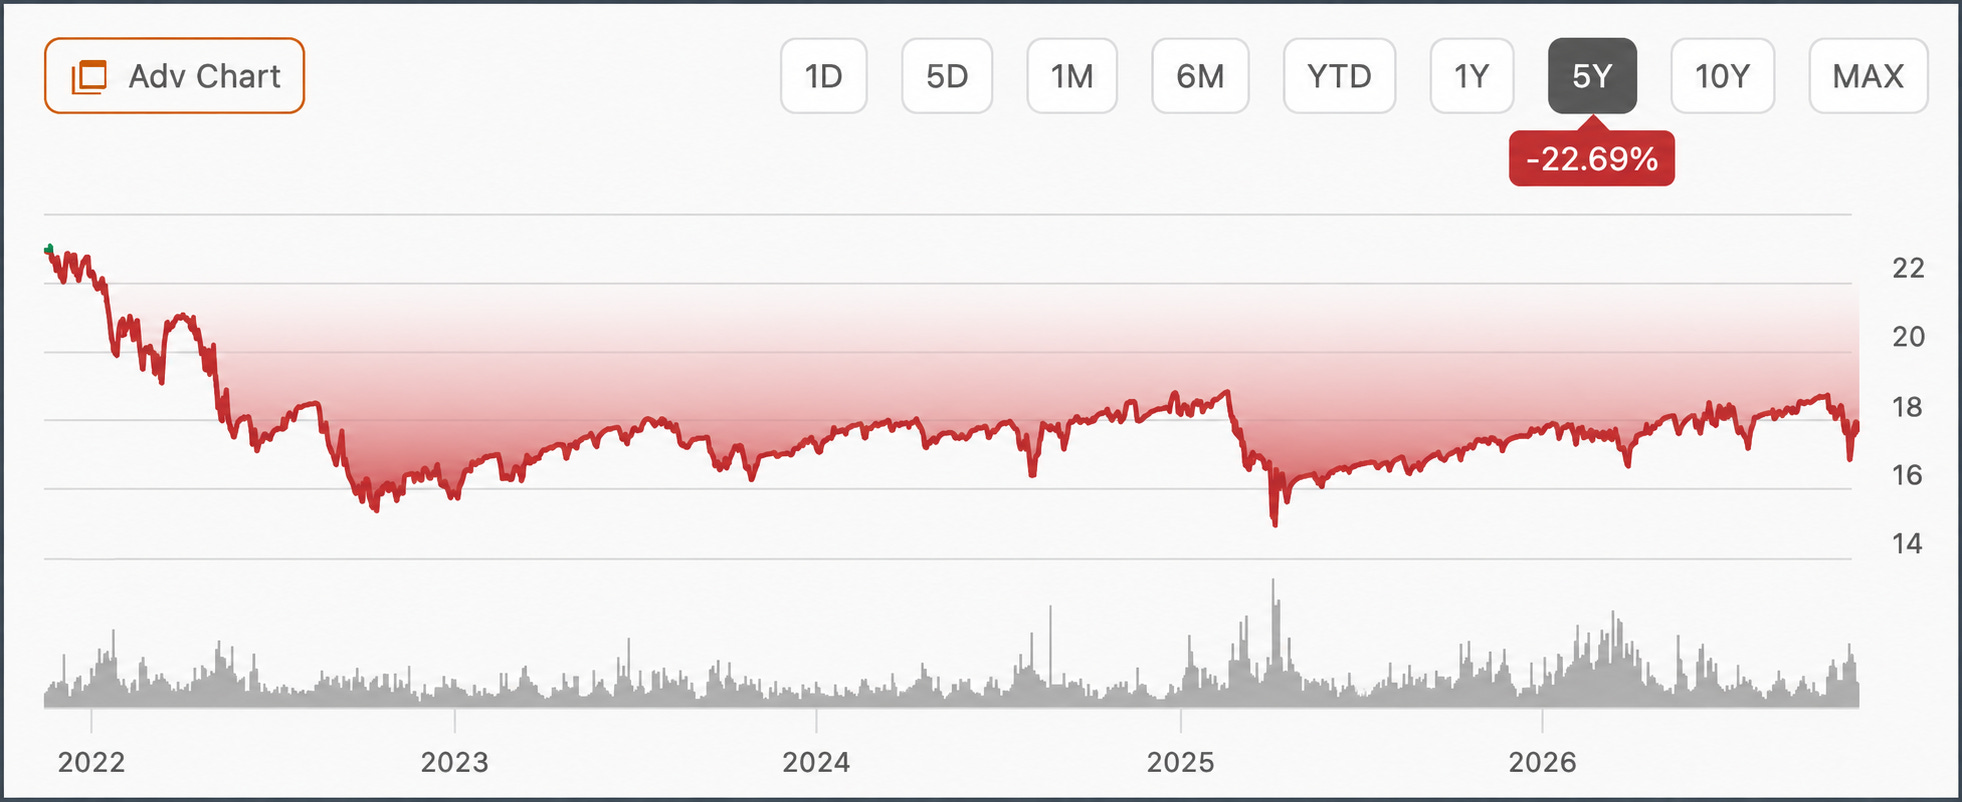
Of course this can be made up for if the fund has maintained large distributions.
But here is the issue.
If the NAV/share price is decreasing, it becomes harder for the fund to maintain its large distributions.
(remember, the distributions are paid out of the NAV)
And if we look at the last 5 years of distributions, you’ll see that is exactly what happened.
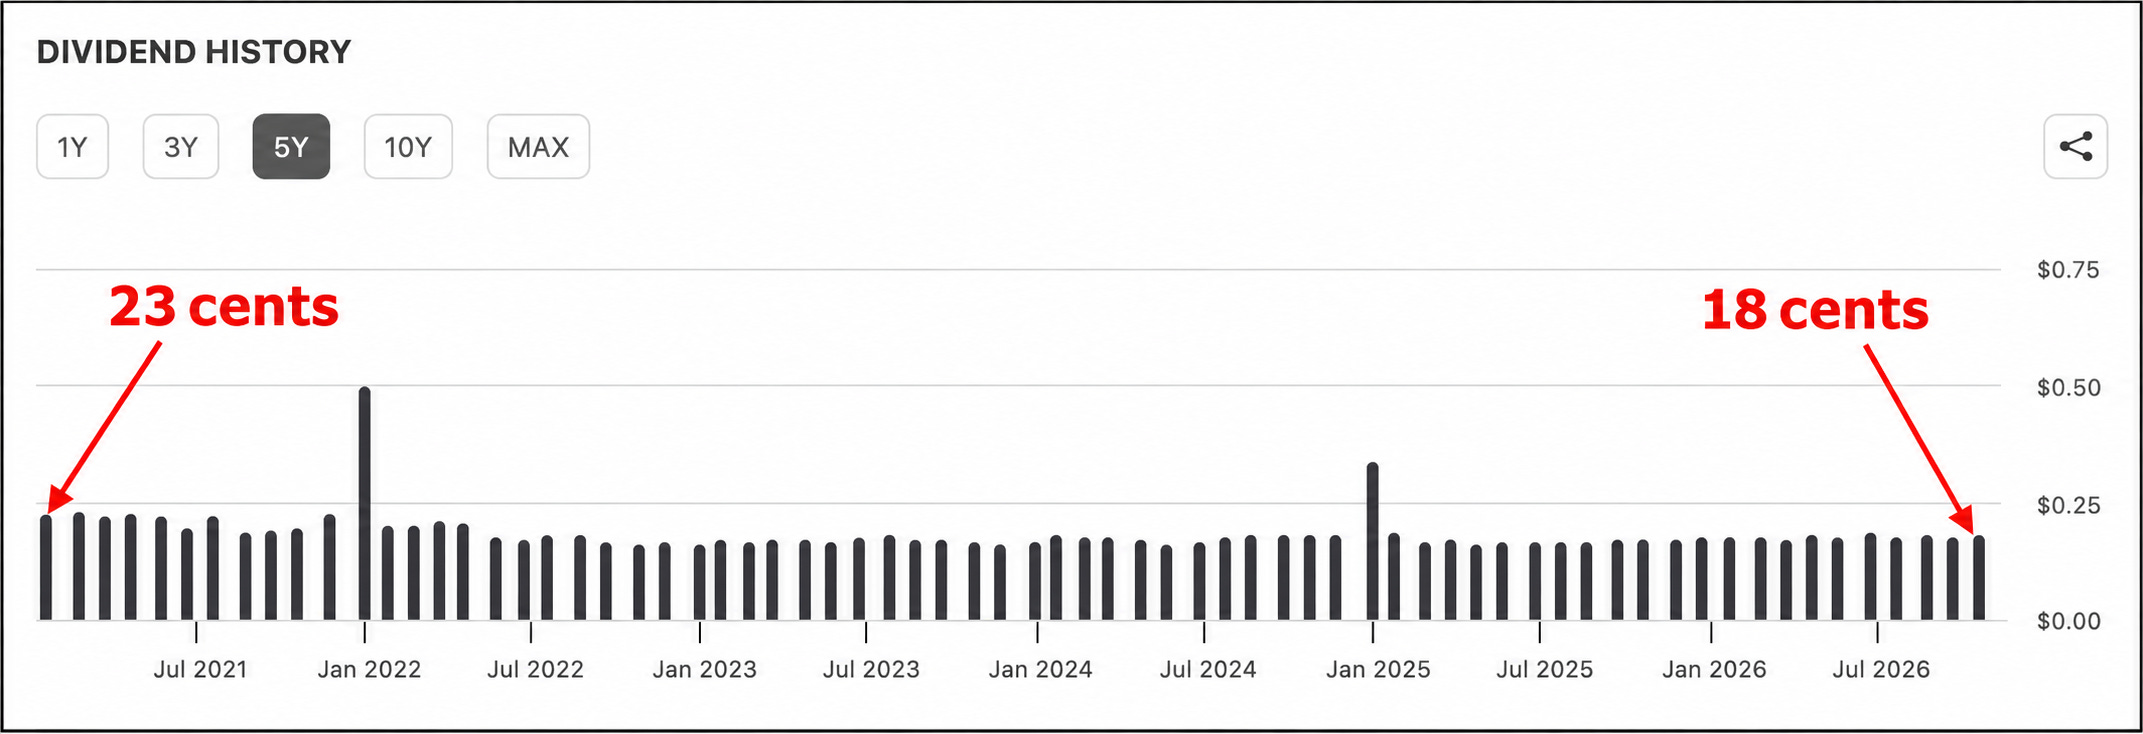
They went from paying 23 cents per share, down to 18 cents per share.
That’s an issue for investors who need sustainable income.
You’ll notice out of the funds we’re looking at today, only GPIQ has positive NAV growth over the last year…
📊 Total Returns
Ultimately, total returns matter.
And this is where we really start to see performance separated between these funds.
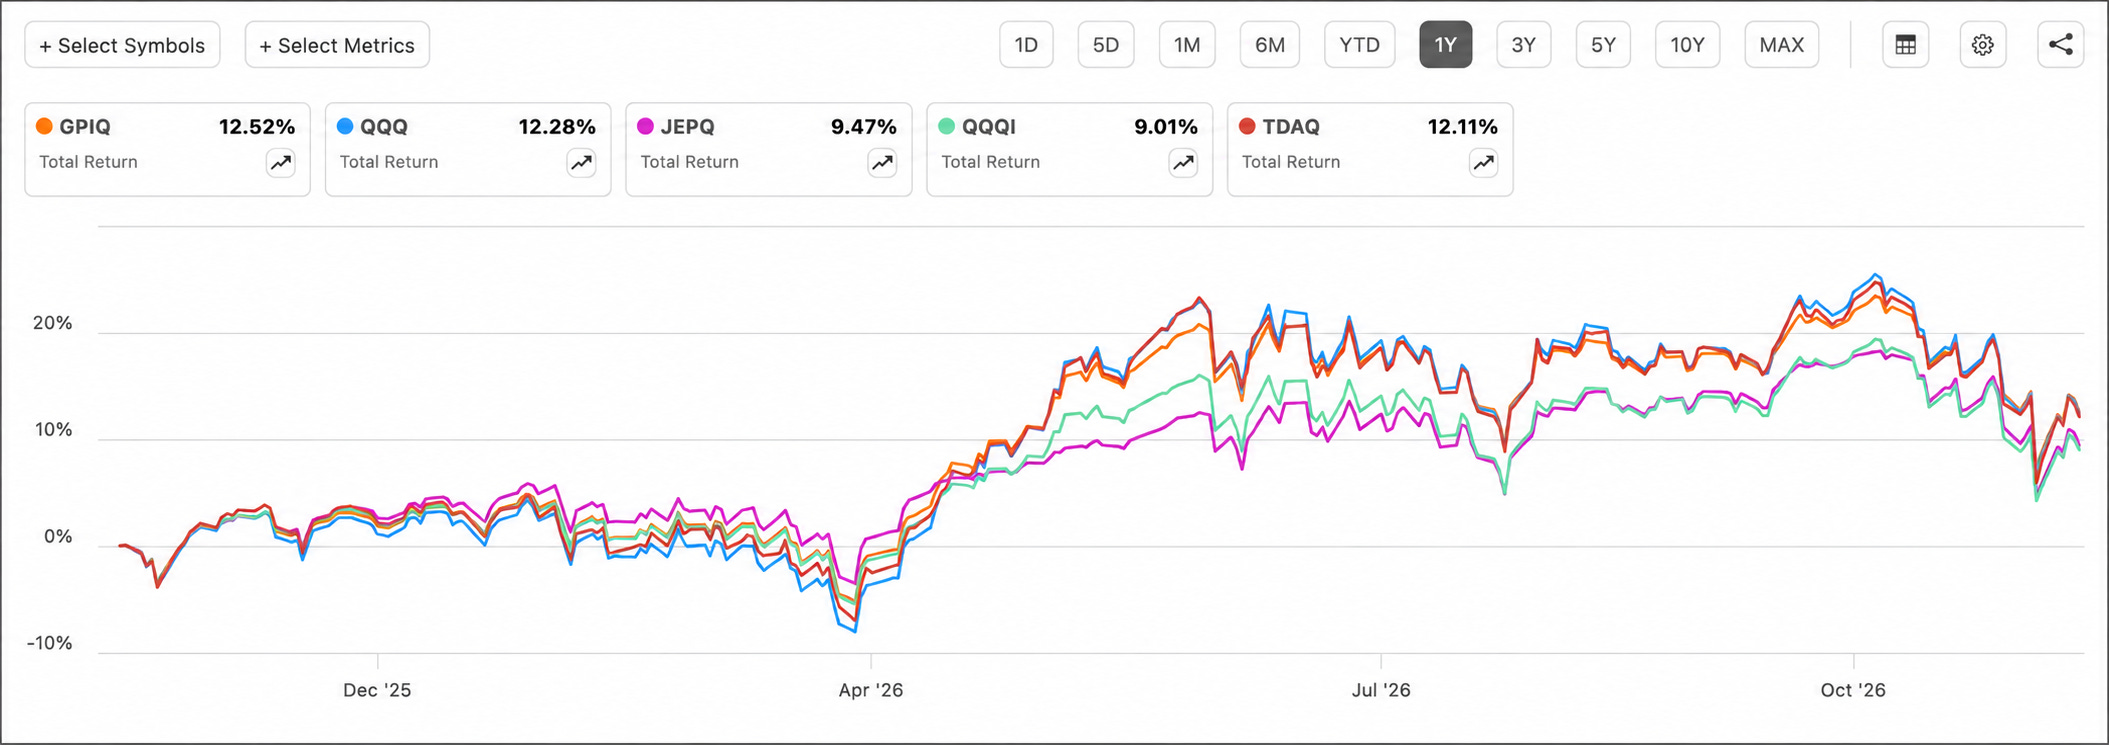
GPIQ was the only fund that managed to actually outperform QQQ.
How could this be the case?
It comes down to two primary reasons:
Goldman Sachs generally sells calls against 25% to 75% of GPIQ’s portfolio exposure
When the market moves sideways or rises modestly, premiums collected can exceed the cost of settling the calls, adding to the return from the stocks
Now let’s put that in English.
When an option income ETF is writing calls against the entirety of its underlying portfolio, it limits the upside significantly.
GPIQ only has options written on 25% to 75% of the portfolio, allowing them to take more part in the upside-
Which is why they have positive share price performance in the last year.
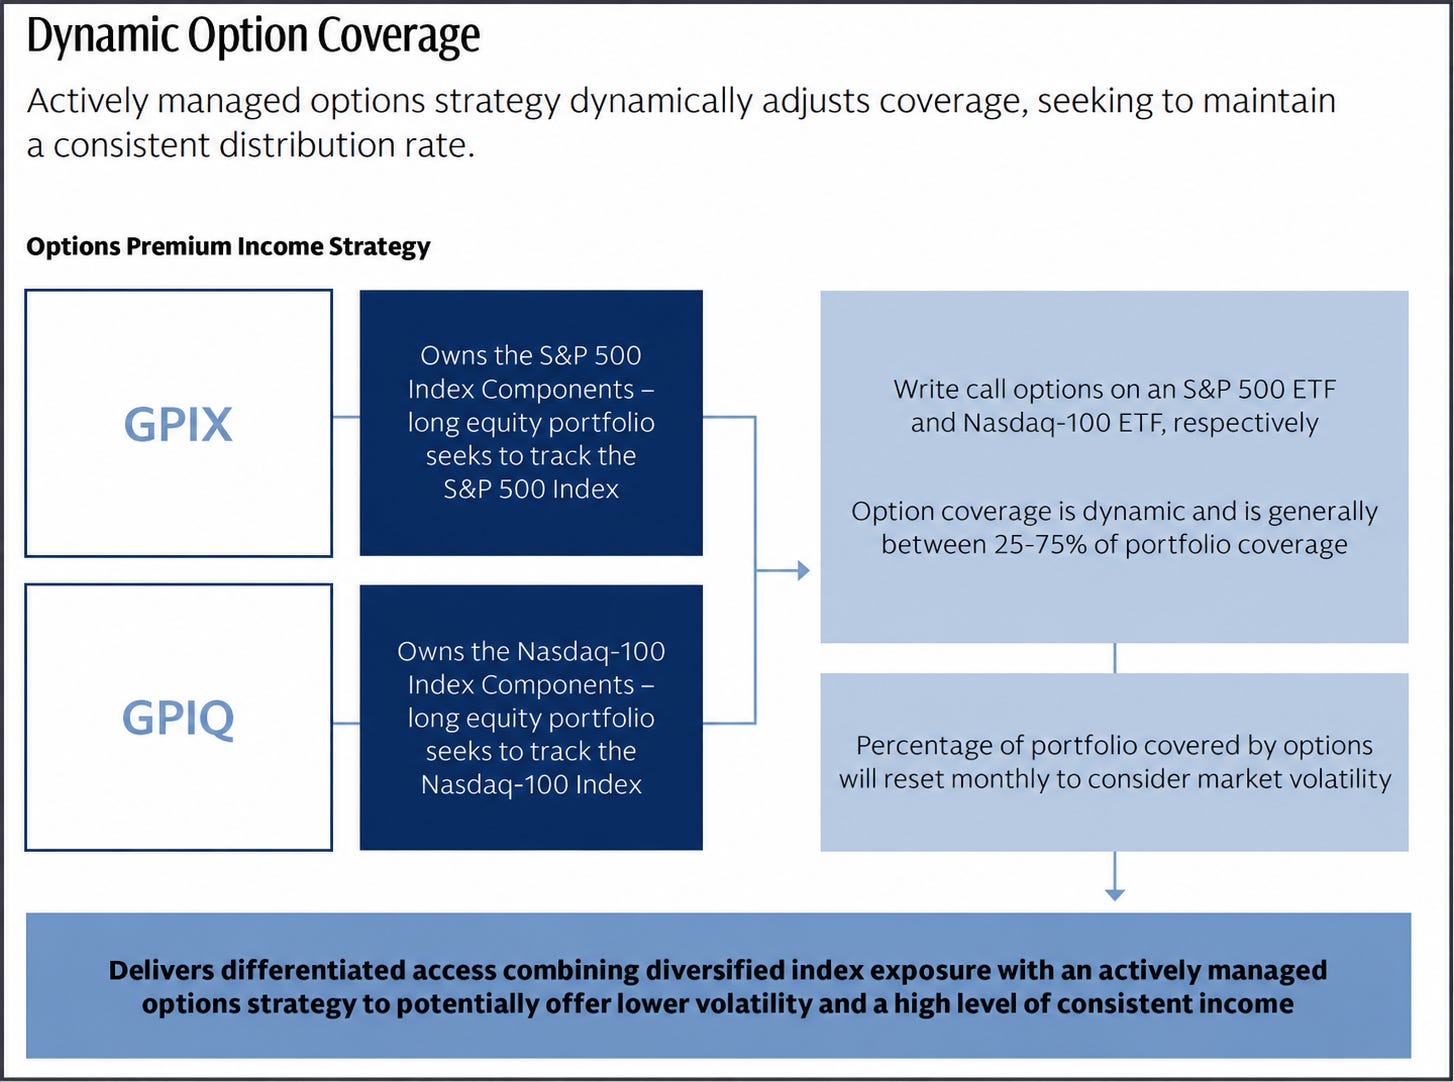
In regards to the second point…
Basically these funds perform better in sideways/choppy markets with increased volatility-
Which is exactly what we’ve seen over the last few months.
So not only is GPIQ structured correctly to have a chance to outperform, it has also been operating in an optimal market environment.
And that growth in share price they’ve seen has also led to growth in their distributions over time.
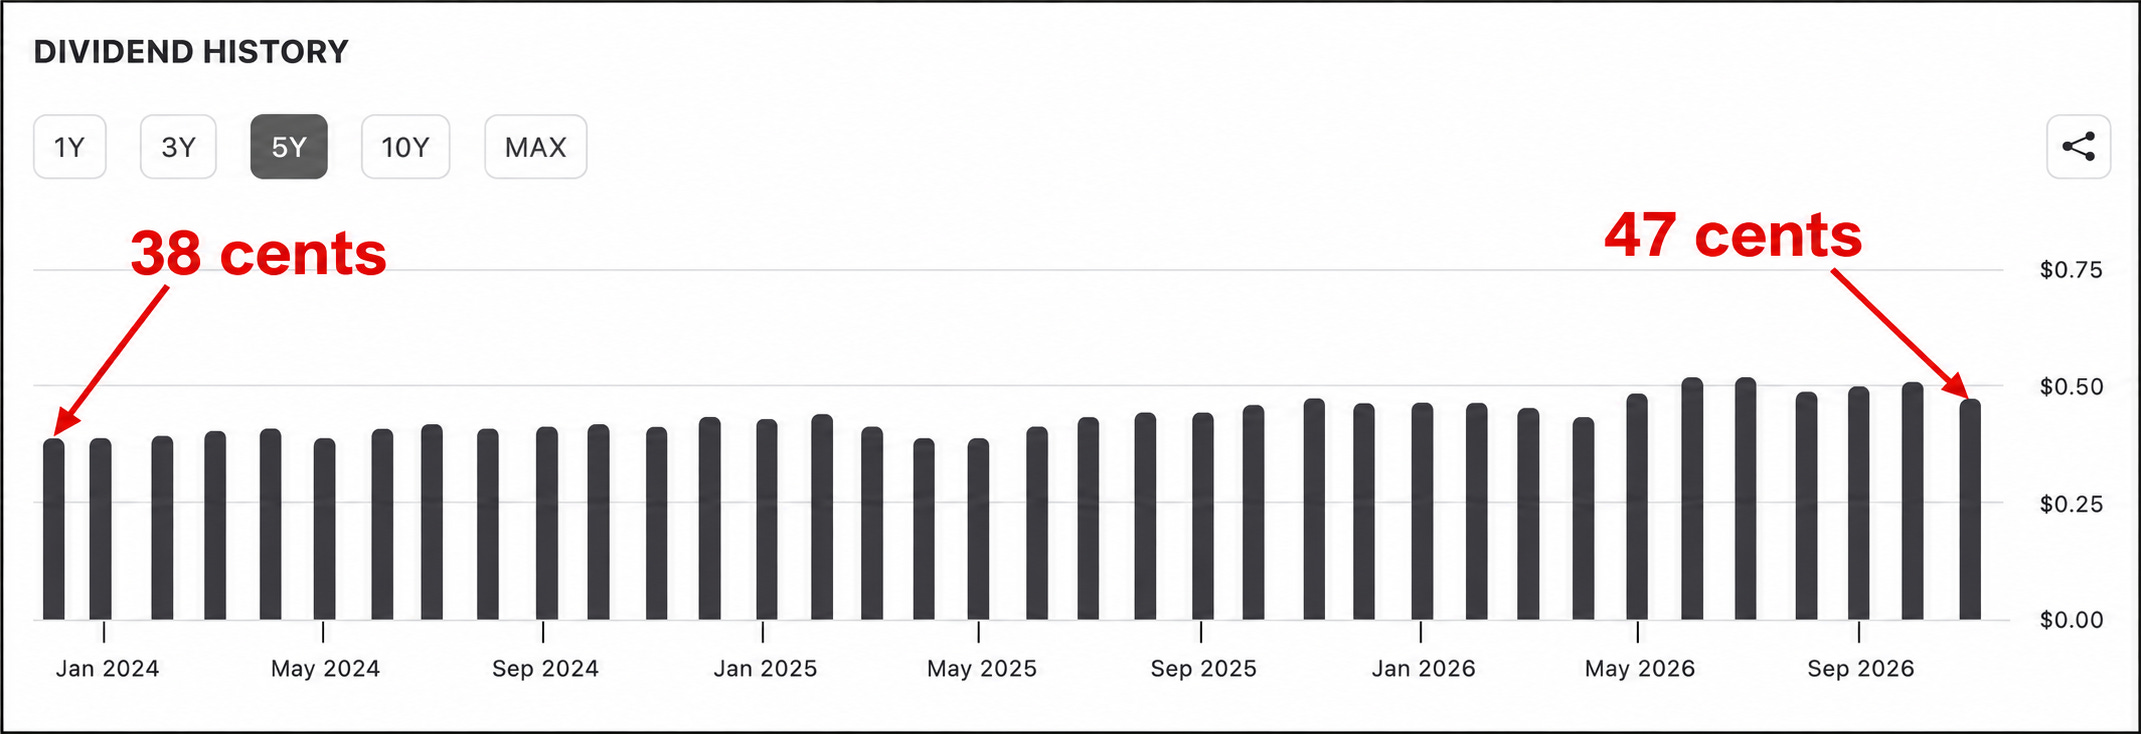
That’s quite a difference from their peer, QYLD.
🔍 What About The Others?
None of the other ETFs outperfomed QQQ-
But most of these funds are designed by nature to underperform their underlying index over time.
However, some captured much more of the upside than others.
In fact, TDAQ captured an impressive 98.6% of the upside, while also providing a 17.88% yield!
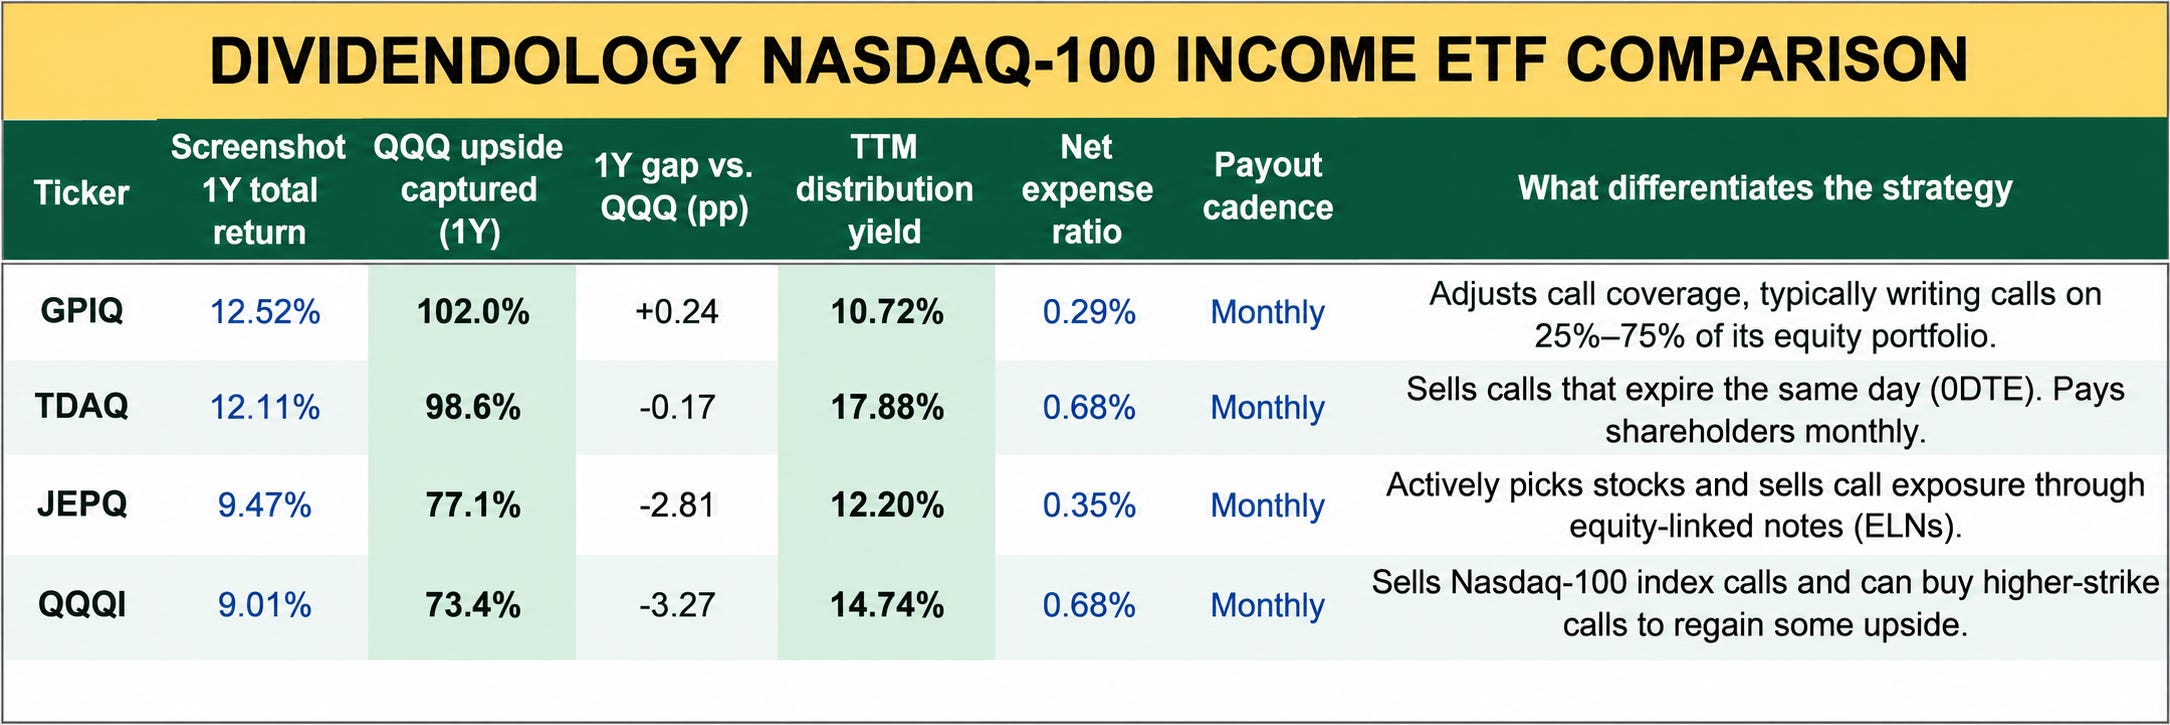
This was primarily due to their unique structure, where they sell call options that expire the same day.
Because the calls expire daily, yesterday’s strike no longer limits participation in the next days rally.
That helps if the Nasdaq climbs through a series of smaller daily gains.
However, JEPQ and QQQI fell behind.
TDAQ, JEPQ, and QQQI all typically use close to 100% portfolio options coverage, which pushes their yield higher-
But caps more of the upside.
But JEPQ only captured 77.1% of the upside (likely due to the fact they actively pick stocks).
QQQI only captured 73.4% of the upside, but also keep in mind their distributions are significantly more tax efficient in the short term than JEPQ.
🎯 So What Now?
Each of these ETFs has strengths and weaknesses.
But there is no doubt that some are structured better for the investor looking for long term, sustainable income.
These ETFs have minor differences that do play a major role in their performance.
And this past month has given us an incredible case study in how they operate in different market environments.
I am constantly researching and compiling data on these ETFs to add to the Dividendology Database.

Traditional investment softwares don’t tell you the critical information like:
Portfolio options coverage
Options moneyness
What differentiates the strategy
This is why I continue to build out the Dividendology Database.
And it’s why I’m excited to share that I’m working on a VERY important project-
An MLP/Midstream Database for members of Dividendology.
Midstream stocks have been some of the most compelling high yield investments over the last 5 years.
So much so, that the midstream ETF, AMLP, has basically doubled the performance of the tech heavy S&P 500 over the last 5 years.
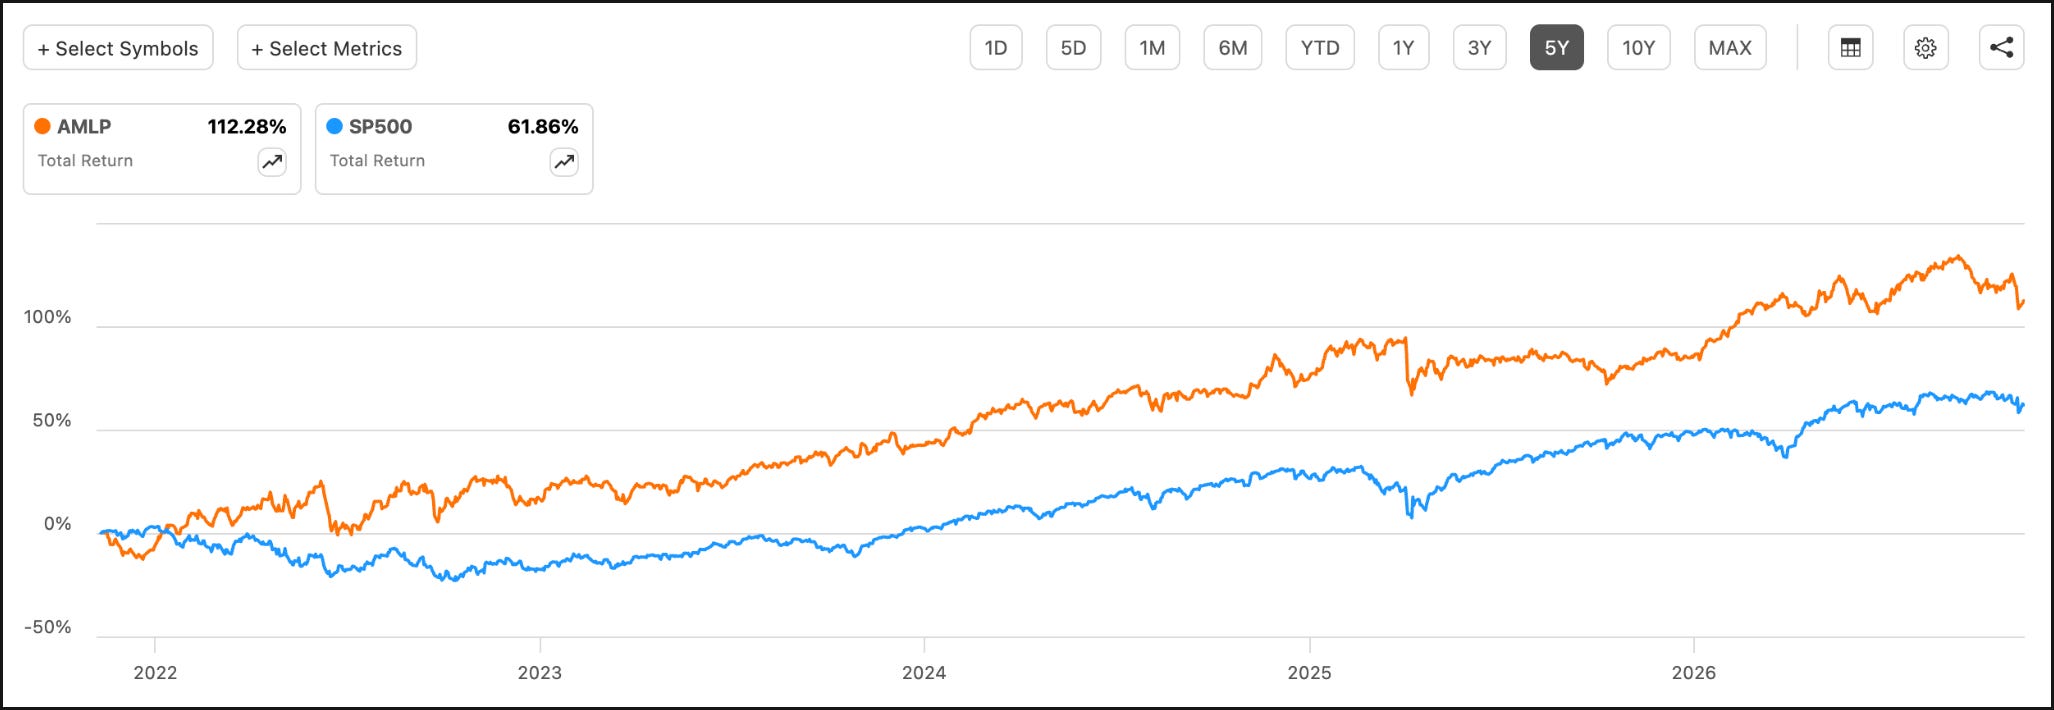
Even after this run in share price, there are some incredible high yield opportunities in the midstream space.
The goal of the database will be to help us identify some of the best opportunities in the Midstream space-
And have access to the data that is incredibly difficult to get that most softwares don’t cover for this asset class.
We are targeting a release date for this Midstream Database of November 23rd.
If you want to get access to the Dividendology Database and the new release, as well as all the features mentioned below, you can do so here:
See you soon!
Dividendology
Check out these resources:
Tickerdata 🚀 (My automated spreadsheets and instant stock data for Google Sheets!)
Interactive Brokers 💰 (My favorite place to buy and sell stocks all around the world!)
Seeking Alpha 🔥 ($30 off! + 7 day free trial)
The past month is the cleanest test of what these funds are. QQQ is down 7.9%. QQQI fell 8.0%, GPIQ 7.7%, JEPQ 7.3%. Add back a month of distributions, roughly 1%, and the "income" cushioned almost nothing. That's the design: a covered call sells the upside, it doesn't buy protection on the way down.
The next part is less visible. The premium these funds collect depends on volatility. The VIX peaked at 28.4 this month and closed Friday at 19.3, after a 30% drop in one week. So the calls they write now pay noticably less, on a NAV that's already about 8% lower. Smaller base times smaller premium is the same mechanism that took QYLD's payout from 23 to 18 cents.
GPIQ's partial overwrite helps on the rebound, as you show. But for anyone holding these for income, I'd watch the next two or three distributions more than last year's total return. If they shrink while the Nasdaq recovers, the fund gave up both ends.
Coverage percentage is the number I wish every one of these funds printed right next to the yield. Writing calls on only part of the book is the whole reason GPIQ kept up. The thing I'd flag for anyone buying after this month: these funds look their best right after a choppy stretch, and a sharp V-shaped rebound is exactly where the full-coverage ones fall furthest behind. The NAV line tells you more than the yield ever will.