

Options based ETFs have now gone from under $10B in assets under management in 2020, to over $300B in 2026.
That is a 30x increase!
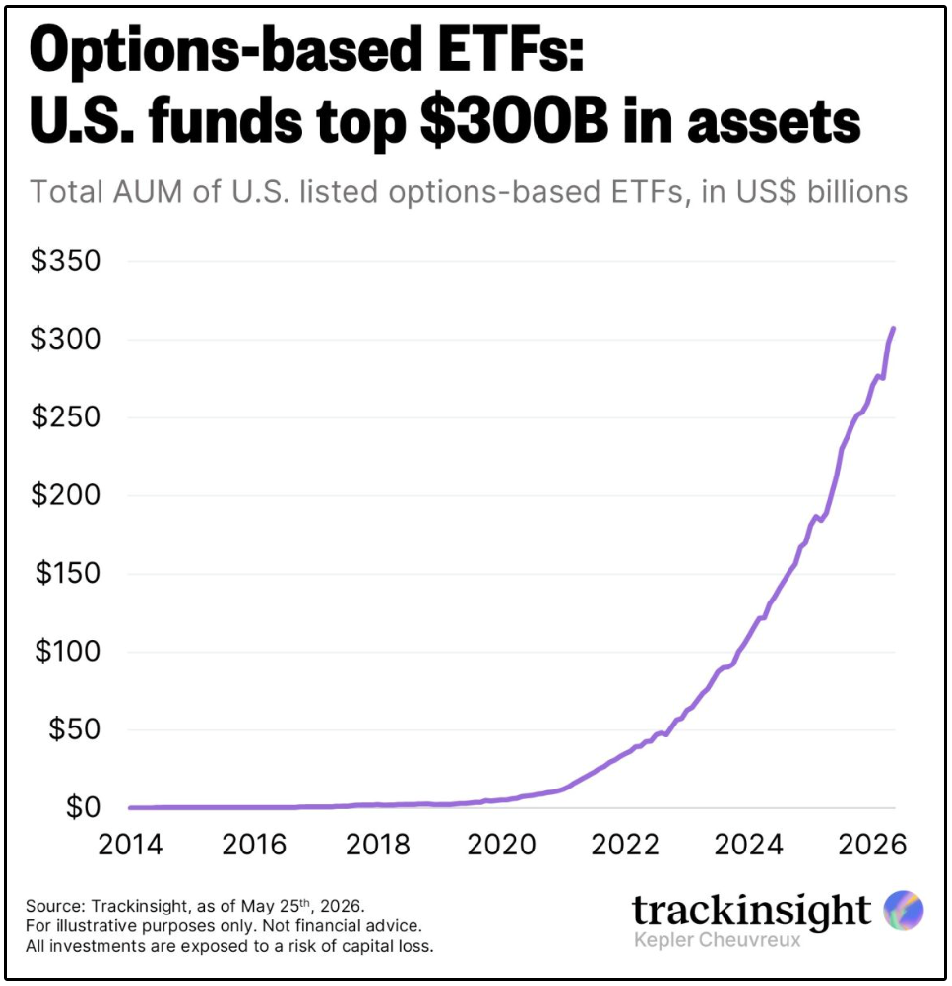
Of course, a large portion of this growth is coming from ‘option income ETFs’.
Investors are starved for high yield opportunities.
However, not all covered call ETFs are created equal.
In fact, as I’ve tried to warn many times before-
Many covered call ETFs are incredibly dangerous.
Even funds that have historically had periods where they performed very well can be structured in a way where that performance will certainly NOT last.
Take YieldMax’s MSTY for example.
This fund was considered (by some) to be the gold standard for covered call ETFs just last Summer.
However, after just a few months, the fund:
Saw the share price decline by 80%+
Saw distributions fall by around 85%+
As a result, investors began fleeing this fund at the beginning of this year.
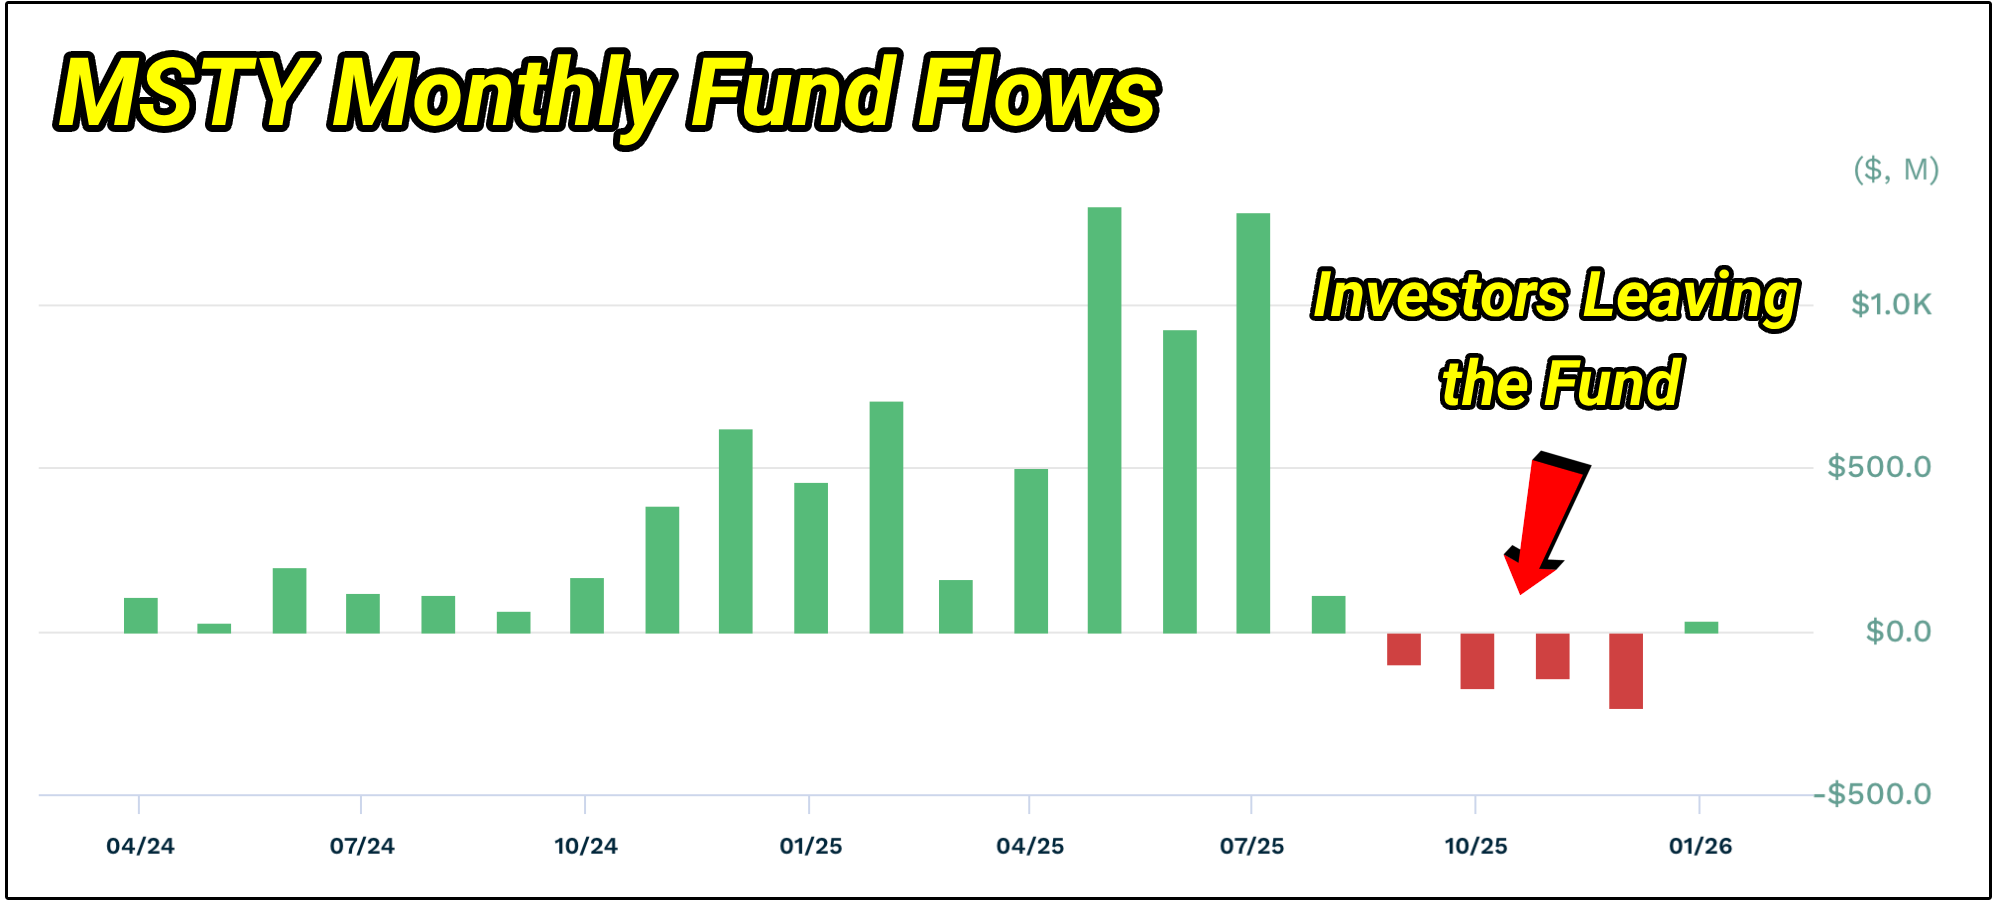
This type of performance can be devastating to those looking to utilize the distributions as a sustainable form of income.
As we continue to build out our High Yield Portfolio on Dividendology.com, we must avoid this type of performance from any funds we add to our portfolio.
Today, we will be looking at the 4 Highest Yielding Covered Call ETFs with No NAV decline, and then assessing if that performance is actually still sustainable.
📊 Dividendology Database
I recently updated the Dividendology Covered Call ETF Database (and added a European Option Income Database as well), adding more data to actively track performance.

We are currently actively tracking over 70 different ETFs in the database.
Out of the 70 ETFs in this database, less than 40% have actually grown their NAV over the last year!
Most covered call ETFs are simply liquidating themselves to make payments.
My ideal option-income ETF would accomplish three things:
Generate meaningful and reasonably sustainable monthly cash flow.
Preserve or grow NAV over time.
Retain at least some participation in the upside of its underlying holdings.
Let’s review the top performing covered call ETFs in the last year.
1. 🥇 QYLG - Global X Nasdaq 100 Covered Call & Growth ETF
The Global X Nasdaq 100 Covered Call & Growth ETF, ticker QYLG, was the highest-yielding fund in this screen that also produced positive one-year NAV growth.
This one is certainly less popular than most Covered call ETFs at just $129M AUM, but has a unique structure that allowed it to perform very well over the last year.

The fund owns the companies in the Nasdaq-100 and writes call options on approximately 50% of the portfolio.
I’ve touched on this many times before, but it’s worth explaining again.
Covered call ETFs generate income by selling call options on the assets they hold.
If the NAV shrinks over time, the ETF has fewer assets to write calls on.
Fewer assets = lower premiums = smaller dividend payments.
Here’s how this actually works and why NAV growth is so important:
More income potential: A rising NAV gives the fund more assets to write calls against, which increases the size of future dividends.
Protection against erosion: If NAV falls too far, the ETF can’t recover during market rallies, because the calls it writes cap the upside. This is a big one, and it creates what I call “NAV bleed.”
Because QYLG has 50% of its portfolio uncovered, half the portfolio retains its full upside exposure.
This creates a middle ground between owning the Nasdaq-100 outright and writing calls against the entire portfolio.
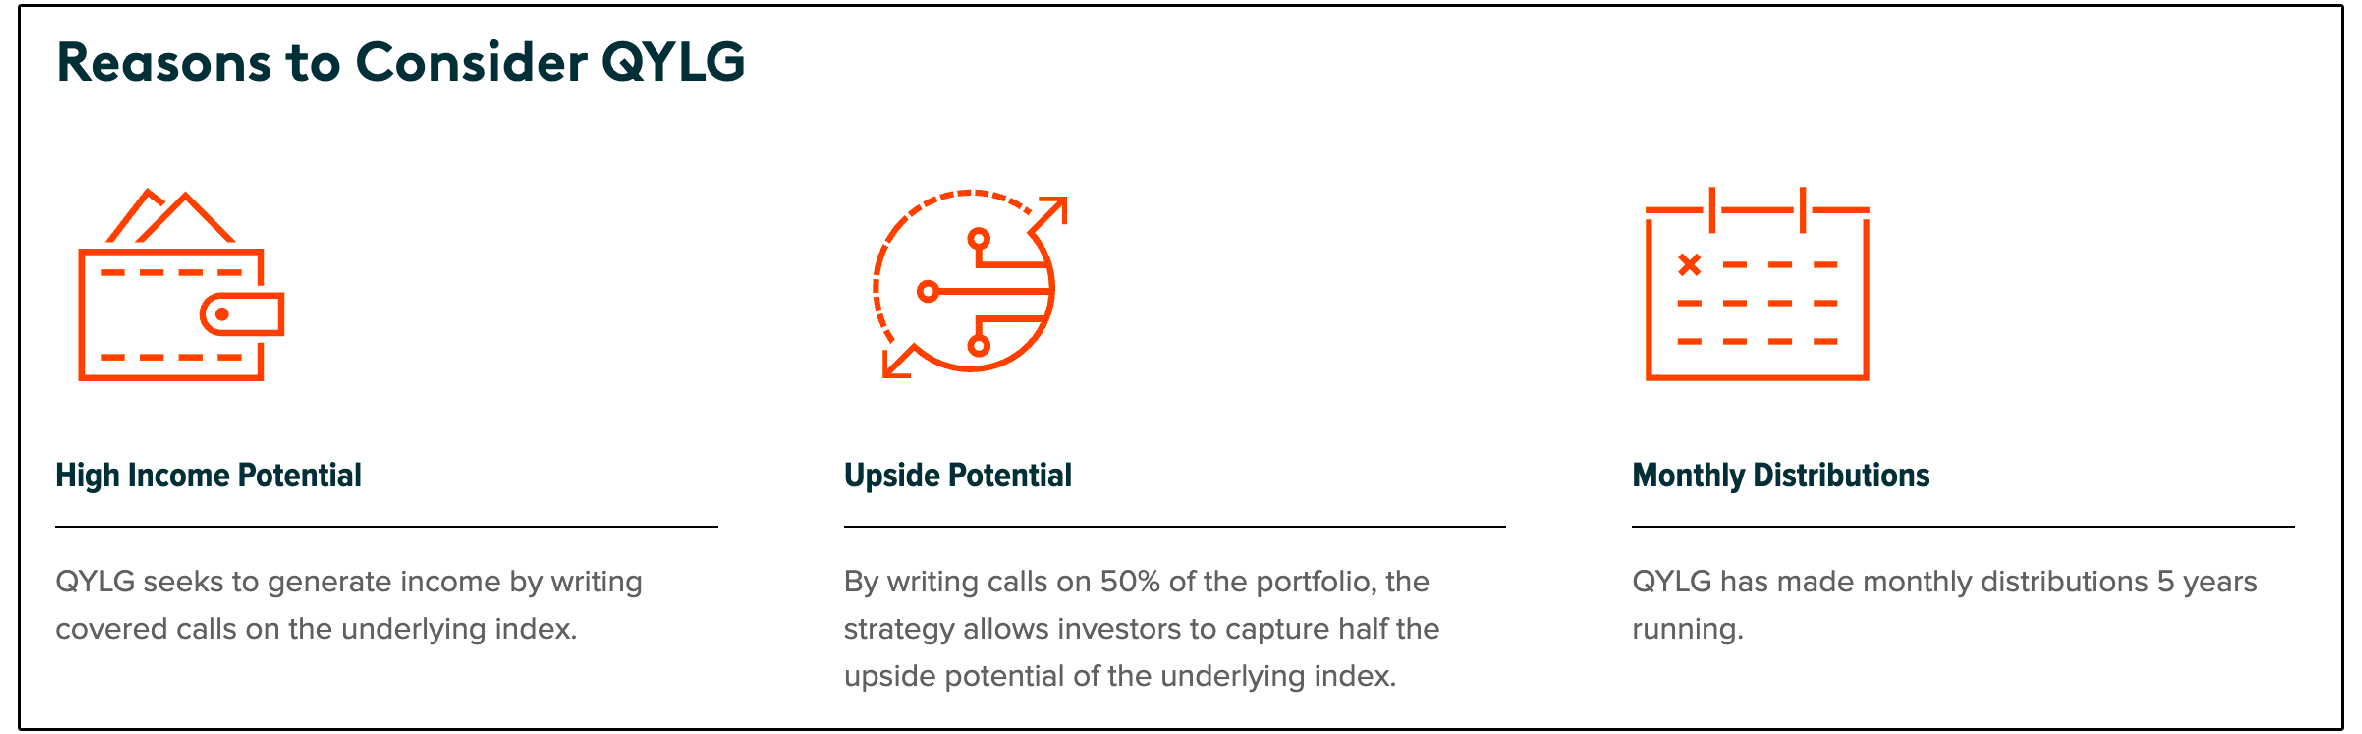
In other words, QYLG is designed to operate best in bull markets.
QYLG can participate more fully in the appreciation of companies such as Nvidia, Apple, Microsoft, Amazon, Alphabet and Broadcom.
As of August 31, 2026, information technology represented 58.7% of the portfolio, so this is still a technology-heavy investment despite its income focus.
QYLG’s distribution history also contains several unusually large payments around year-end.
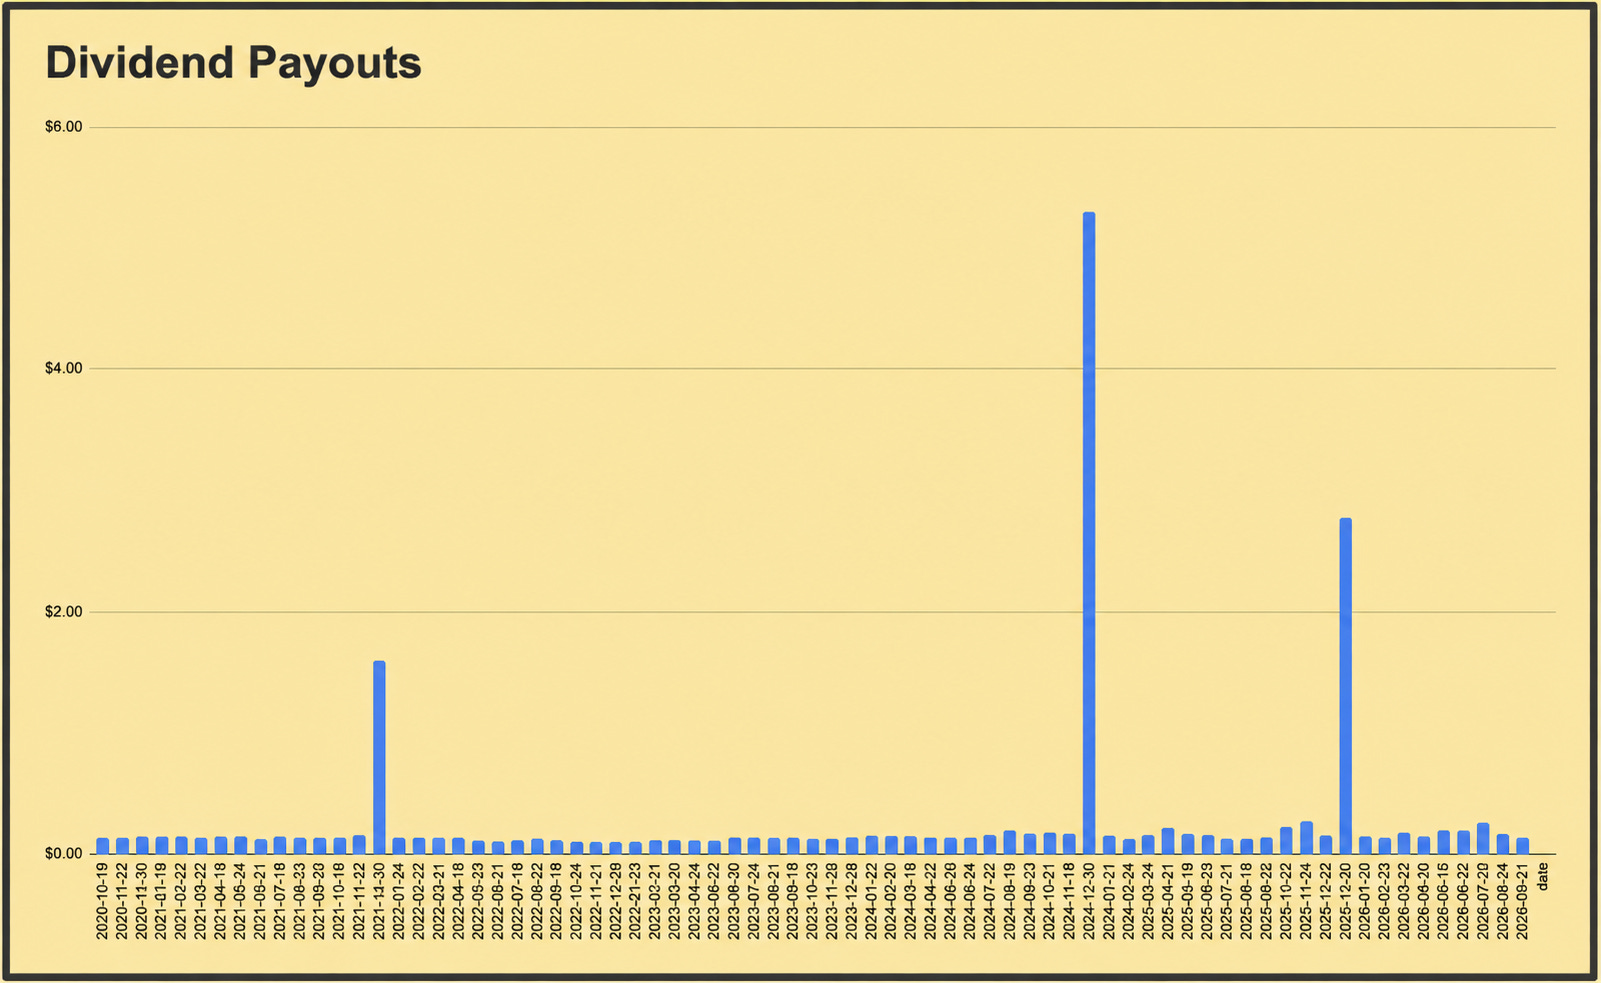
To avoid being taxed at the corporate level, the fund must distribute at least 90% of its taxable income and realized capital gains to shareholders each year.
So when a fund like QYLG has a great year and has realized gains, they typically have to make an end of year distribution.
But keep in mind, when a fund makes a large catch-up distribution, the NAV drops by that same amount because distributions are paid out of the fund’s assets.
So, while investors receive the cash, the share price adjusts downward.
It’s the same total value, just shifted from NAV into your pocket.
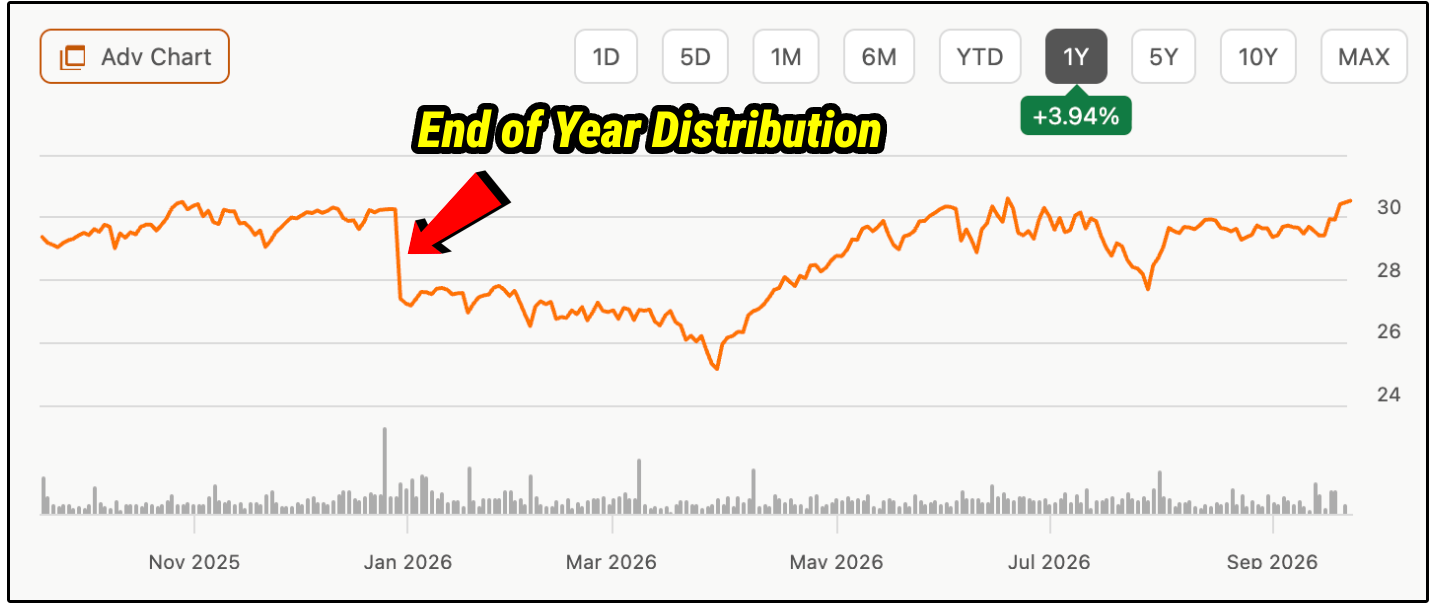
The more important question is what happens to NAV after those payments.
QYLG’s partial option coverage gives it a better opportunity to rebuild NAV during strong Nasdaq rallies, although it also provides less option premium and less downside cushioning than a fully covered strategy.
QYLG may be the most growth-oriented fund on this list.
Its main risk is that the attractive recent result depended heavily on a strong period for mega-cap technology.
A weaker Nasdaq environment would test how well the distribution holds up.
2. 💻 KQQQ - Kurv Technology Titans Select ETF
The Kurv Technology Titans Select ETF, ticker KQQQ, was the second-highest-yielding fund to pass the screen.
It offered a 16.06% yield, but its NAV increased by just 0.02% during the previous year.
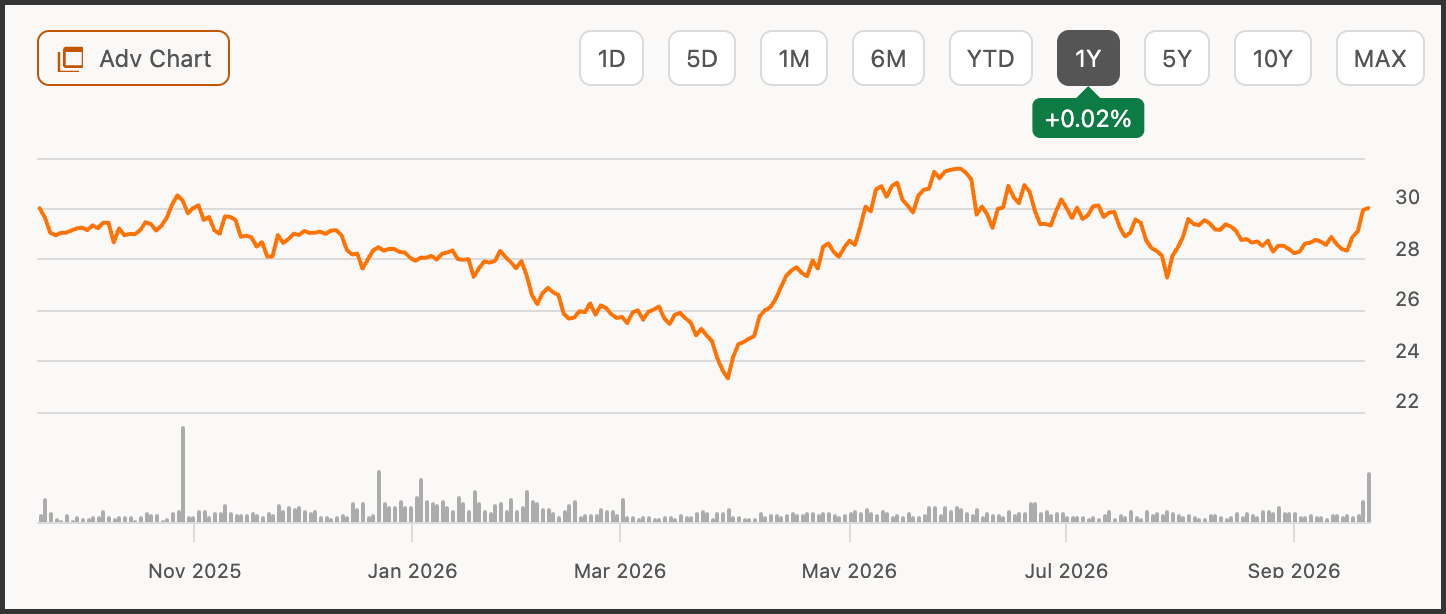
Technically, that qualifies as positive NAV growth.
KQQQ is an actively managed fund that concentrates on a group of high-conviction technology companies while using options to generate monthly income.

Its calls are generally written out of the money, allowing the underlying holdings to appreciate before the strike price begins limiting additional upside.
However, the fund runs close to 100% portfolio coverage, so most of the portfolio is still subject to an upside cap.
The fund seeks exposure through a combination of technology stocks, derivatives and underlying Kurv ETFs.
This creates a more concentrated and complicated structure than simply owning the Nasdaq-100.
For reference, Google, Amazon, and Broadcom make up almost 30% of the underlying holdings.
KQQQ can benefit when its selected technology companies outperform, but it therefore also carries greater security-selection risk.
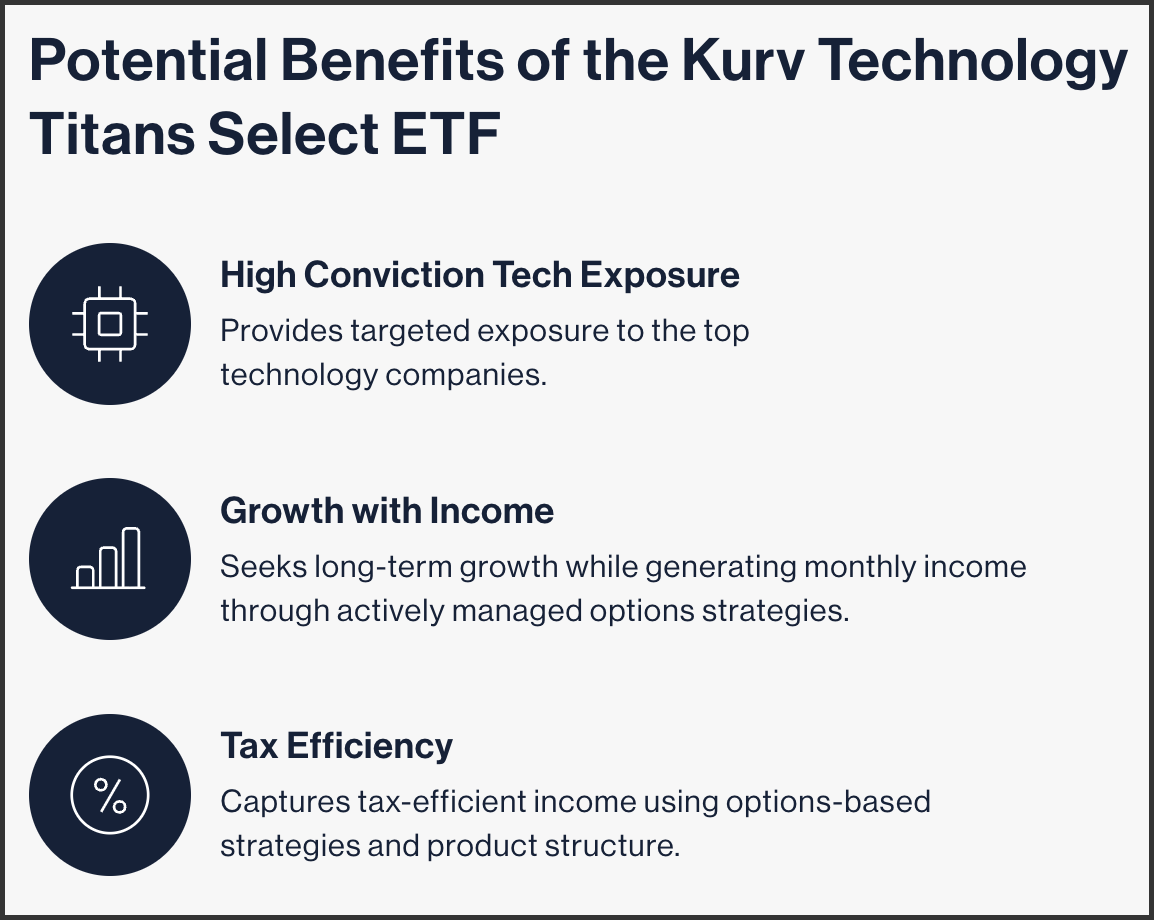
KQQQ is the most expensive fund in the group.
It has a 0.99% expense ratio in the database.
That expense ratio is nearly three times QYLG’s, creating a higher hurdle before shareholders receive any return.
Time will tell if the stock selection process will pay off for the fund.
The 16.06% yield is obviously attractive, and out-of-the-money calls provide more breathing room than at-the-money calls.
Still, the combination of nearly full option coverage, concentrated technology exposure, a small asset base and a high expense ratio makes KQQQ the fund I would watch most carefully for future NAV erosion.
3. 🏢 IWMI - NEOS Russell 2000 High Income ETF
The NEOS Russell 2000 High Income ETF, ticker IWMI, offers a very different type of exposure.

Instead of relying on the mega-cap technology companies that dominate the Nasdaq-100, IWMI invests around the Russell 2000 small-cap universe and overlays an actively managed call-option strategy.
Its yield was 14.13%, and its NAV increased 2.27% during the previous year.
Like most NEOS funds, this ETF has become quite popular, with approximately $1.29 billion in assets and a 0.68% expense ratio.
One of the huge advantages most NEOS funds offer is NEOS tax efficiency.
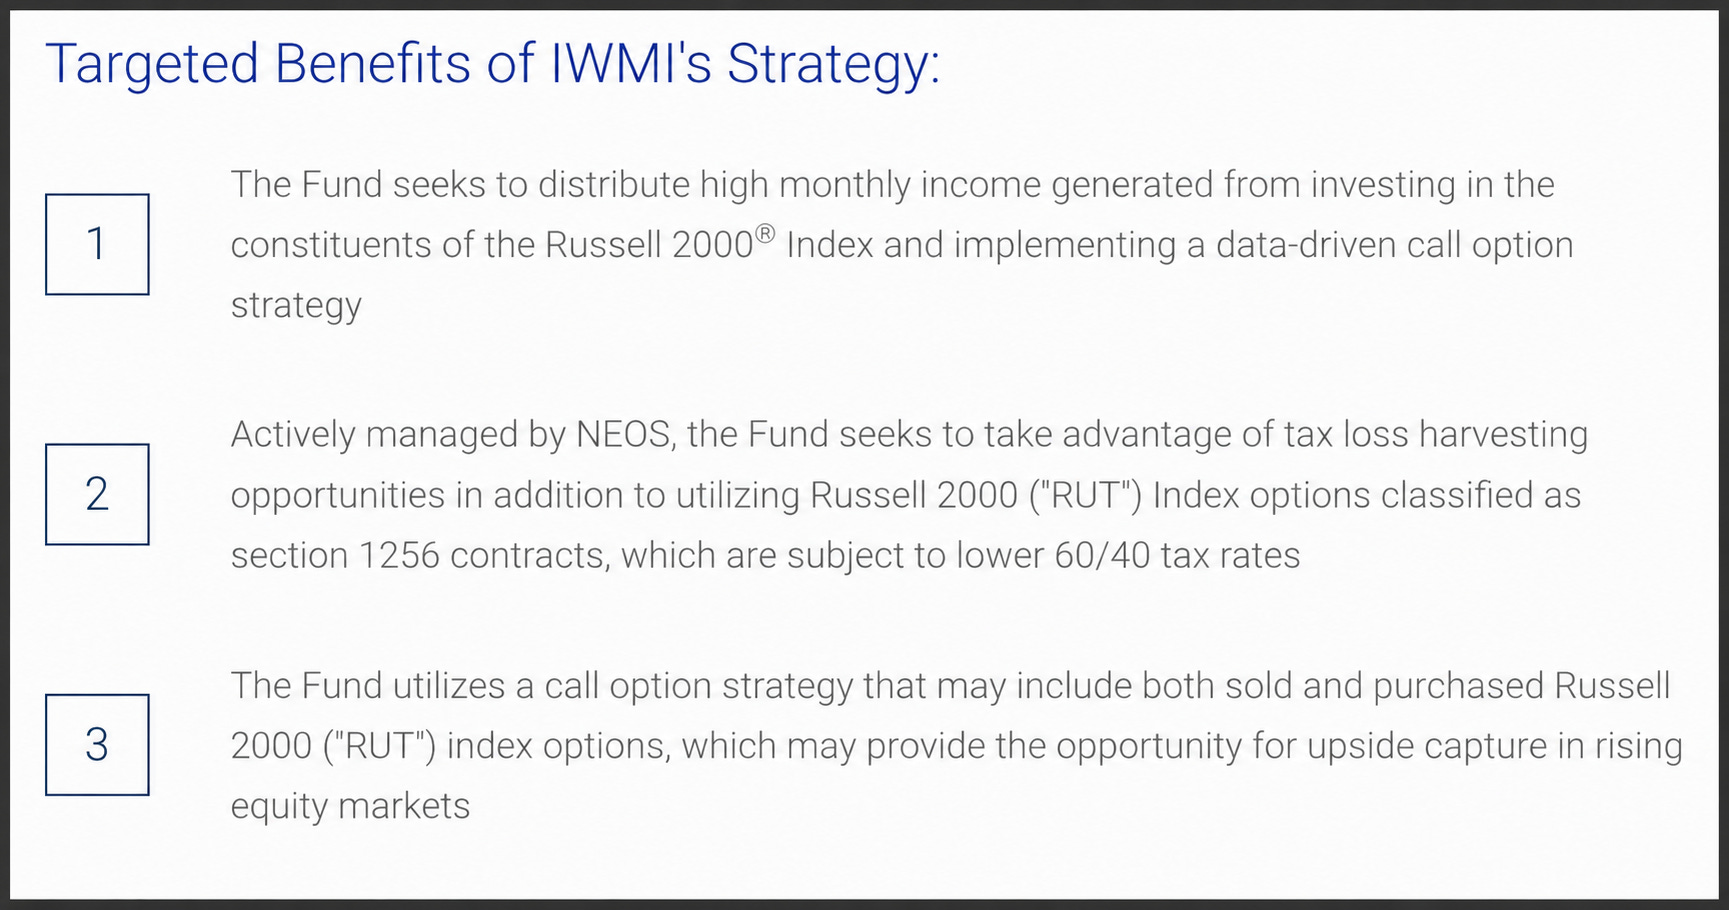
IWMI uses Russell 2000 index options that are treated as Section 1256 contracts, which generally receive 60% long-term and 40% short-term capital-gains treatment regardless of holding period.
The managers may also use tax-loss harvesting when opportunities arise.
We will see a great example of this with our next ETF below.
IWMI generally writes out-of-the-money calls on approximately 75% to 90% of the portfolio-
So the Russell 2000 can rise to the strike price before the options begin limiting additional upside. Because part of the portfolio can remain uncovered.
Obviously, investors need to be comfortable with the Russell 2000 itself, which contains smaller, less profitable and often more economically sensitive businesses than the S&P 500 or Nasdaq-100.
Keep in mind, the S&P 500 has led on risk-adjusted returns since 1994…
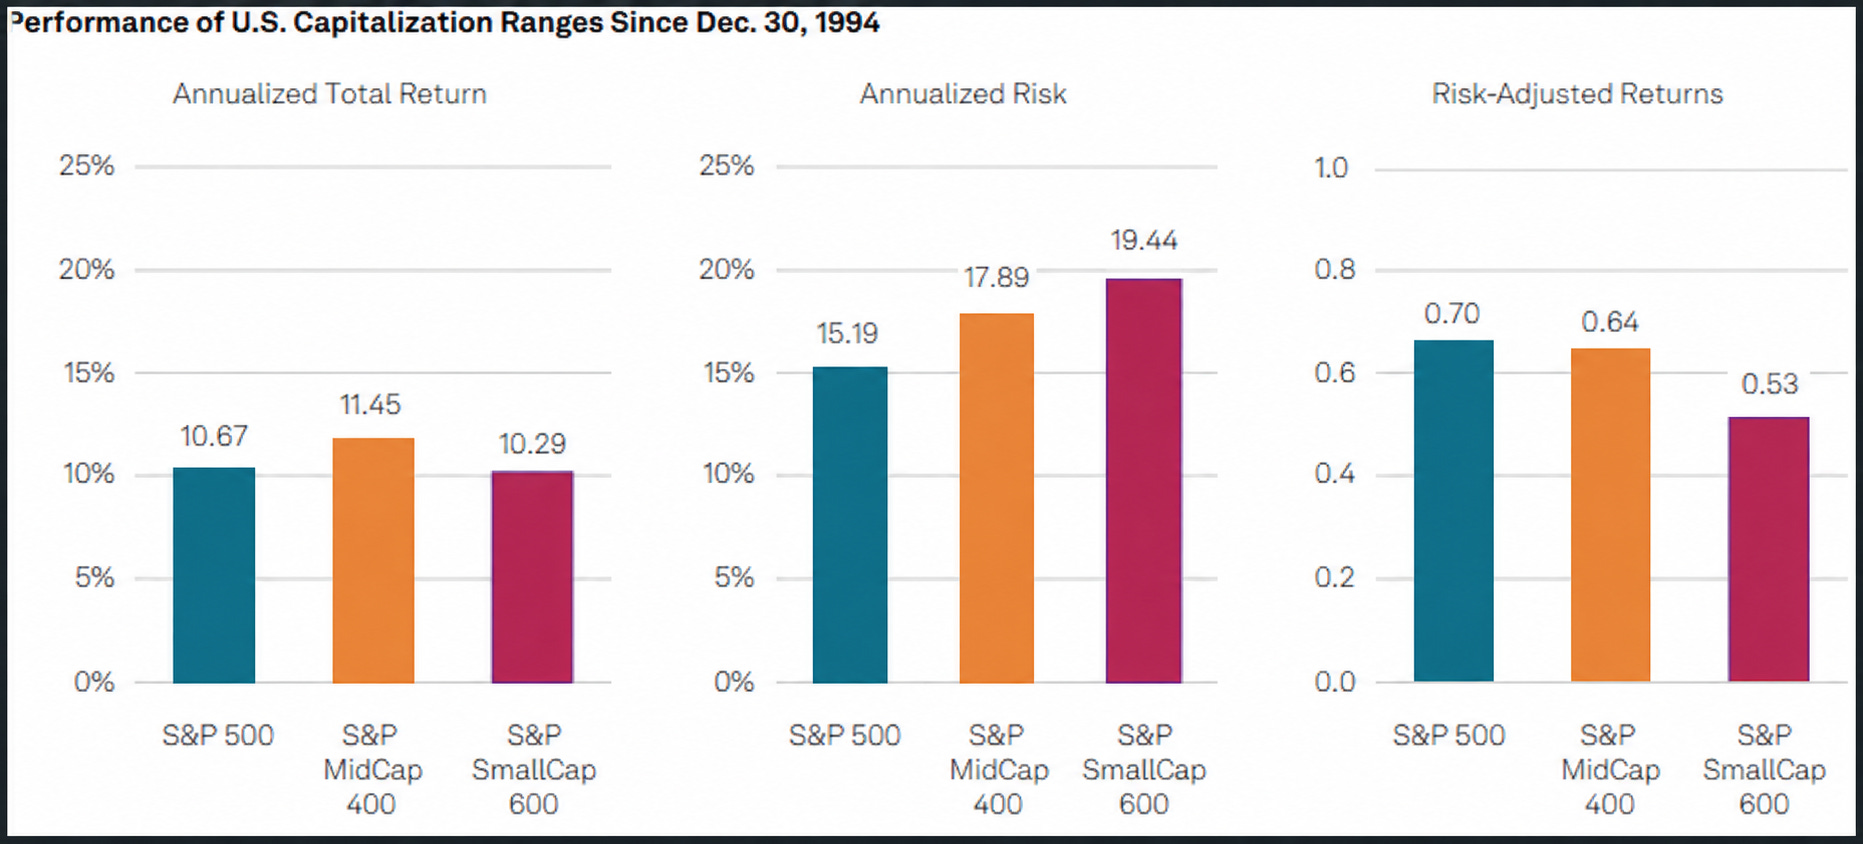
But if small caps have more volatility, it can lead to more option premium, increasing distributions.
4. 🚀 QQQI - NEOS Nasdaq-100 High Income ETF
The NEOS Nasdaq-100 High Income ETF, ticker QQQI, applies a similar framework to large-cap growth stocks.
QQQI seeks high monthly income, tax efficiency and some upside participation.

Like IWMI, it uses index options treated as Section 1256 contracts and may use tax-loss harvesting.
The primary difference is the underlying portfolio.
QQQI provides Nasdaq-100 exposure, giving investors a heavy allocation to large technology and growth companies.
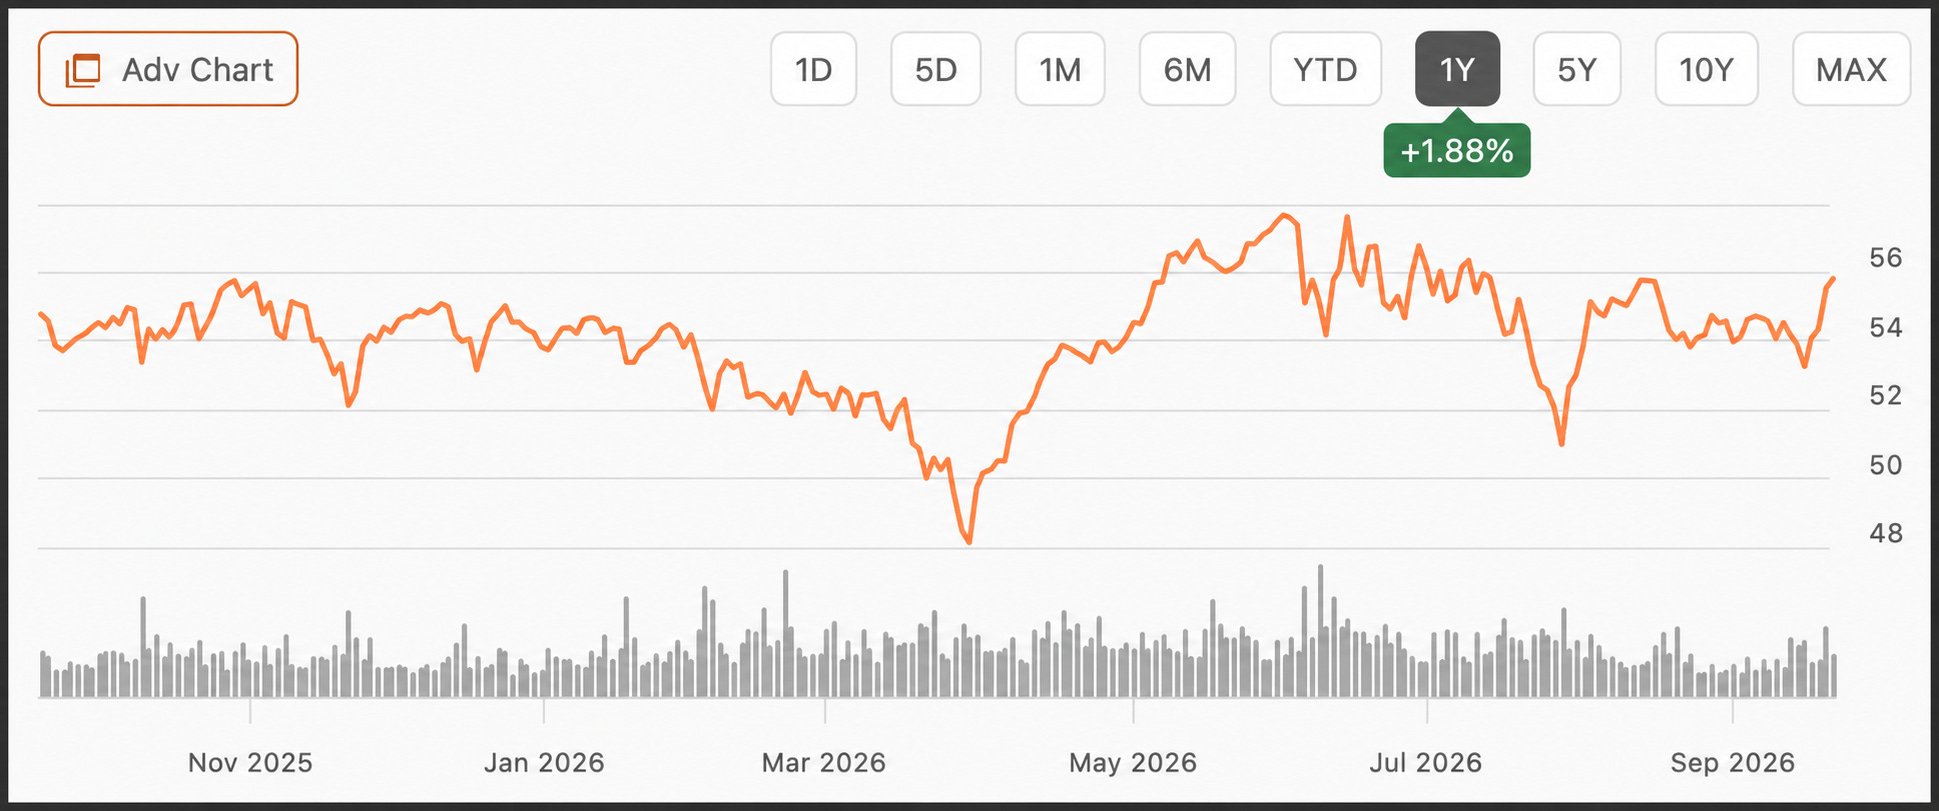
The Dividendology database showed a 14.02% yield and 1.88% one-year NAV growth.
QQQI had approximately $15 billion in AUM, making it dramatically larger than the other three funds in this screen.
I think it is also worth pointing out that QQQI also demonstrated an important characteristic during the 2025 tariff-related selloff.
Its share price fell with the Nasdaq-100, but it recovered rather than remaining trapped in a pattern of permanent NAV erosion (which is common for many of these funds).
Again, one of the huge advantages is from a tax perspective.
So for example of how this actually plays out, I did an in-depth analysis of Nasdaq income ETFs a few months ago, including NEOS’s fund QQQI.
On an assumed $80,000 of annual income, the model shows QQQI and GPIQ owing far less current federal tax than JEPQ because a large share of their distributions is classified as return of capital.
QQQI shows $8,770 in modeled current tax savings versus W-2 wages, followed by GPIQ at $8,116 and JEPQ at $280.
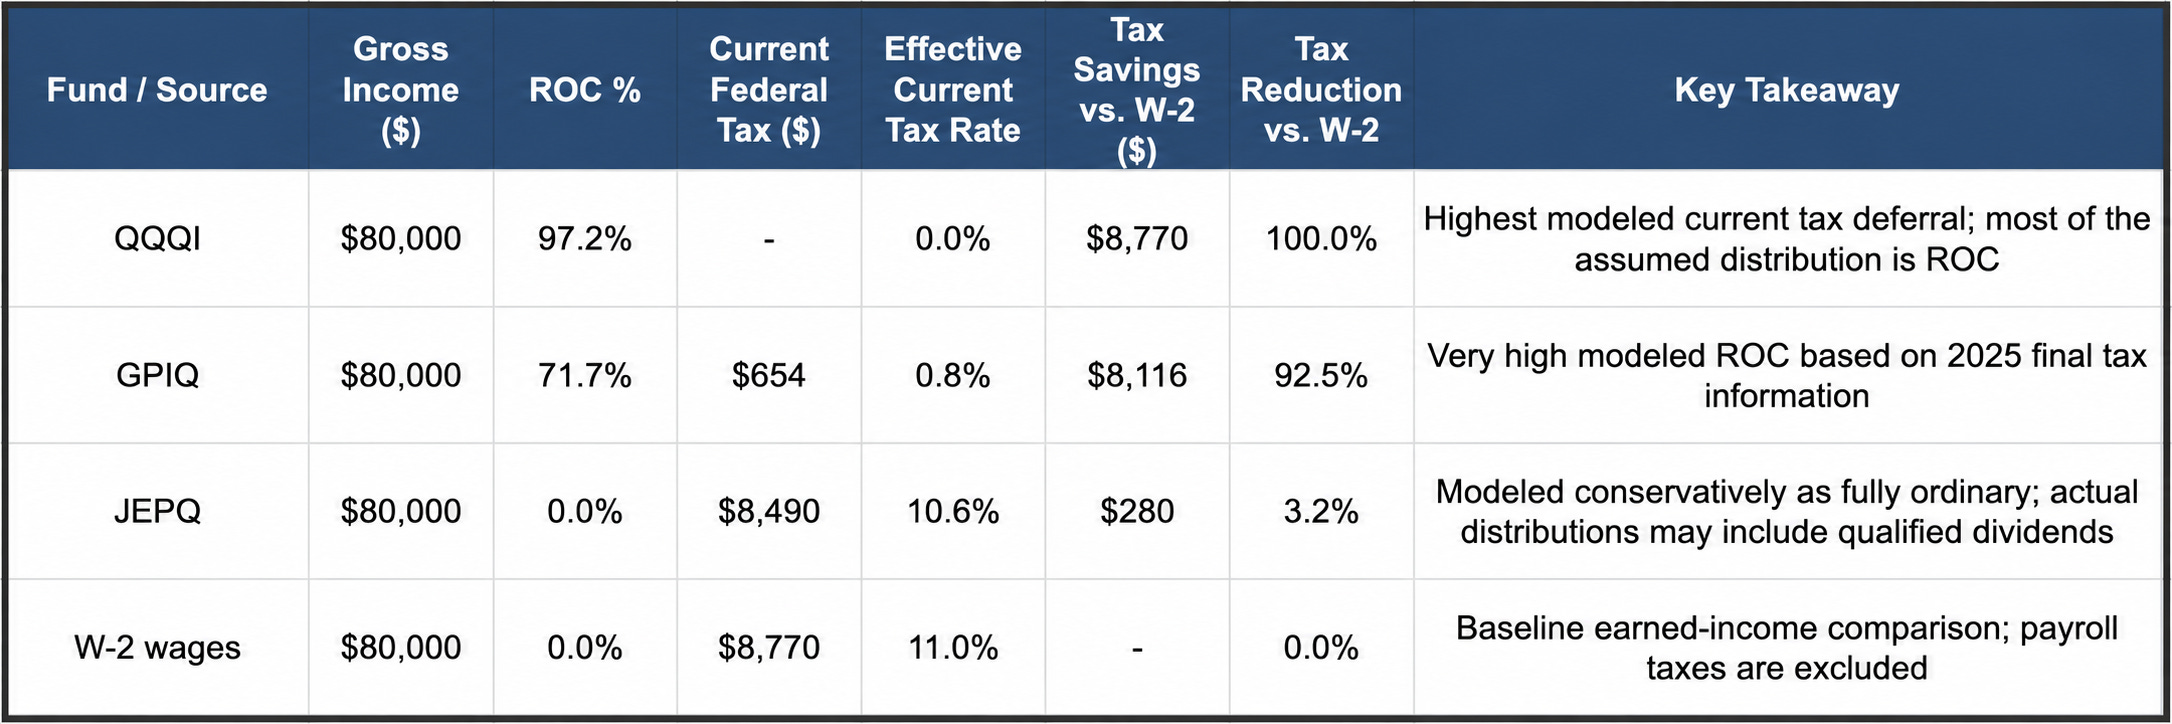
Return of capital generally reduces an investor’s cost basis, so these figures describe current tax deferral rather than permanent tax savings.
Keep in mind, these numbers can change over time.
Compared with QYLG, QQQI generally uses a more extensive and actively managed option overlay.
QQQI writes out-of-the-money calls on close to 100% of the portfolio, while QYLG writes at-the-money calls on only 50%.
QYLG therefore leaves more of its portfolio completely uncapped.
QQQI gives the Nasdaq-100 some room to appreciate before reaching the option strikes, but nearly all of the portfolio is subject to those strikes.
The choice between QYLG and QQQI depends on what an investor values more.
⚡ High Yield Portfolio
Last year, we began the process of building out our real money High Yield Portfolio.
So far, the performance has been very strong.
We currently own one option income ETF in the portfolio, that I think is far better than all of the funds mentioned above.
It has a double digit yield, positive NAV growth, and even grows distributions over time!
If you want to be a part of the process of building these portfolios and also get access to everything mentioned below, you can join here:
Here’s everything you’ll get as a paid Dividendology member 👇
📊 Full Access to the Dividendology Database
Built with over $10,000 invested in tools and research, this powerful database tracks dividend stocks and alternative income assets like Covered Call ETFs, REITs, and BDCs.📈 The Dividend Growth Portfolio
A real-money portfolio built from scratch, focused on long-term wealth creation and building a rapidly growing stream of dividend income💸 The High Yield Portfolio
A real-money portfolio, designed to generate massive sustainable income with an average yield of 8%+📉 Running List of Undervalued Dividend Stocks
Updated regularly — stay ahead with a curated list of the most attractively valued dividend opportunities in the market🧠 In-Depth Research & Reports
Deep dives into dividend stocks and income strategies you won’t find on mainstream platforms
Check out these resources:
Tickerdata 🚀 (My automated spreadsheets and instant stock data for Google Sheets!)
Interactive Brokers 💰 (My favorite place to buy and sell stocks all around the world!)
The attractive yield is only the starting point; the real opportunity is owning cash flow that can survive a changing rate regime.
https://paretoinvestor.substack.com/p/treasury-collapse-2026-portfolio-defense