
🍽️ 65 Stocks Eating Themselves Alive
Free Spreadsheet Inside & Buybacks Explained 📂

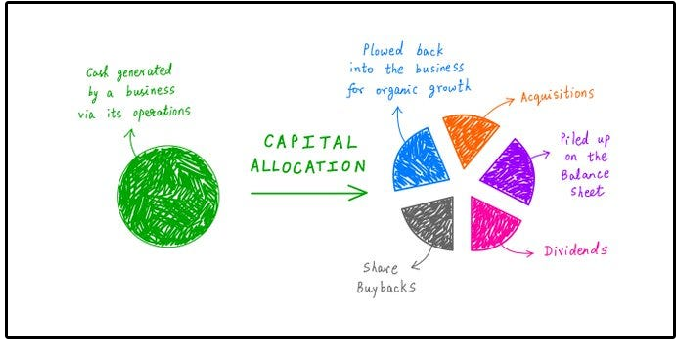
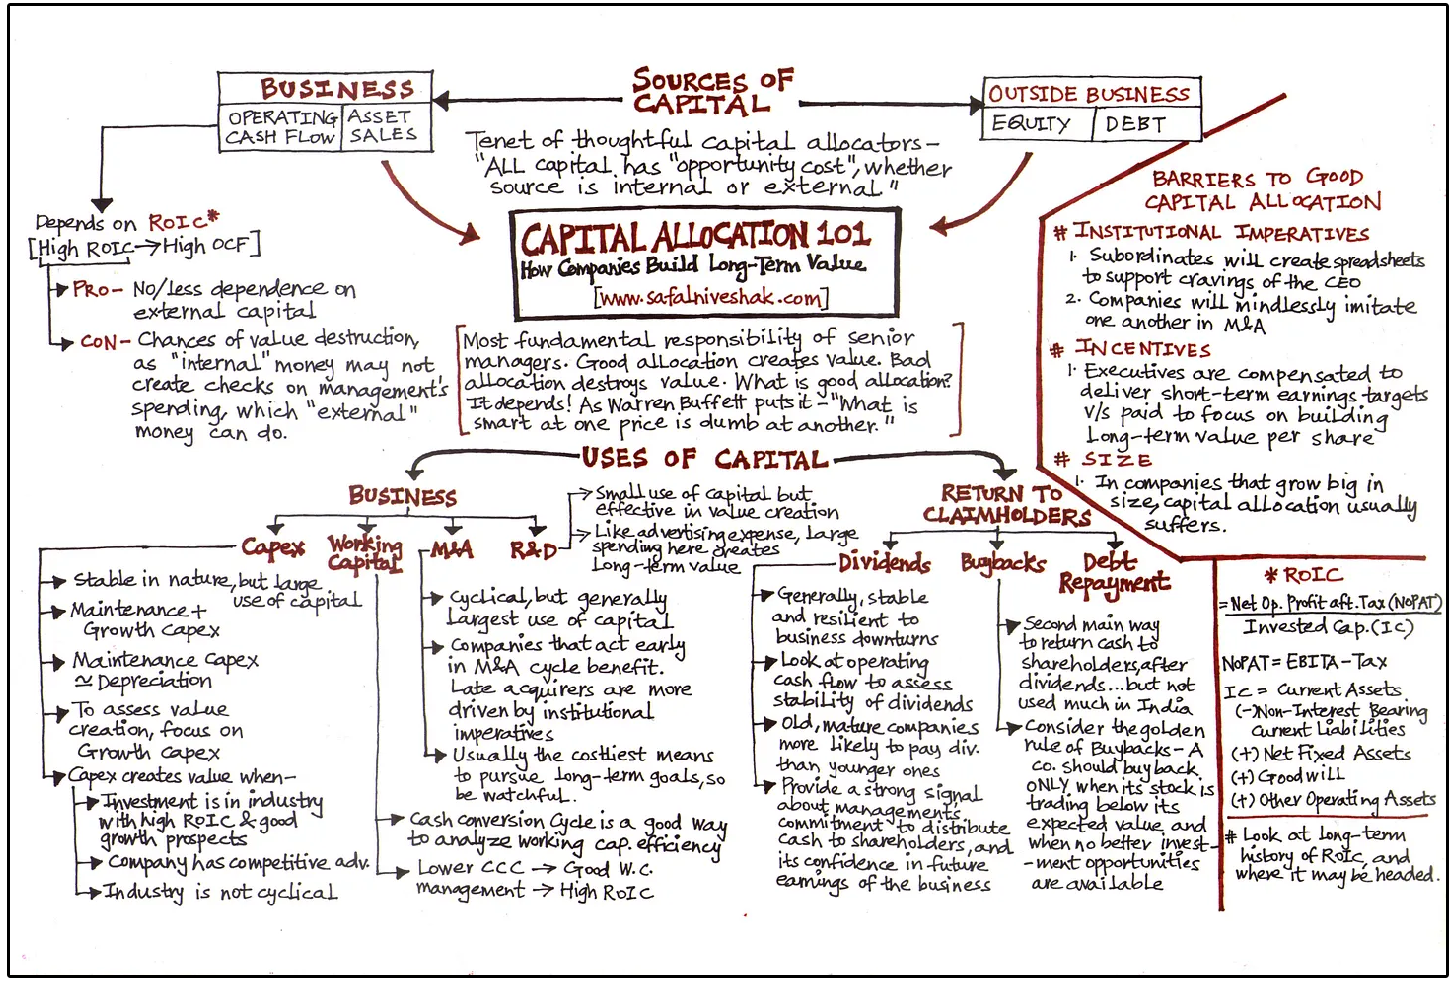
The most important task of any company’s management?
Capital allocation.
Every company has 5 options:
Reinvest back into the business
Pay down debt
Mergers & acquisitions
Buyback shares
Payout dividends
Misallocating capital destroys shareholder value-
But proper capital allocation is the reasons that nearly identical companies can see vastly different outcomes.
Today, we will focus on one of the most misunderstood capital allocation options:
Share buybacks.
📌 Share Buybacks Explained
Imagine a pizza with 10 slices, where each slice represents a share of the company.
If management decides to buy back half of the company’s shares, the total size of the pizza remains the same, but each remaining slice becomes larger.
Before the buyback, your piece of the pizza was smaller.
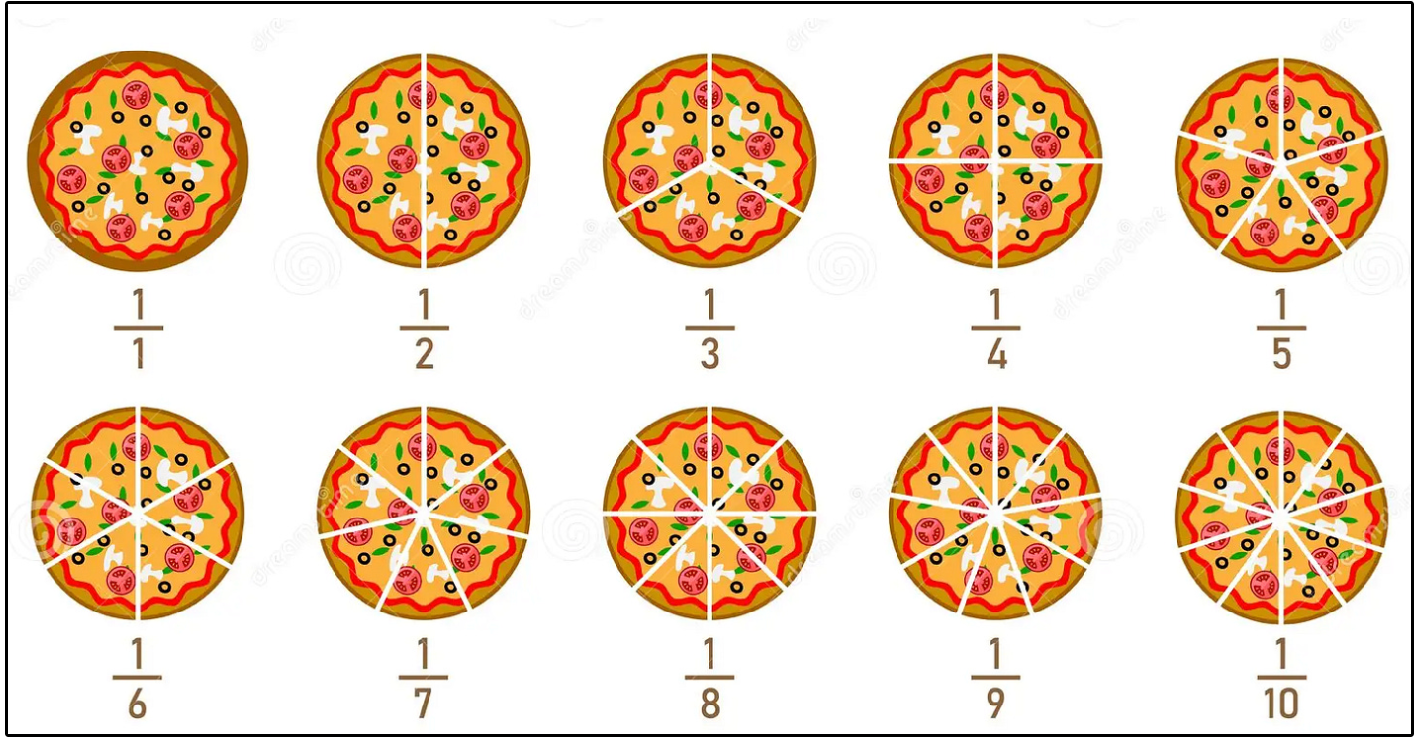
But after, your slice is now twice as big!
🧩 Buybacks & Total Returns
Buying back shares boosts all ‘per-share metrics’.
Revenue per share
Free cash flow per share
Earnings per share
Dividends per share
Do you realize how much this can impact total returns?
If you own a business that earns $10 per share and the company buys back 50% of its outstanding shares, EPS will increase from $10 to $20.
The chart below shows how different levels of buybacks affect returns:
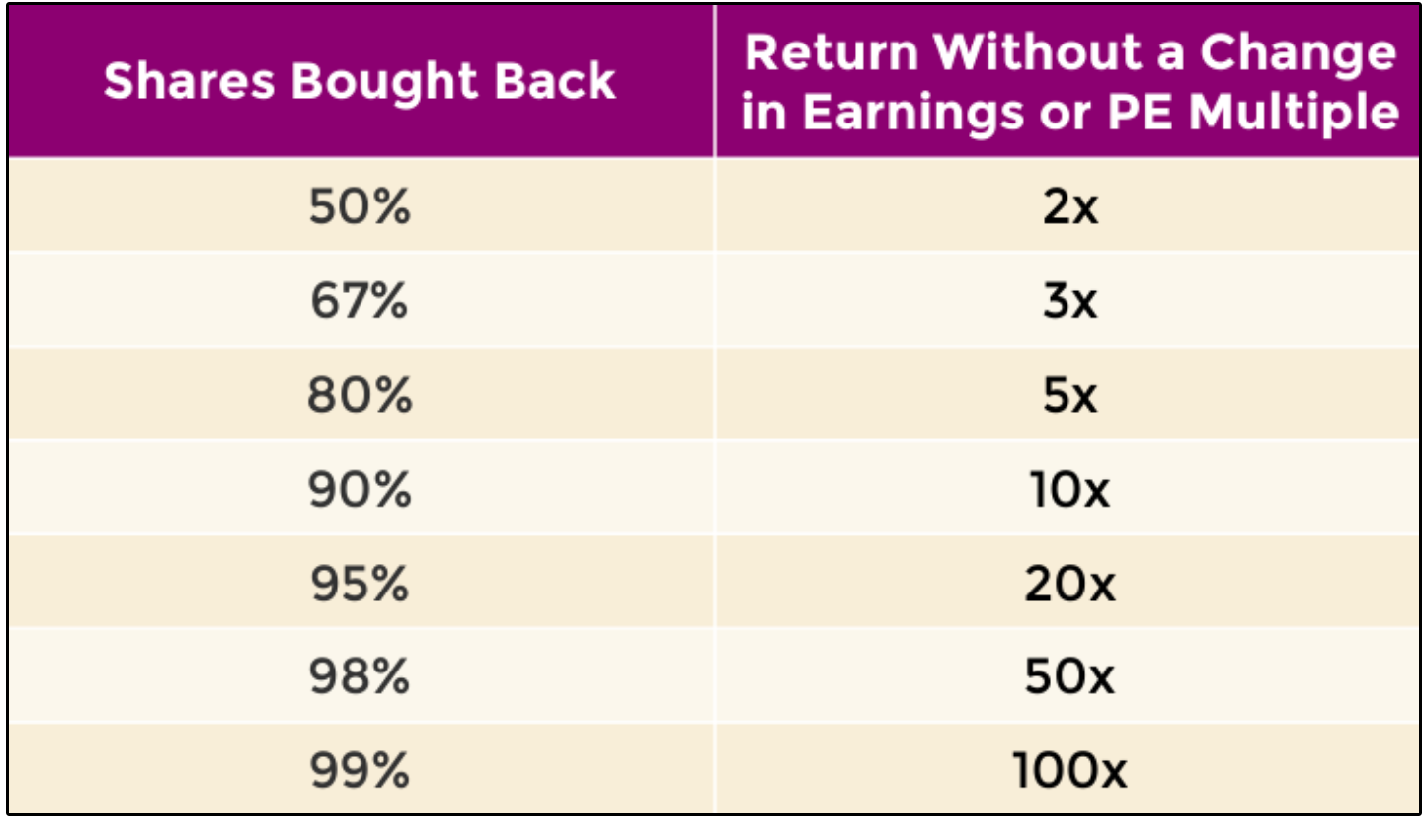
Without a change in the PE multiple, a 50% reduction in shares outstanding causes the stock to double!
🍎 Apple Case Study
Let’s look at Apple stock, for example. (Automated Spreadsheets from Tickerdata)
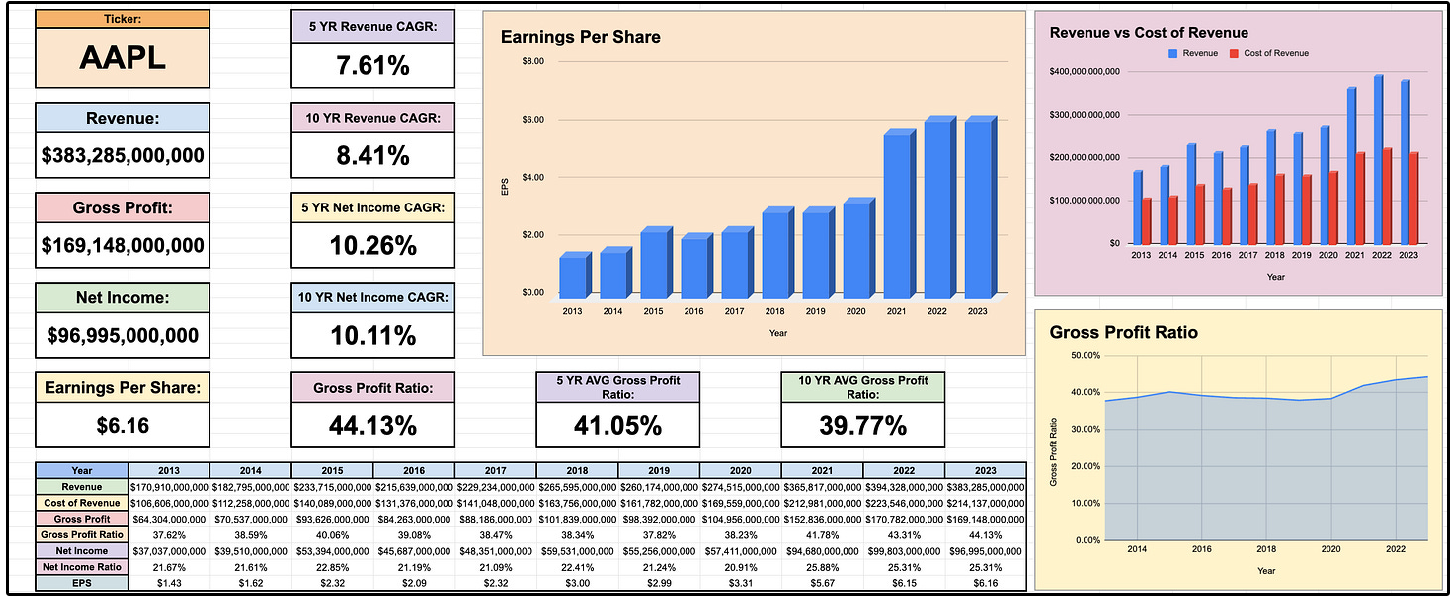
From 2013 to 2023, Apple’s revenue grew from $170.9 billion to $383.2 billion.
That’s 124.26% growth.
But here’s what’s really crazy…
From 2013 to 2023, Apple’s revenue per share grew from $6.60 to $24.34.
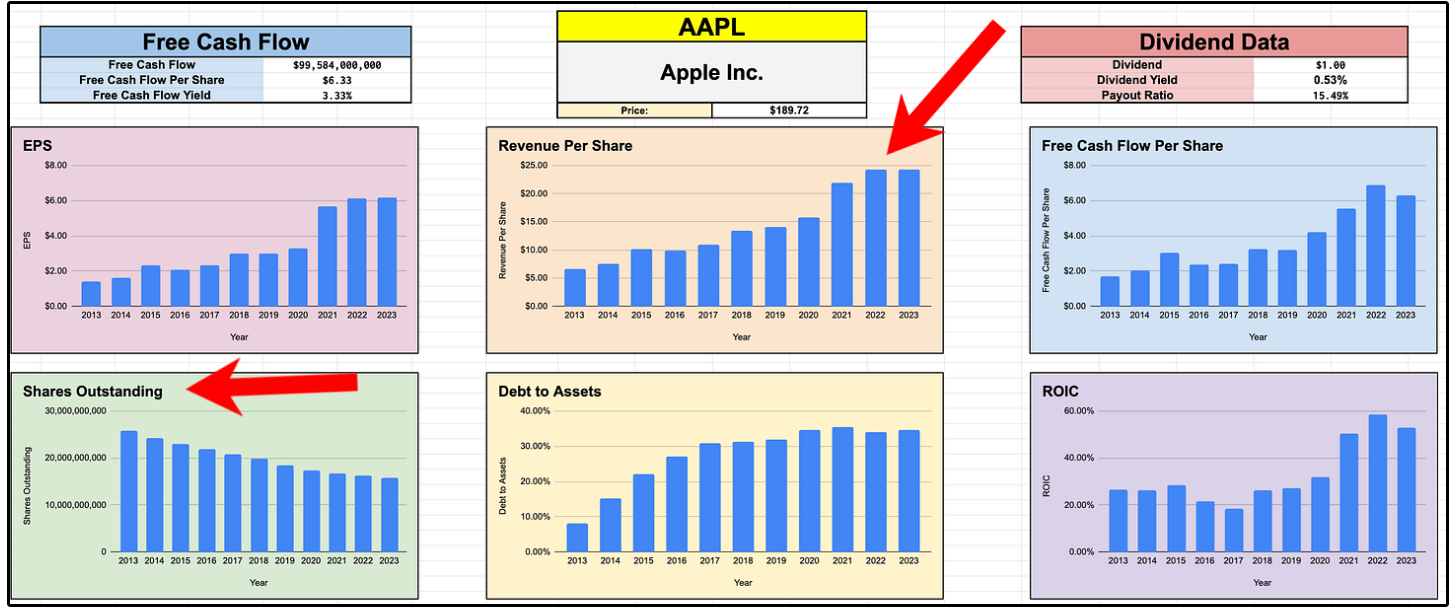
That’s 269.05% growth.
That’s 124.26% revenue growth vs 269.05% revenue per share growth.
The reason their per share revenue growth was so much more?
Share buybacks.
From 2013 to 2023, Apple’s shares outstanding went from 25.9 billion to 15.7 billion.
⚠️ Be Careful…
Buying back shares can mask underlying problems with the company.
In 2023, Apple saw a slight decrease in revenue compared to 2022, going from $394.3 billion to $383.2 billion.
Yet on a per share basis, revenue went from $24.32 to $24.34.
A slight increase.
So even though organic revenue slightly decreased, it still increased on a per share basis, due to the share buybacks the company performed.
Assuming the buybacks were done at the right valuation (we will touch on this next), the buybacks did help Apple…
But they also masked the fact that organic revenue was actually declining.
🏗️ The Irony of Share Buybacks
Did you know share buybacks only create value for a company when they are done at an undervaluation?
From 2013 to 2023, Dollar General went from 322M shares outstanding, to 219M shares outstanding.
During this time, Dollar General saw market beating returns.
But here’s where things get interesting.
Buybacks only create value for a company when its intrinsic value is higher than their current price.
For the majority of the past decade, Dollar General was buying back shares when the company had a P/E ratio ranging from 17 to 26.
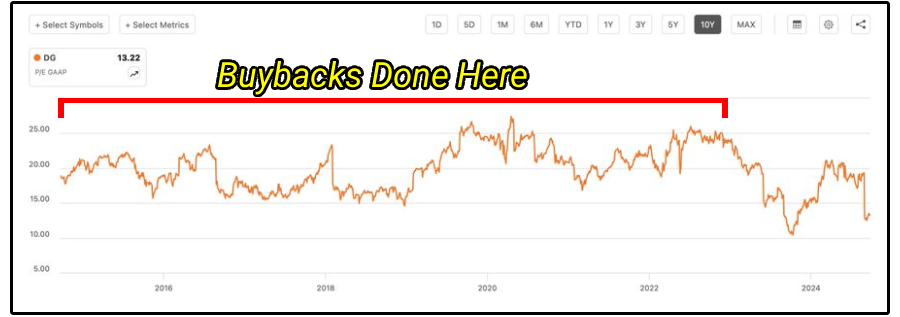
This is a good thing, as long as the company’s intrinsic value was higher than the price they bought shares back at.
But here’s where things get really interesting.
The share price for Dollar General dropped dramatically in 2024.
The company was trading close to its lowest P/E multiple in over a decade, at a 14.5 forward-looking P/E ratio.
But guess what the company announced in their earnings report during this time?
They stated they would not be buying any shares for the rest of fiscal 2024.

The irony of share buybacks is that companies often don’t execute them when their stock is cheap-
Usually because the business is under financial pressure at exactly the time buybacks would create the most value.
This issue isn’t limited to Dollar General.
In fact, it’s actually quite common.
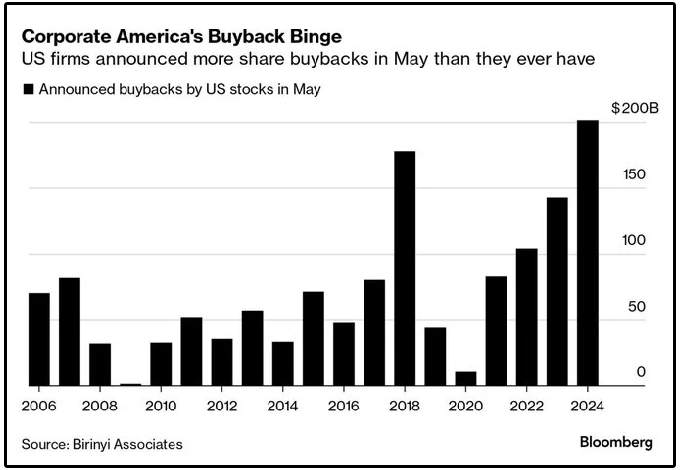
Most companies ramp up share buybacks when the market is soaring and sentiment is high-
Then reduce them when prices are at 52-week lows.
This is why all buybacks must be looked at on a case by case basis.
Oftentimes, the best use of capital when the share price is considerably lower than the company’s intrinsic value is buying back shares.
⚖️ Buybacks vs Dividends
Are you ready to find out which is better, dividends or share buybacks?
Here’s the answer:
It depends.
Buybacks should be executed strategically and at undervaluations, which many companies fail to do.
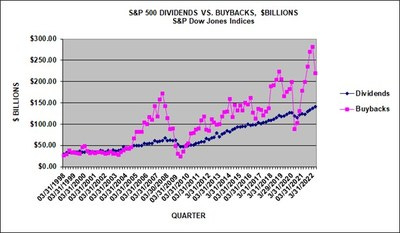
And what do you notice about the chart below?
Dividends from S&P 500 stocks are far more stable and predictable, unlike buybacks.
This is great news for investors aiming to one day live off dividends.
The best capital allocators often end up using a mix of both.
People spend decades mastering and studying capital allocation, but this visual will help you grasp the basics instantly.
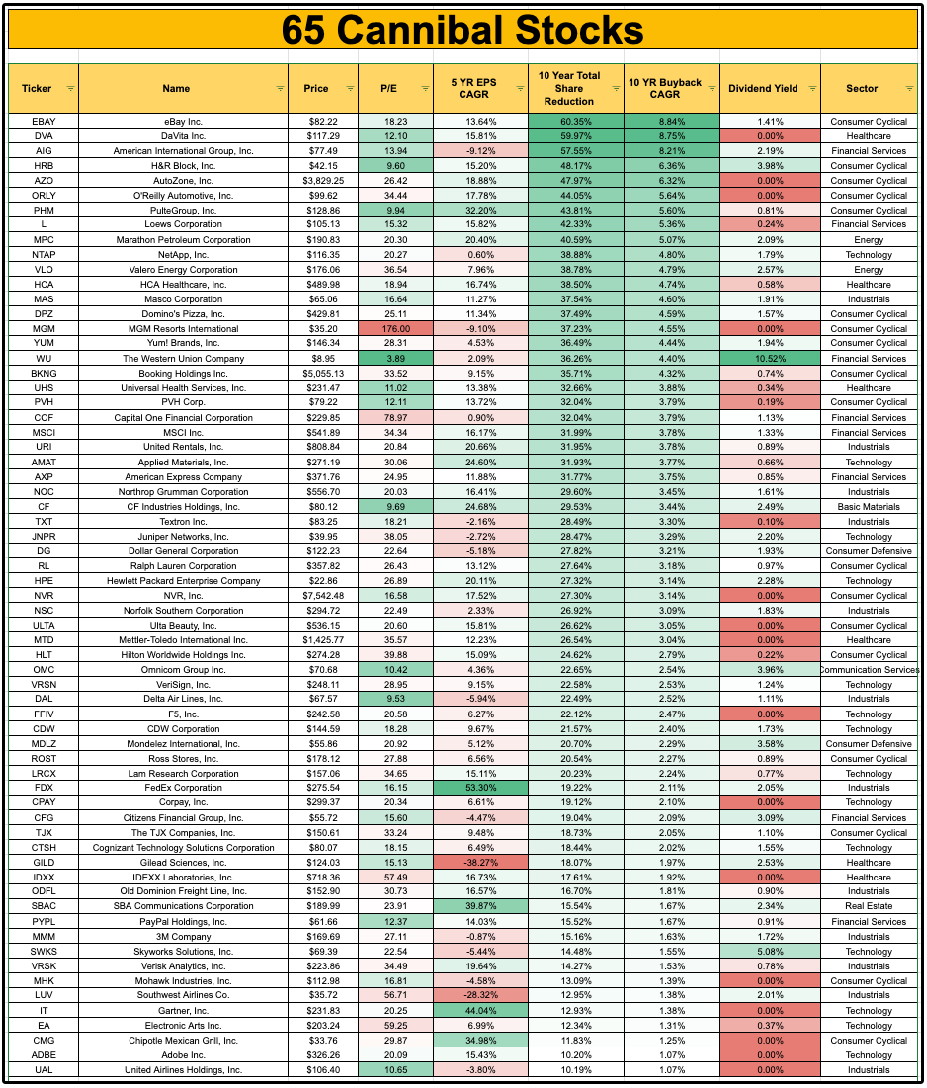
🍽️ 65 Cannibal Stocks
I created a list of 65 Cannibal stocks-
Stocks that have bought back more than 10% of their outstanding shares in the last decade.
You can download it here:
You can also see the full list here:
I’ll be adding this spreadsheet to the Dividendology Database on Dividendology.com quite soon.
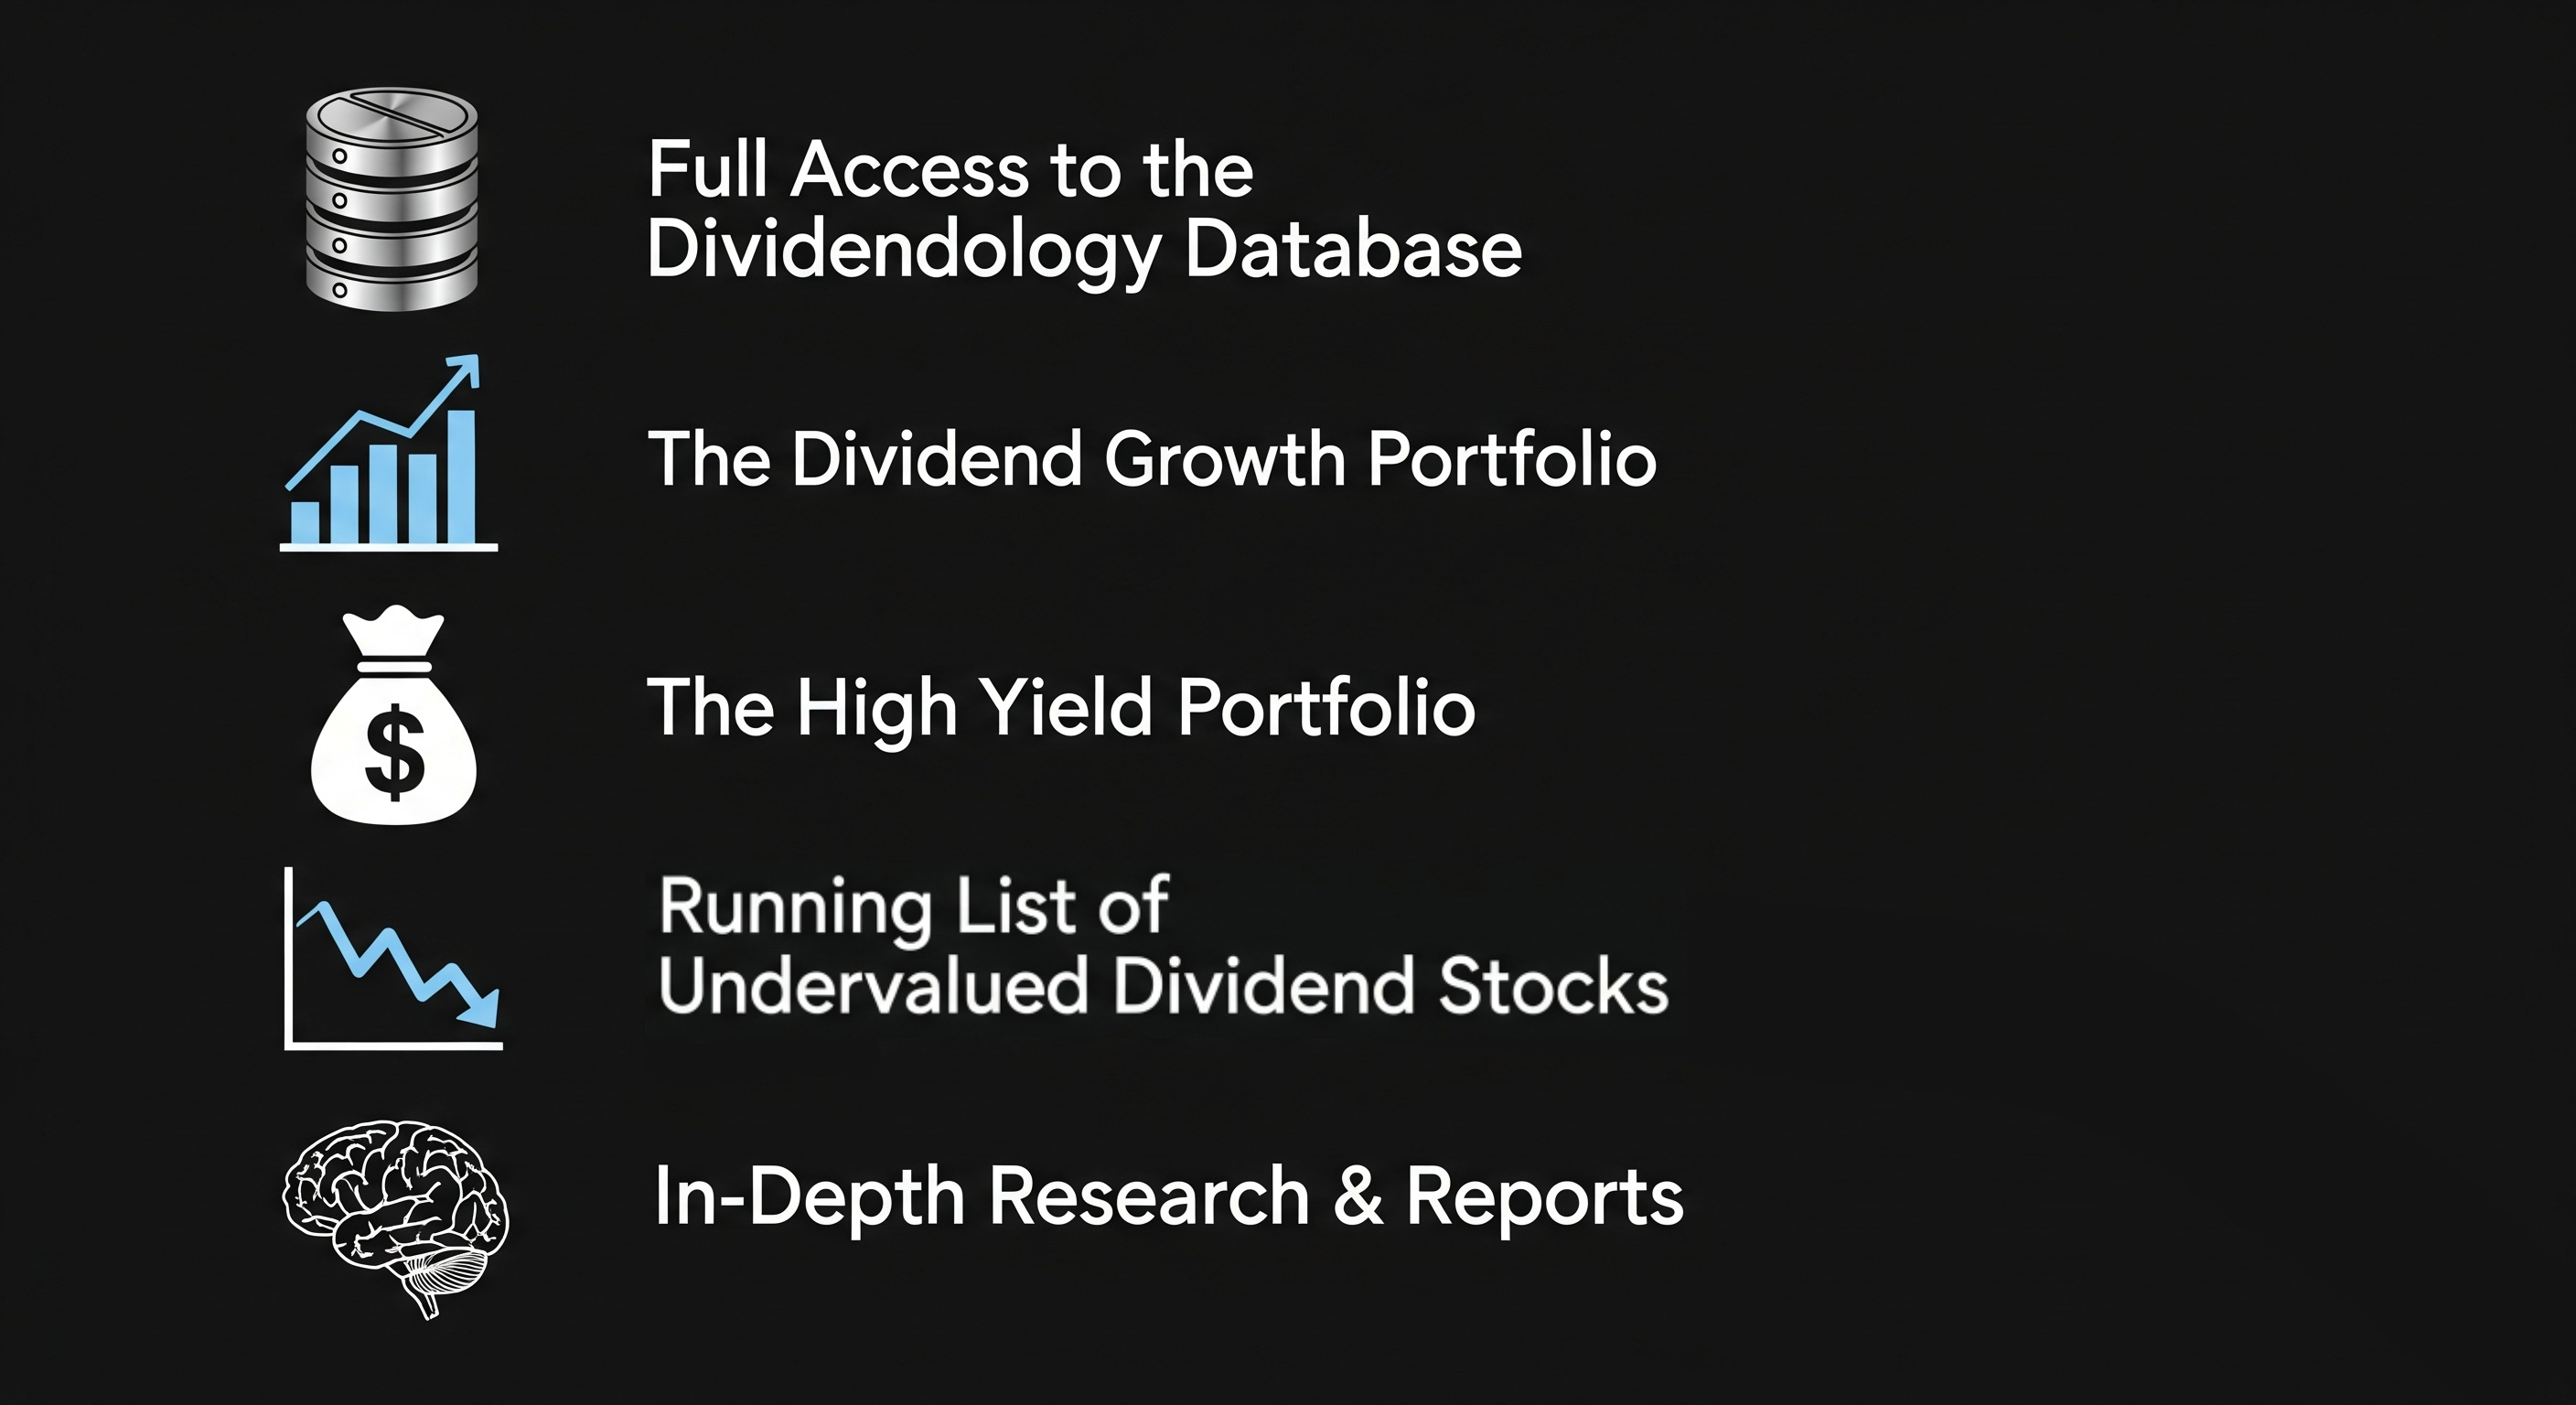
As a reminder, you can get access to all of the following by becoming a member of Dividendology.
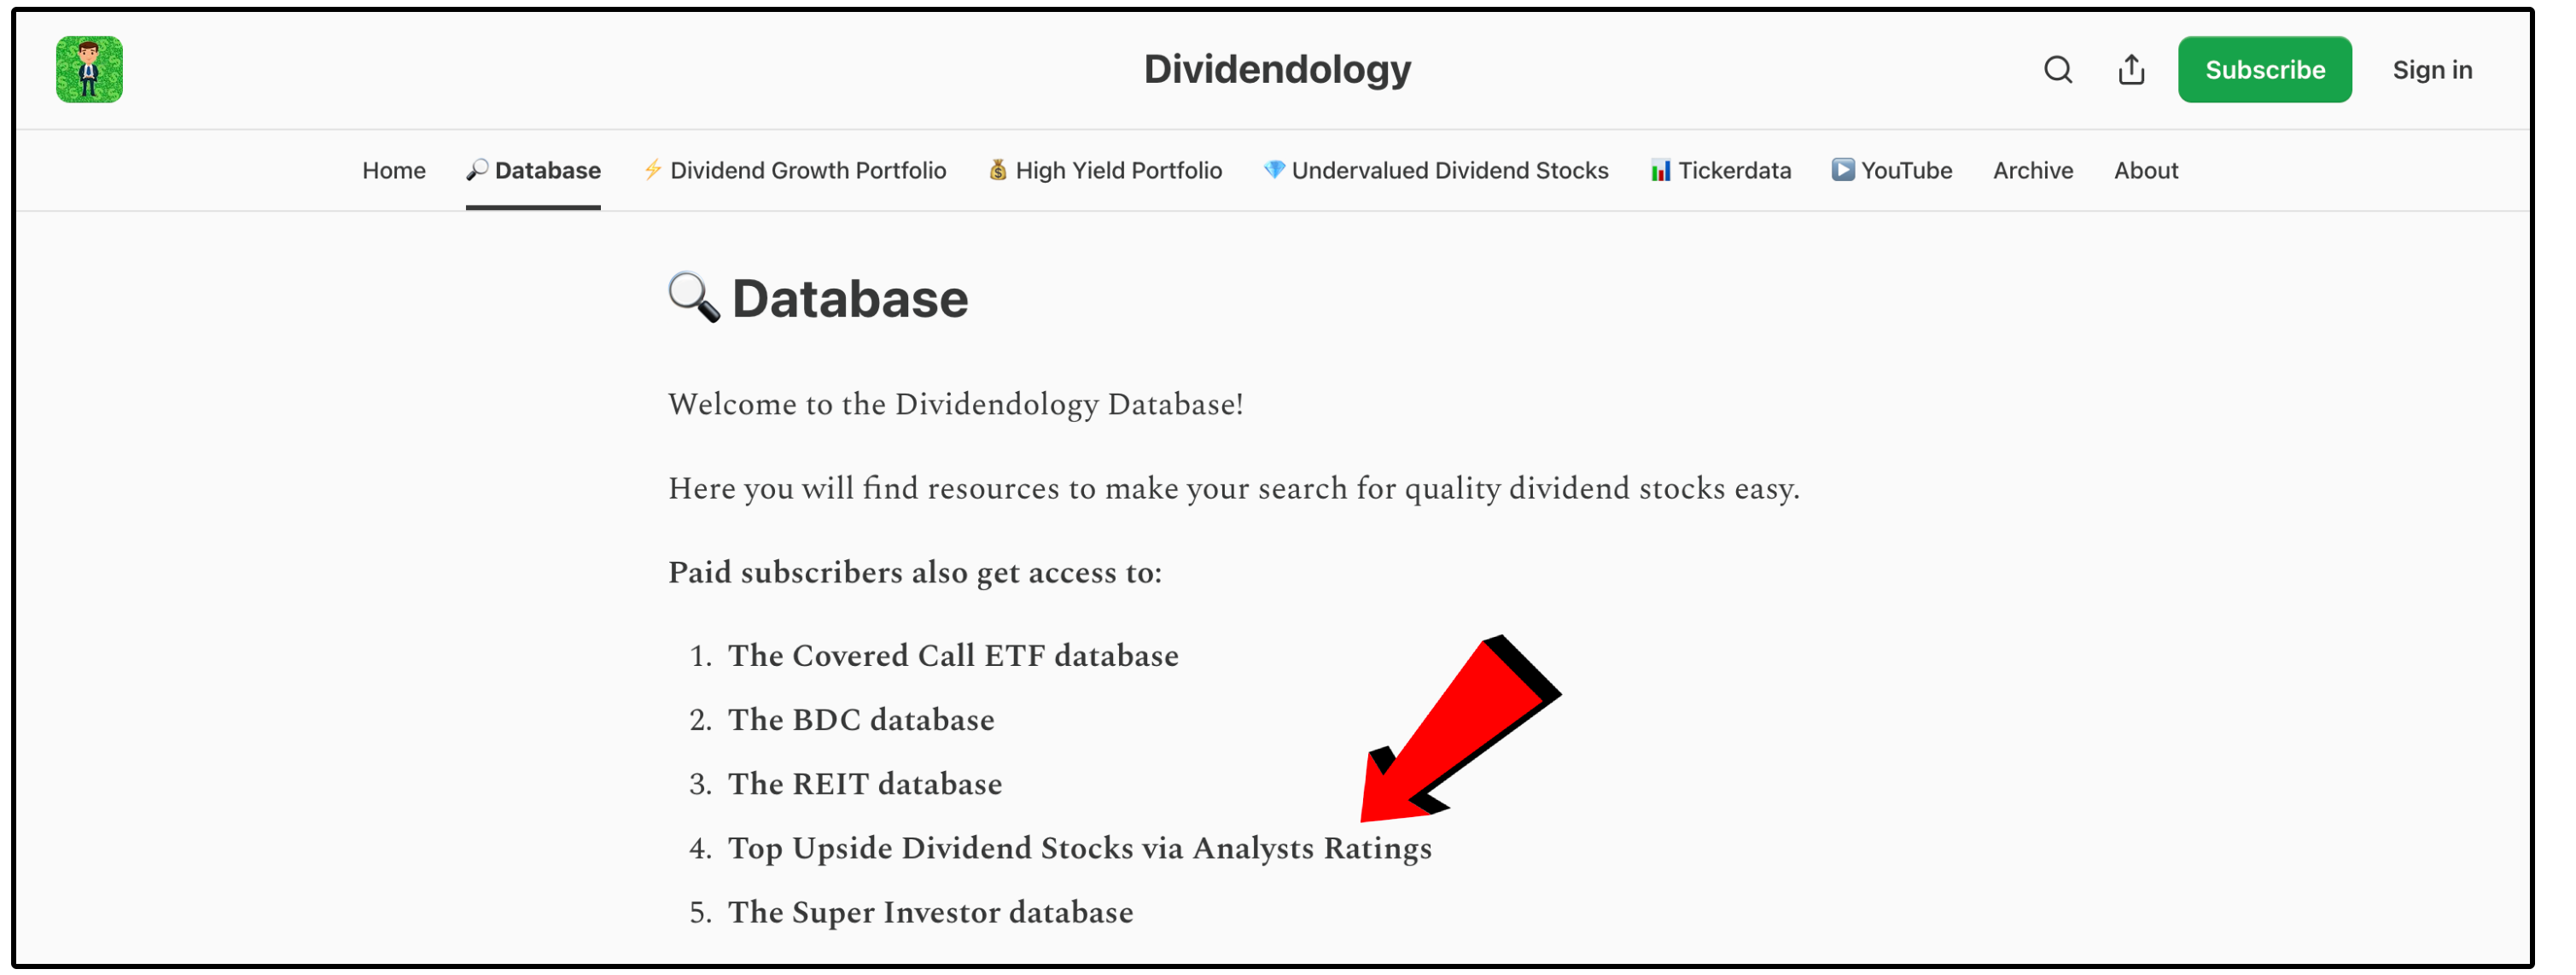
We also added a new feature to the Dividendology Database last week as well!
Every month, I compile a data on Wall Street price targets and compile it to bring you the ‘Most Upside Dividend Stocks via Analyst Ratings’.
Dividendology is continuing to grow.
The best is yet to come!
Check out these resources:
Tickerdata 🚀 (Code: ‘BLACK’ for 30% off the Black Friday Sale!)
Interactive Brokers 💰 (My favorite place to buy and sell stocks all around the world!)
Seeking Alpha 🔥 (Now currently running their Black Friday sale!
The Dividend Report 📊 (Free Newsletter for Straightforward Dividend Stock News)
I am a subscriber and am not sure how to reach out to ask a question. Many stocks are listed as undervalued or good buys. However, one stock is listed in the Dividend Growers Portfolio. When do one of these goody buys graduate into the portfolio? Thank you.