
📚A Masterclass on REIT Investing
Take Advantage of The Massive Opportunity! ⏱️

I’ve mentioned this many times in the last few months-
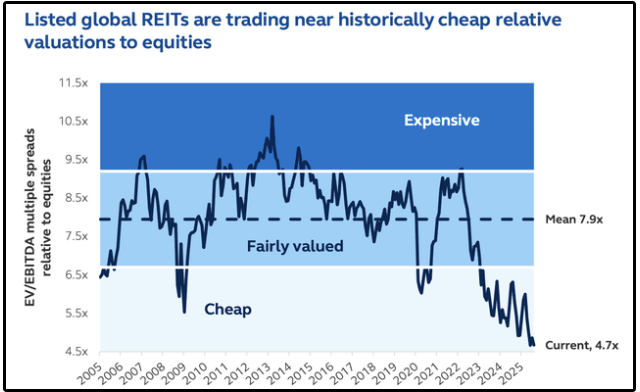
But REITs are currently trading at their lowest valuations in decades.
However, the vast majority of investors are not positioned to take advantage of this historic opportunity.
This is primarily for two reasons:
Misplaced short-term sentiment
Lack of knowledge surrounding REITs
To address this, we will be dismantling the ‘poor sentiment’ surrounding REITs, while also providing a condensed masterclass on REIT investing-
Which of course will equip you to take advantage of the current opportunity in the REIT market.
📉 REIT Sentiment
Sentiment surrounding REITs right now is incredibly low.
Go on to any social media platform of your choice, and you’ll quickly find that investors are writing off REITs as a ‘perpetually underperforming asset class’.
To be fair, it’s easy to see why they would come to this conclusion…
If you only look at their performance over the last three years.
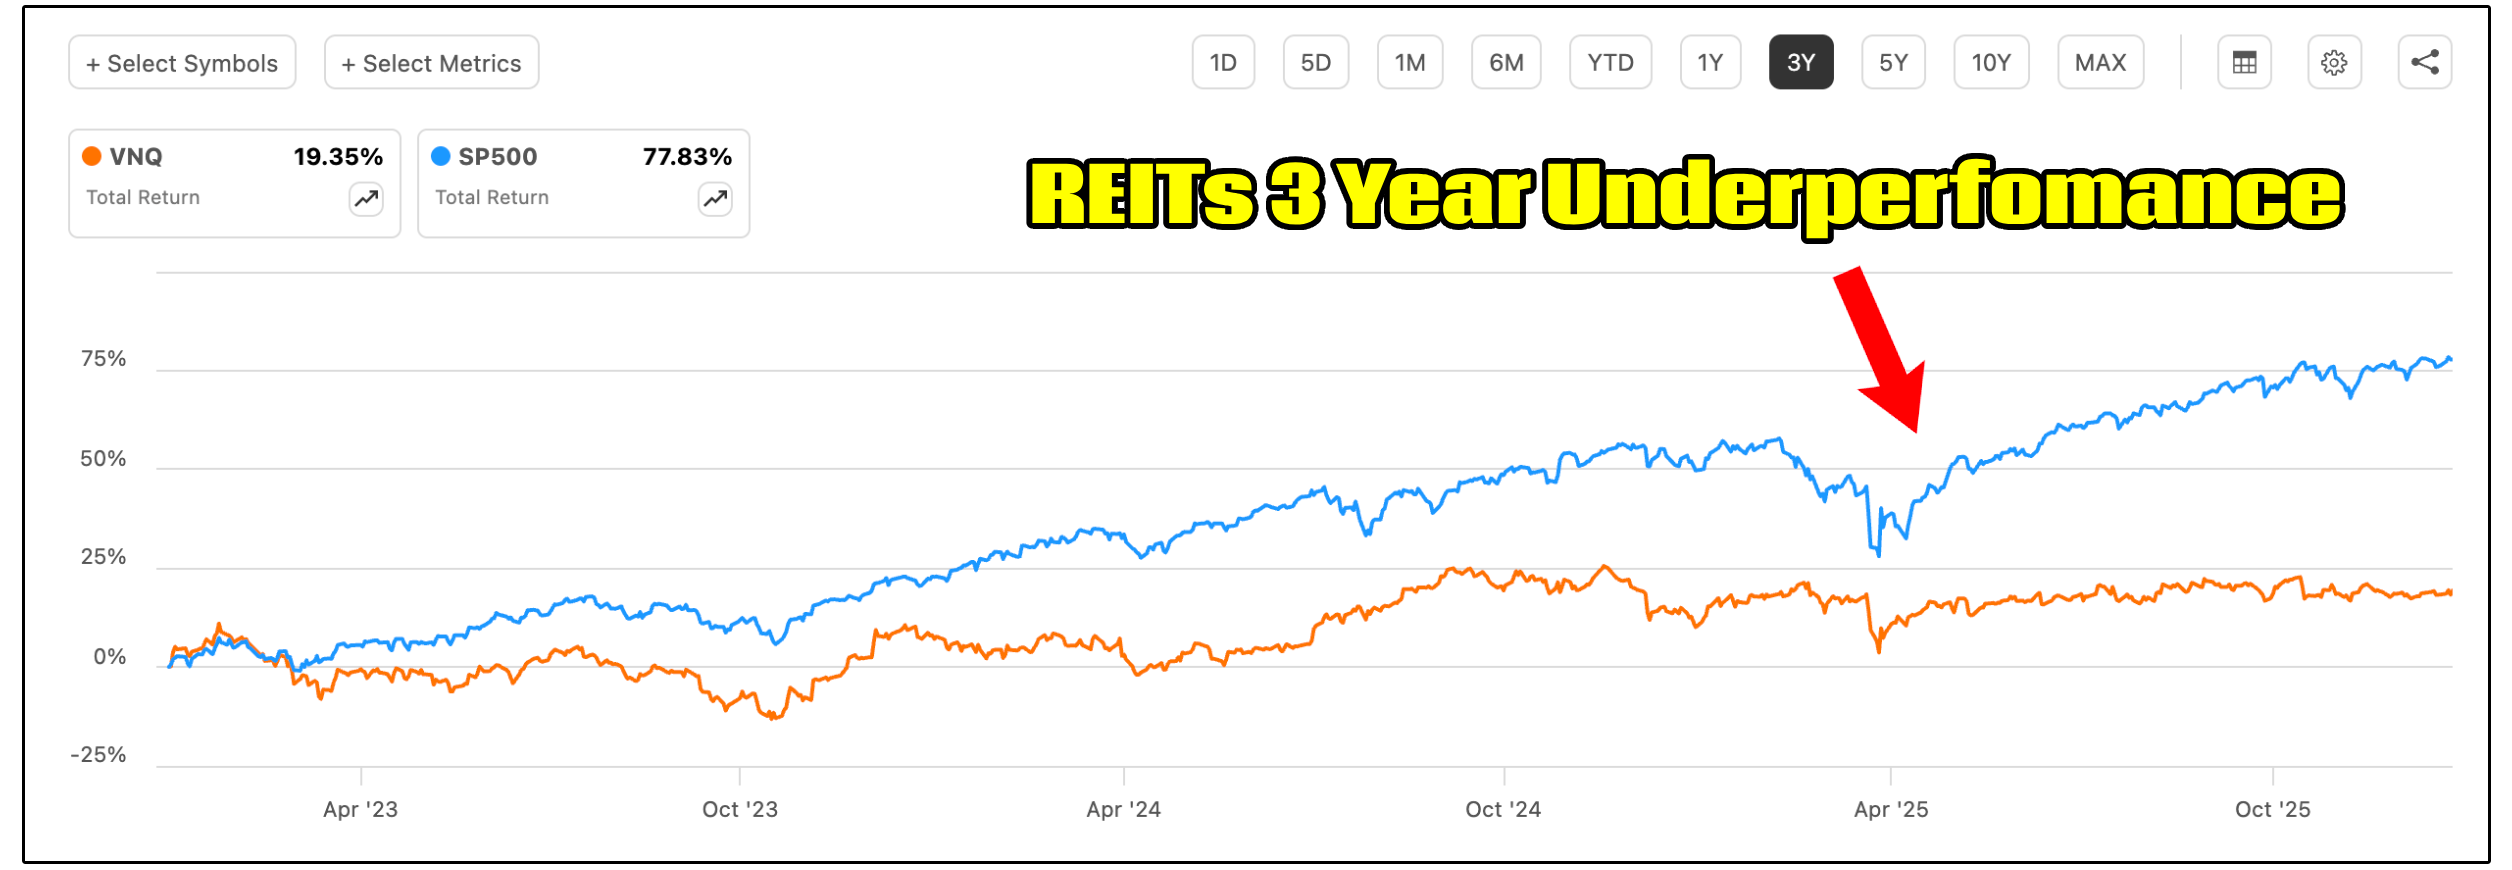
Investors are notoriously short sighted.
And it’s a large reason why they so often underperform the market over prolonged periods of time.
If we look at REITs performance over a 30+ year time horizon, we see dramatically different results.
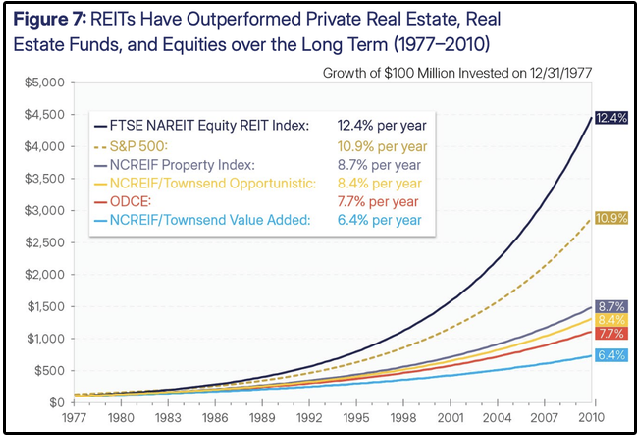
REITs actually returned 12.4% annually, outperforming the S&P 500!
This outperformance can be found during other longer periods of time as well (Ex: 2002 - 2021).
It’s clear that the recent shift in sentiment surrounding REITs is due to recency bias-
Unless earnings (Or AFFO per share in the case of REITs) has dropped.
So… What has happened to REITs earnings during this period of underperformance?
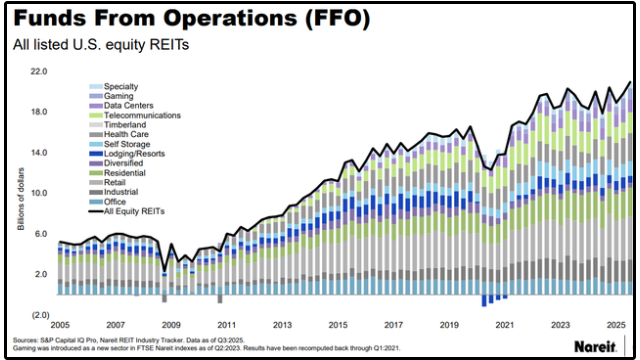
📊 REITs FFO Growth
While funds from operations briefly dipped as a result of COVID, FFO has continued to grow in recent years, continuing the broader trend of growth.
Naturally, anytime a stock continues to grow earnings while the share price declines, it means valuations are becoming more attractive-
Which is exactly how we got to REITs being at their lowest valuation in decades.
However, many still don’t seem to grasp this reality.
For example:
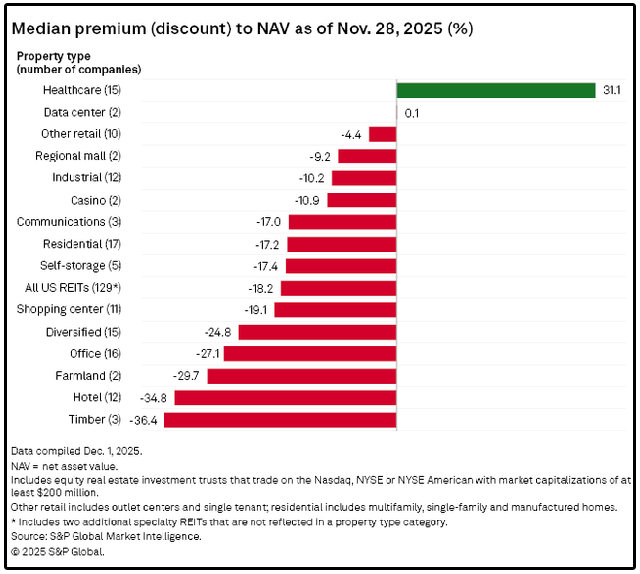
NAV is an estimate of what a REIT’s underlying real estate is worth today.
Right now, nearly every single sector within the REIT market is trading at a severe discount to what their underlying real estate is worth right now.
So we’ve made it clear-
Whether you look at REITs based on their NAV, historical valuations, or valuation relative to equities, they’re trading at attractive valuations generally speaking.
⚠️ The Problem
I will be the first to admit there are plenty of bad REITs out there.
On top of this, most people don’t have a basic understanding of how to analyze REITs and the terms for alternative asset classes.
I recently put out a poll asking my readers if you had a general understanding of how to analyze the alternative income asset classes…👇
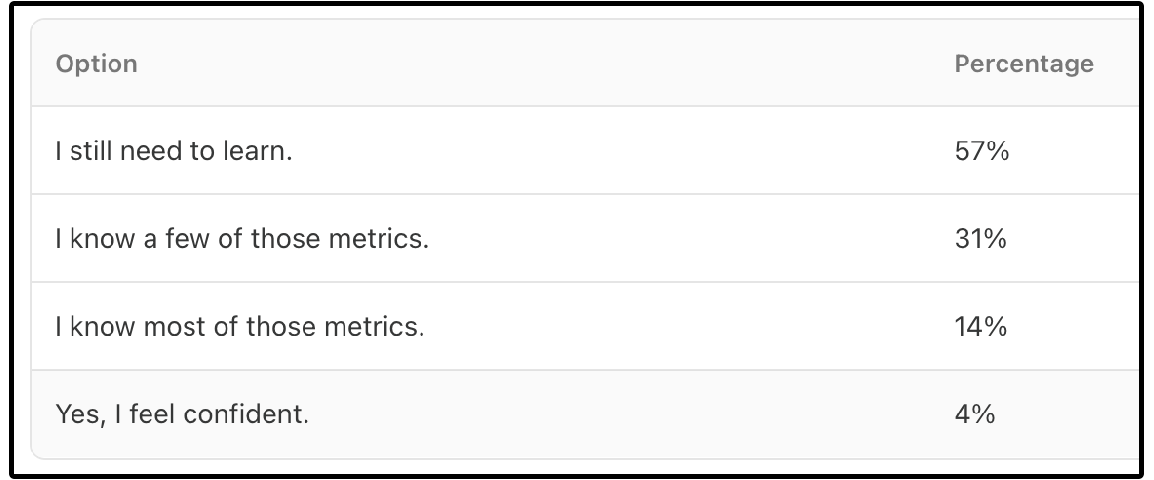
77% of the people who took the survey stated they owned these asset classes-
But only 4% felt confident in how to analyze the key metrics for these asset classes!
I realized what an issue this was early last year, which is why I built the Dividendology Database.

This is where I’ve spent north of $10,000 and spent the last year compiling data on alternative income assets (including REITs) to provide data that isn’t available to retail investors using traditional softwares.
This is available to all members of Dividendology.
So now that we’ve addressed the sentiment issue-
Let’s dive into our REIT Mini Masterclass.
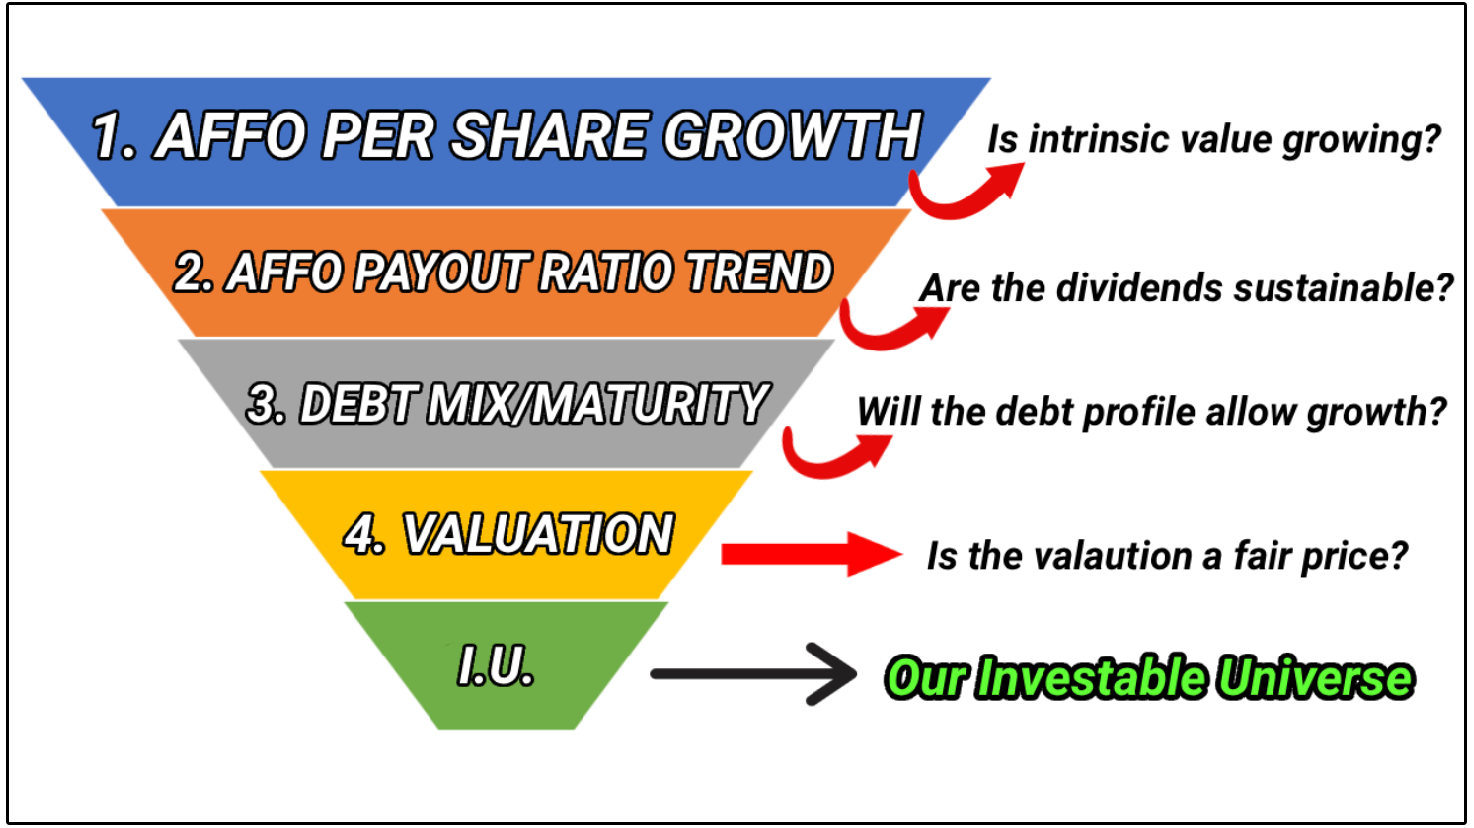
📘 Mini-Masterclass on REITs
If there’s one thing you remember from this entire newsletter, it’s this:
For REITs, AFFO per share is the equivalent of EPS / free cash flow per share.
AFFO = Adjusted Funds From Operations
And it tells you how much cash the REIT truly generates for:
Dividends
Reinvestment
Growth
Why don’t we use EPS?
Mainly because REIT accounting includes heavy depreciation that doesn’t reflect the real economics of property portfolios.
So instead of EPS, we focus on AFFO per share.
It’s incredibly important we note that AFFO MUST grow on a per share basis.
REITs are required to pay out 90% of taxable income as dividends.
So since they don’t retain much capital to grow, they generally must:
issue new shares, or
take on debt
This is why REITs often increase shares outstanding over time.
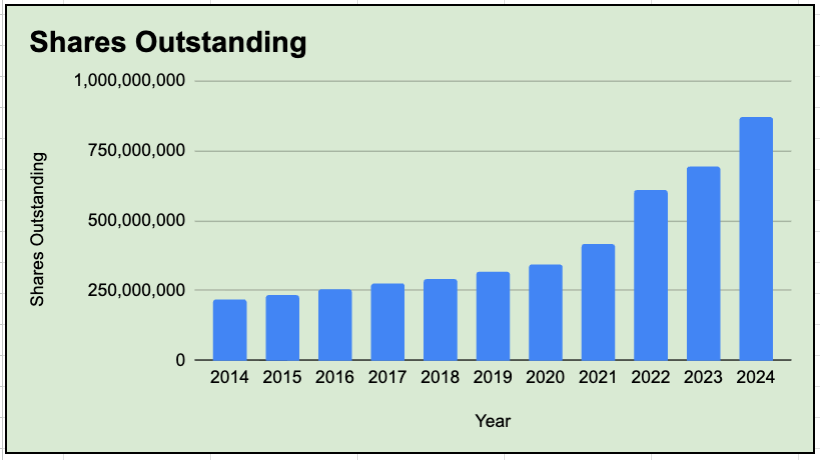
For a normal stock, that’s usually a red flag.
For a REIT, it depends on one thing:
Did issuing shares grow AFFO per share?
If AFFO grows but AFFO per share doesn’t, that’s dilutive growth (bad).
If AFFO per share rises anyway, then management is allocating capital well (good).
💸 Step 2: Dividend Safety
Most people buy REITs for income. So dividend safety matters.
But for REITs, you don’t use:
Earnings payout ratio
Free cash flow payout ratio
Instead, you use the AFFO payout ratio (Dividends / AFFO).
A good rule of thumb is that under ~80% is generally healthier (sector-dependent)
But here’s the key:
The payout ratio trend matters more than the current number.
A REIT’s payout ratio can look “fine” today and still be quietly deteriorating.
One of the easiest ways to avoid dividend disasters is to monitor:
Dividends paid (rising)
AFFO generated (flat or falling)
Payout ratio trend (rising)
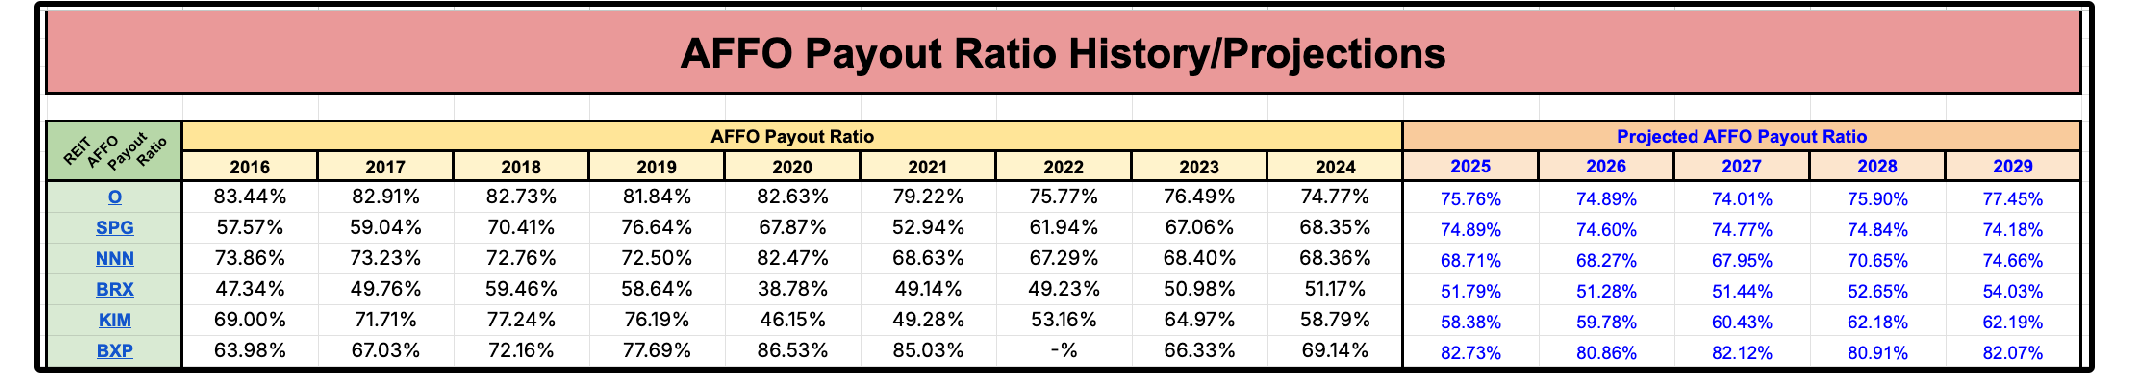
This is why we closely watch AFFO payout ratio trends in the Dividendology Database and also look at future AFFO per share projections, as that tells us what dividend growth rate in the future is sustainable.
Here is small snippet of just a few of the REITs we track this for in the Dividendology Database:
A REIT cannot sustainably grow dividends at a faster rate than AFFO per share over the long term.
But at the same time, a REIT can raise the dividend while the payout ratio decreases-
As long as AFFO per share is rising faster than the dividend payouts.
That’s exactly what long-term dividend investors want.
🔍 Step 3: Balance Sheet & Debt
Debt is part of the REIT model.
But debt is still leverage, and leverage can destroy REITs during refinancing cycles.
Here’s the four primary things you need to know about debt for REITs:
Net Debt / EBITDAre
Fixed charge ratio
Fixed rate vs Variable rate debt
The debt maturity ladder
Let’s review each
1) Net Debt / EBITDAre (leverage)
This essentially answers one question:
“How levered is this REIT?”
Net Debt / EBITDAre tells you how many years of current operating earnings it would take to pay off the REIT’s net debt (debt minus cash), if earnings stayed flat.
So if a REIT is at 6.0x, you can think of it as roughly:
“About 6 years of earnings worth of net debt.”
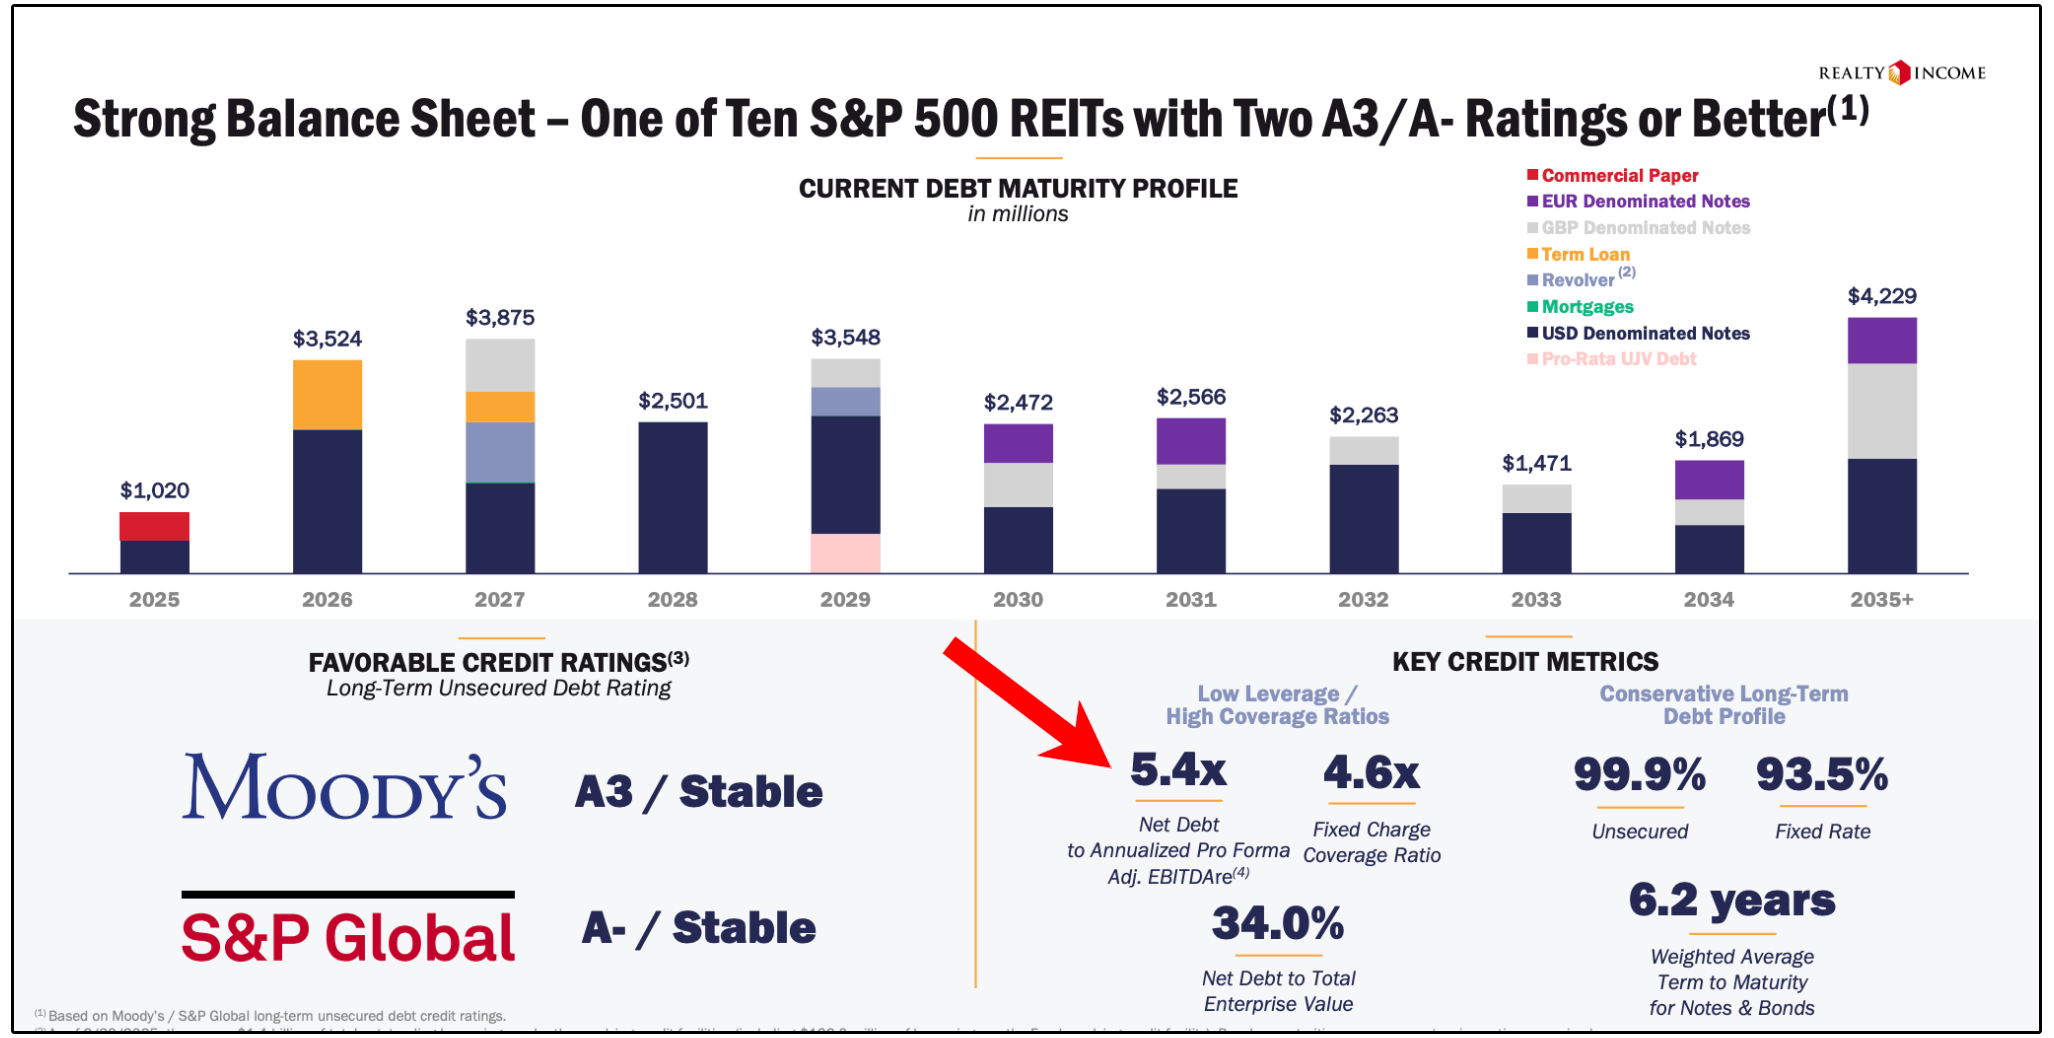
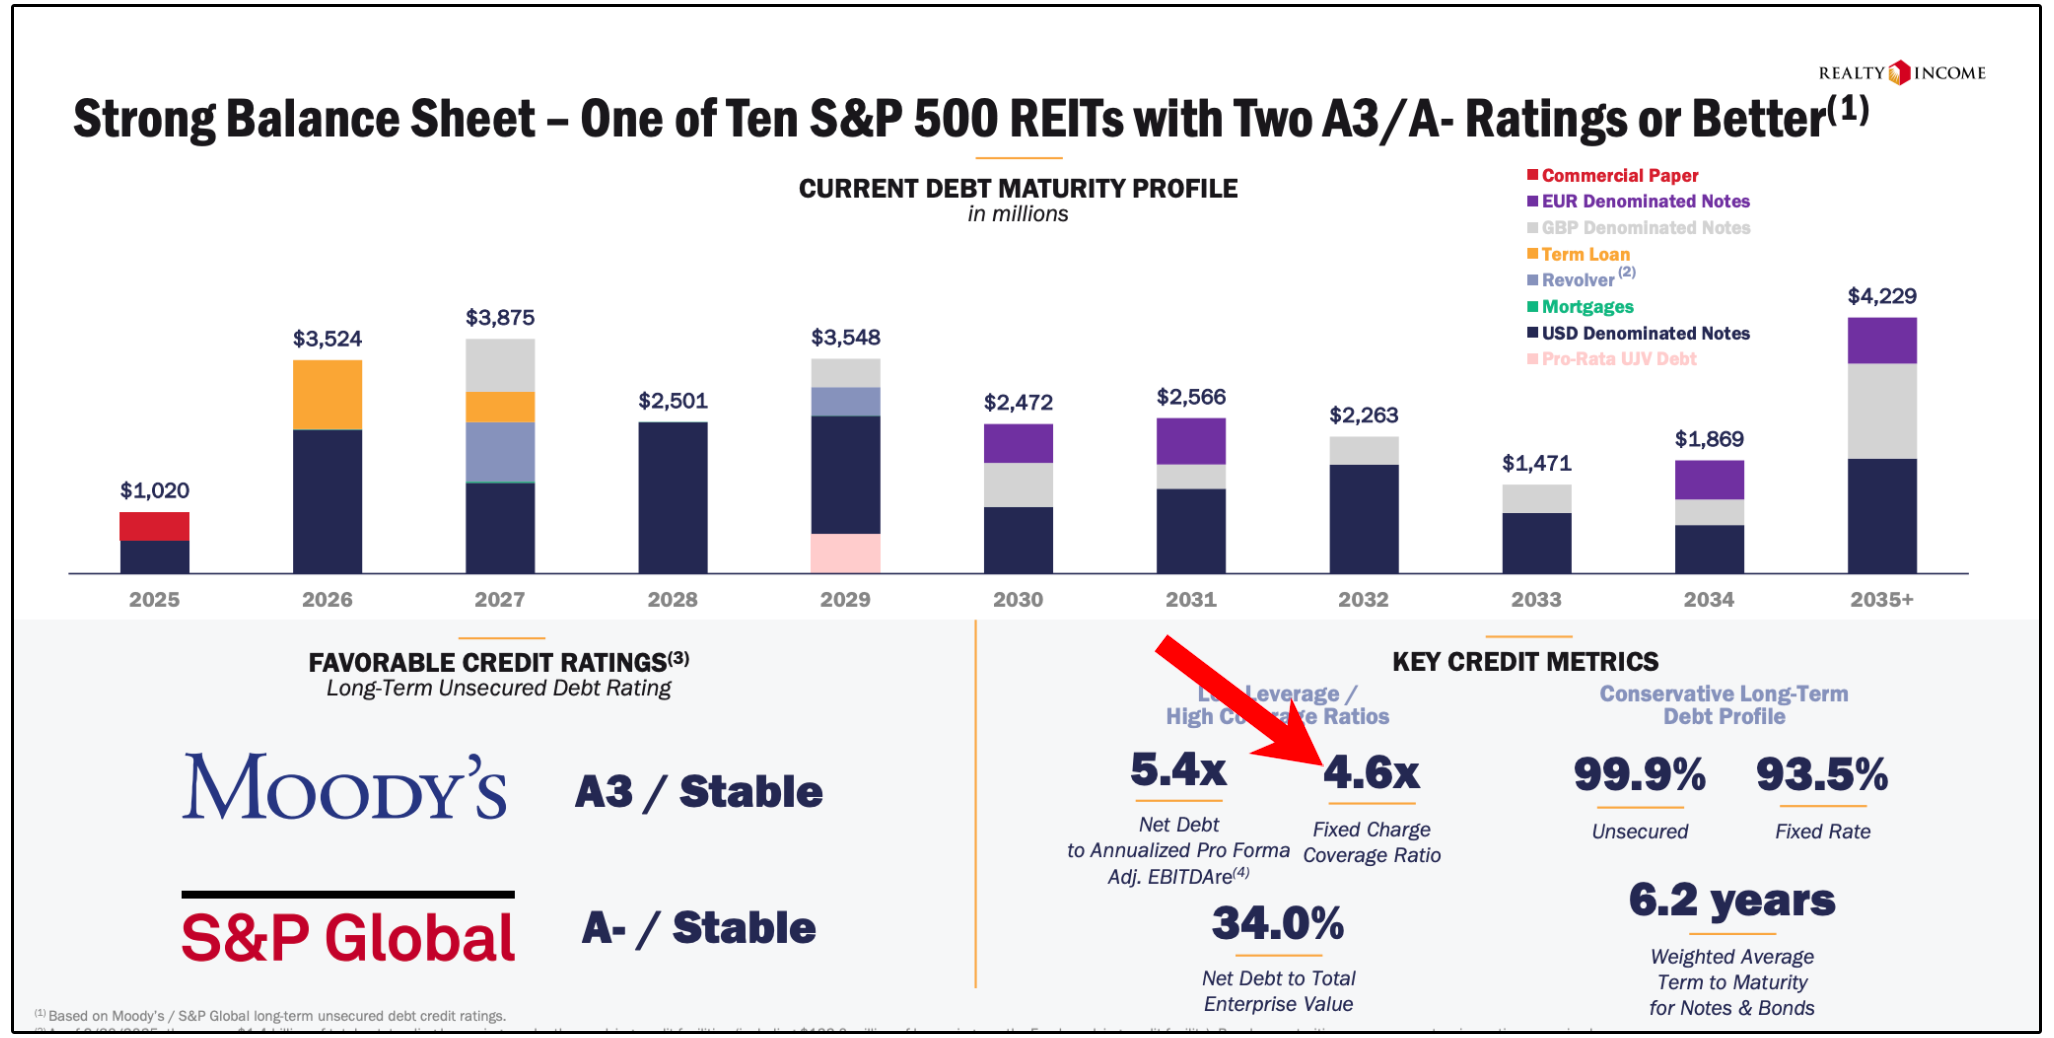
Ideally, we typically want to see this below 6x.
For example, Realty Income’s recent quarterly earnings shows they are sitting at 5.4x.
2) Fixed Charge Ratio
The Fixed Charge Coverage Ratio measures how easily a company (or REIT) can cover its mandatory, non-negotiable expenses with its cash flow.
For REITs, those fixed charges typically include:
Interest expense
Preferred dividends
Sometimes ground lease payments
We typically want to see this at 2.5x or above.
Realty Income is currently sitting at 4.6x, which is quite healthy.
3) Fixed-rate vs variable-rate debt
Variable-rate debt adjusts as interest rates rise, which means a REIT’s interest expense can increase immediately, squeezing cash flow and dividend coverage.
During rate spikes, this is often what causes real stress for REITs.
Fixed-rate debt locks in borrowing costs for years, keeping cash flows predictable.
In most cases, more fixed-rate debt = greater stability and lower downside risk.
4) Debt maturity ladder (avoid maturity walls)
A REIT’s debt maturity ladder shows when its debt comes due.
The goal is a laddered schedule, where maturities are spread out over many years, not where a large amount must be refinanced all at once.
If a large majority of debt matures within the next 12–24 months, the REIT may be forced to refinance during bad markets, high interest rates, or weak property values, even if the business itself is healthy.
We typically want to see weighted average term to maturity ≈ 5+ years.
Here’s Realty Income’s debt ladder.
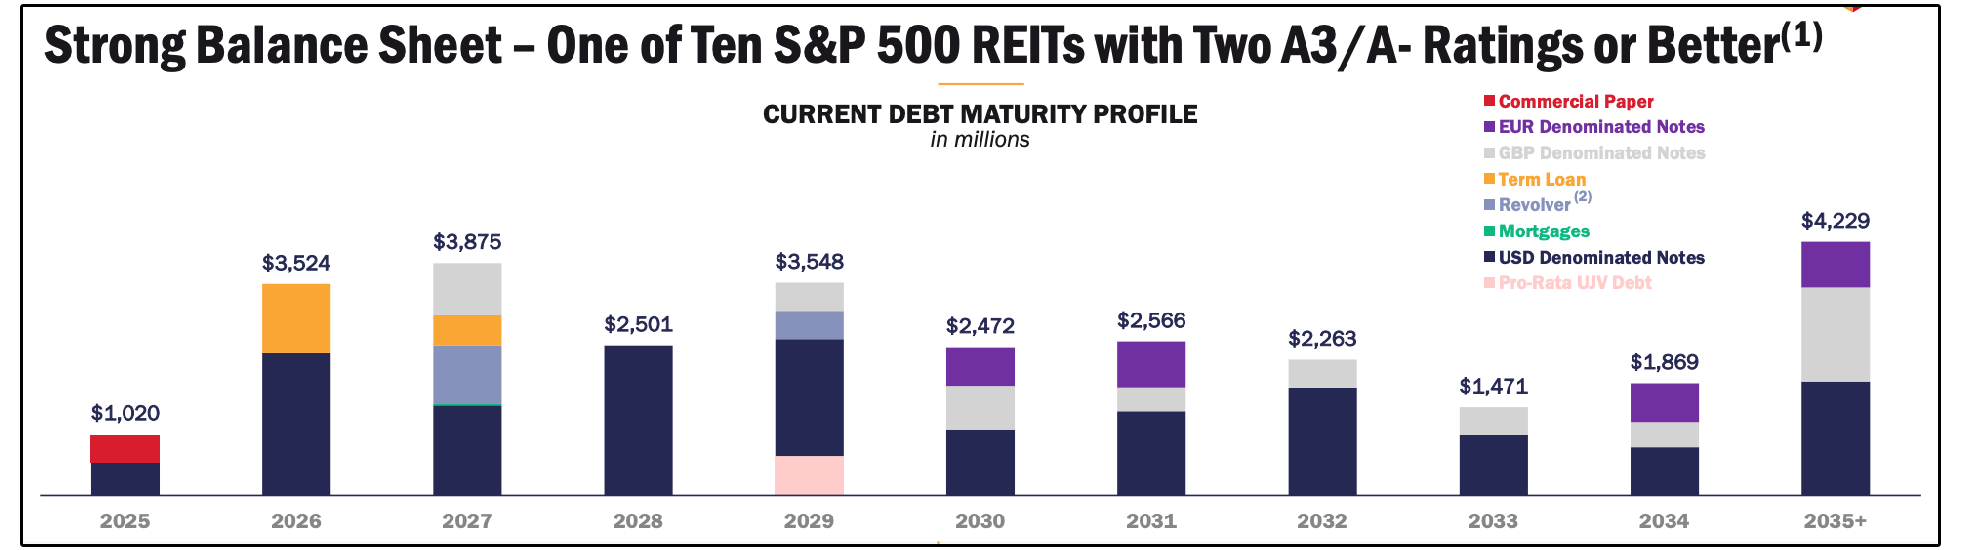
Their weighted average term to maturity is 6.2 years.
🏠 Step 4: Unit Economics & Same-Store Performance
This is where you separate REITs that grow by quality vs REITs that grow by buying stuff.
Because a REIT can “grow” by constantly acquiring properties…
…while the existing portfolio is quietly weakening.
So we focus on organic performance:
Same-store NOI growth.
This is internal growth from properties already owned.
Typical healthy range is around 2% to 4%.
Of course, rising occupancy supports NOI growth.
Ideally, REITs should also have rent escalators to protect the from inflation and grow NOI.
A fixed 2% escalator sounds great, until inflation runs 5%.
Better REITs build in CPI-linked escalators to ‘de-risk’ inflation.
🏢 Step 5: Tenants (Because a REIT is only as good as its tenants)
This sounds obvious, but at the end of the day, a REIT is a portfolio of leases.
So you should always check:
Top tenants
Tenant concentration
Tenant credit quality
Industry exposure (are tenants structurally declining?)
A REIT diversifying its tenants can protect you even if one major tenant struggles.
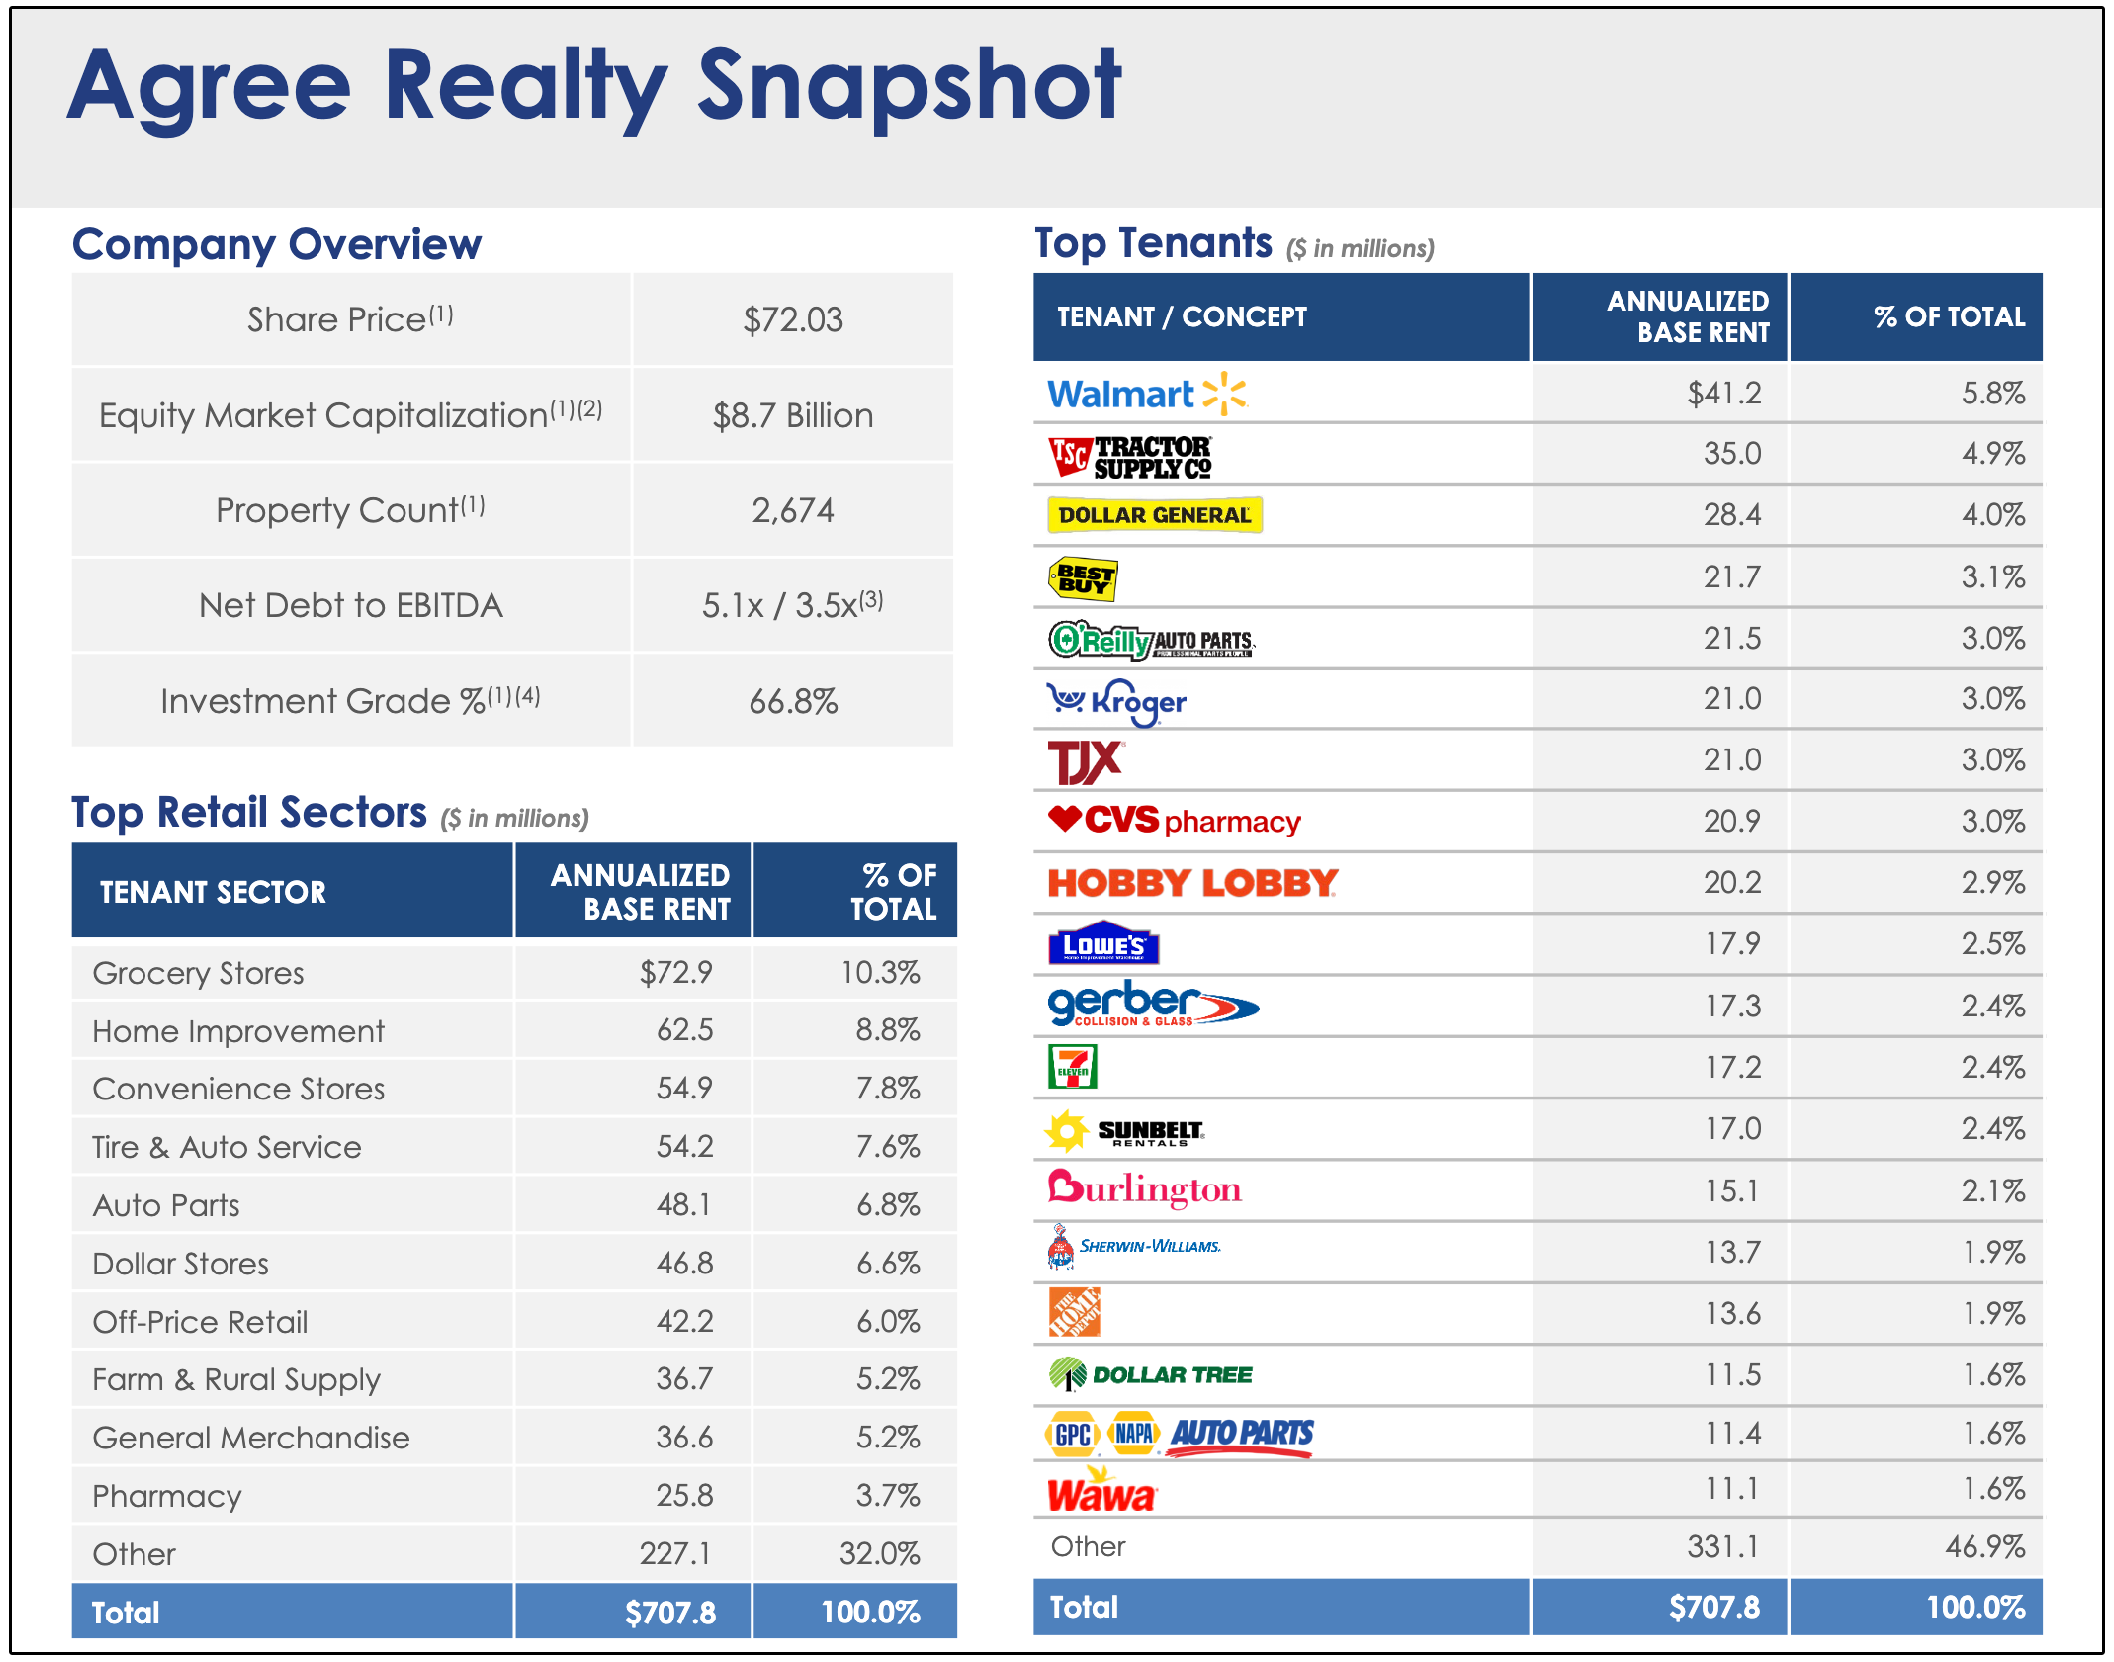
Agree Realty is a great example of this.
👔 Step 6: Management Quality (Capital allocation is everything!!)
Capital allocation is always the top priority of the management of any business.
Management determines:
What they buy
How they finance it
Whether growth is accretive or dilutive
Whether the dividend remains safe
A few general things that are nice to see:
Internal management (often preferred)
Insider ownership / alignment
Compensation tied to AFFO per share (not “asset growth”)
Track record of smart capital allocation
A simple way to measure whether management creates value is by looking at cost of capital vs acquisition cap rates.
If the REIT can borrow/raise capital at ~7% and buy assets at ~8.5%-
Then that spread is accretive and helps drive AFFO per share growth over time.
This is also why falling rates can be a major REIT catalyst:
Cost of capital drops
Deals become more accretive
Valuation often rerates upward
💰 Step 7: Valuation
REIT valuation is an art (like all valuation), but you can make it very systematic.
The easiest way to do this is by looking at REITs through the lens of ‘Sources of Returns’.
Essentially, REIT returns come from 3 buckets:
Dividend yield
AFFO per share growth
Multiple expansion or contraction
For example, look at VICI Properties.
VICI has a yield of 6.5%, so assuming VICI grows AFFO per share at 3.5% moving forward-
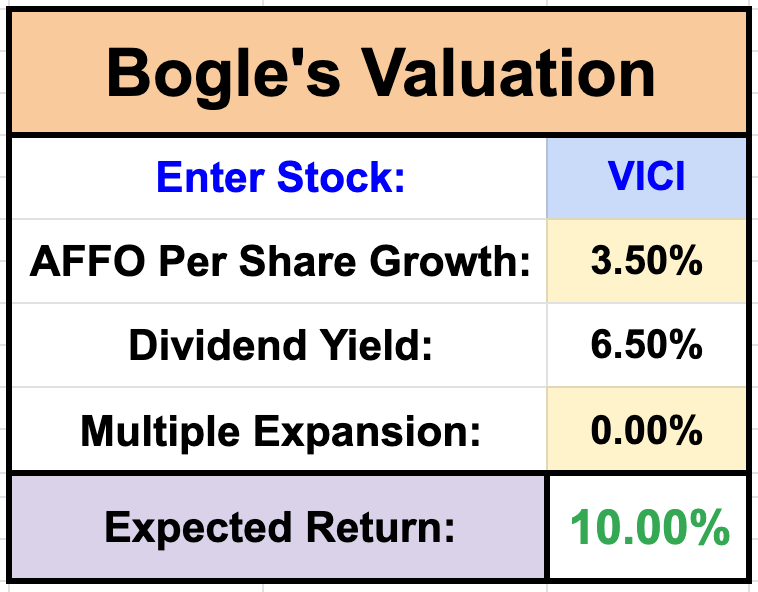
Even without a change in the valuation multiple, you are getting a 10% annualized return!
Imagine how powerful the returns can be when the valuation multiple expands.
If a REIT is growing AFFO per share and paying a strong dividend but the stock is flat…
It’s usually because the market multiple compressed (often from higher rates).
That can create great accumulation opportunities.
Other common valuation models could be:
Price / AFFO comparables
Historical Price / AFFO multiple range
Dividend Discount Model
🌍 You Made It This Far…
If you made it this far, congrats!
Perhaps you are prepared to take advantage of the REIT market now.
But I have a secret for you.
You can rapidly decrease the amount of time it takes to identify REIT opportunities by creating a REIT Investable Universe.
You can find out how to do that quickly here:
If you want to get access to the Dividendology Database and all the features mentioned below, you can do so here:
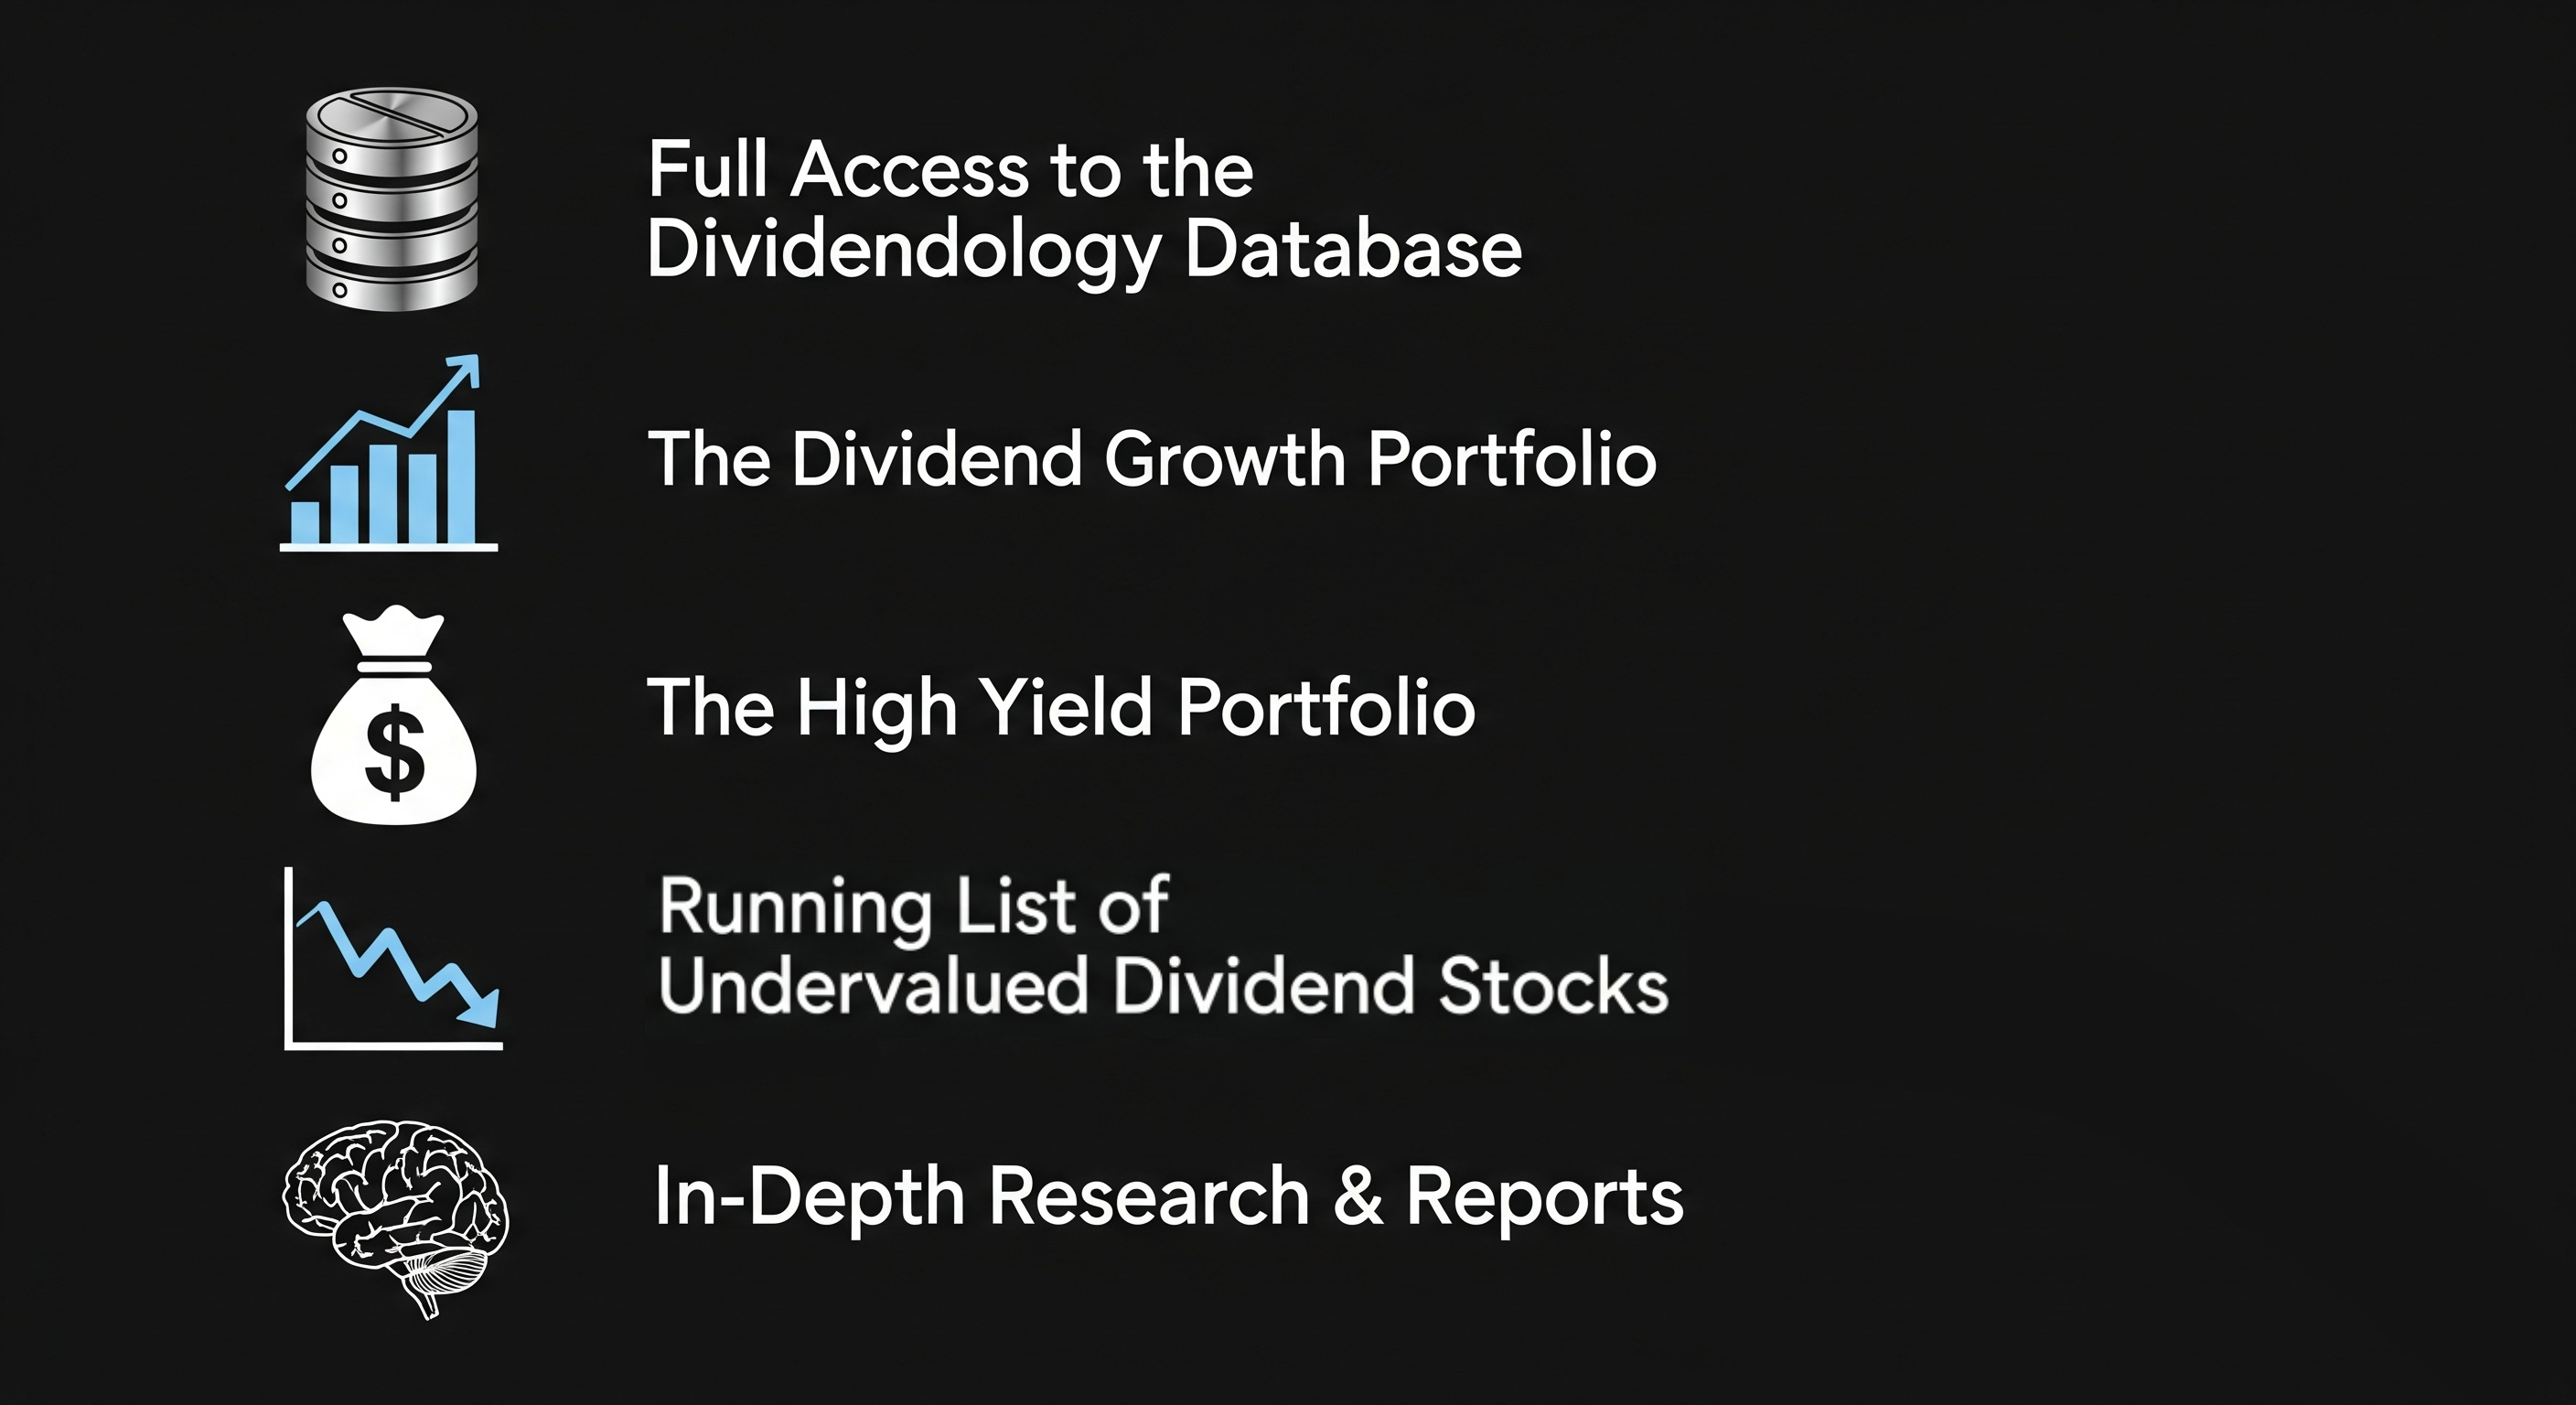
Check out these resources:
Tickerdata 🚀 (My automated spreadsheets and instant stock data for Google Sheets!)
Interactive Brokers 💰 (My favorite place to buy and sell stocks all around the world!)
Seeking Alpha 🔥 ($30 off! + 7 day free trial)
Apart from AFFO, there is also CAD/FAD (Cash available for distribution/Funds available for distribution).
Yeah, the space hasn't agreed on one common name for this yet.