
🚨Amazon Stock Fell 80%!
The Case For Quality Dividend Growth 📊

In theory, one of the goals for our Dividend Growth Portfolio is simple-
We want to buy high quality companies, ideally at undervaluations.
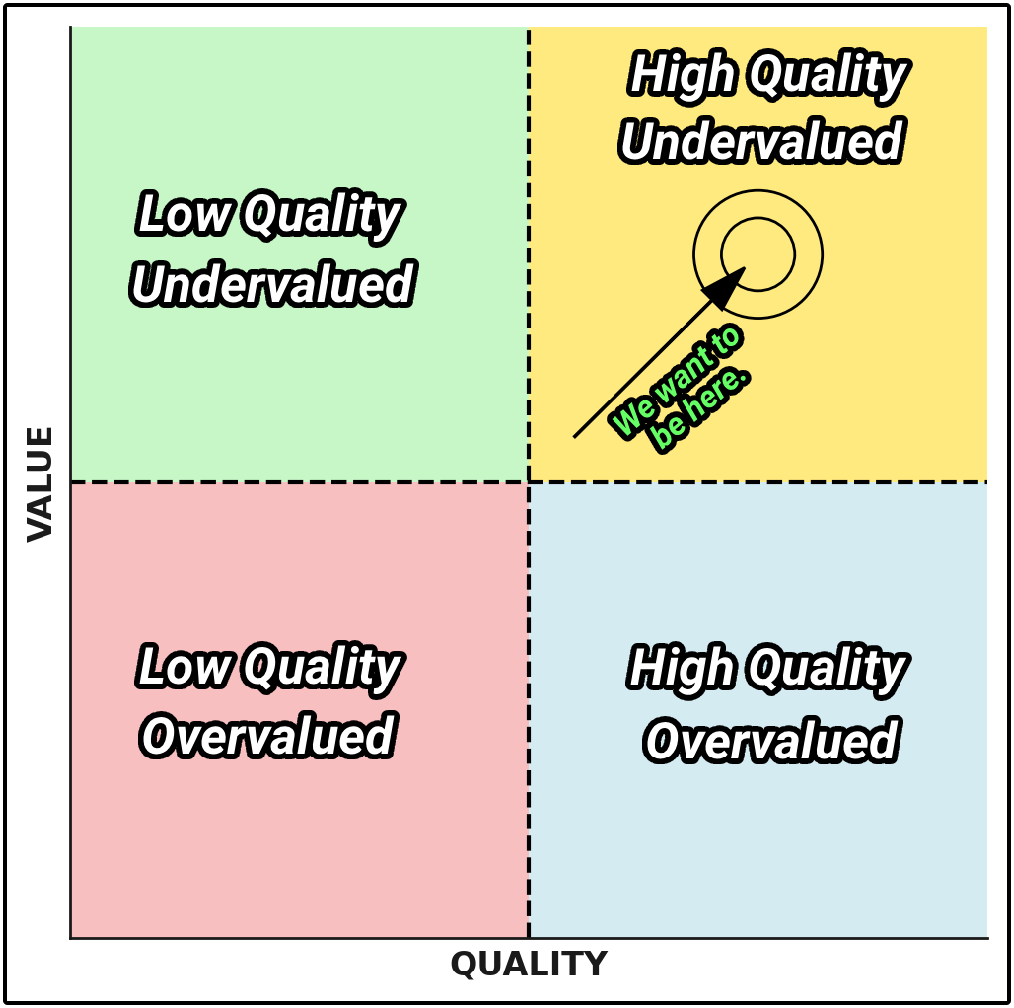
Last week, we learned that Return on Invested Capital is perhaps one of the top indicators of the quality of the company.
Today, we will build on that idea by looking at how quality translates into compounding-
Not just in earnings, but across every layer of a company’s financial engine.
💥 Amazon in 2000
In the year 2000, Amazon stock dropped by 80%.
Sentiment toward the stock market, internet companies, and Amazon was at an all-time low.
Then, Jeff Bezos shocked everyone with this letter to shareholders.
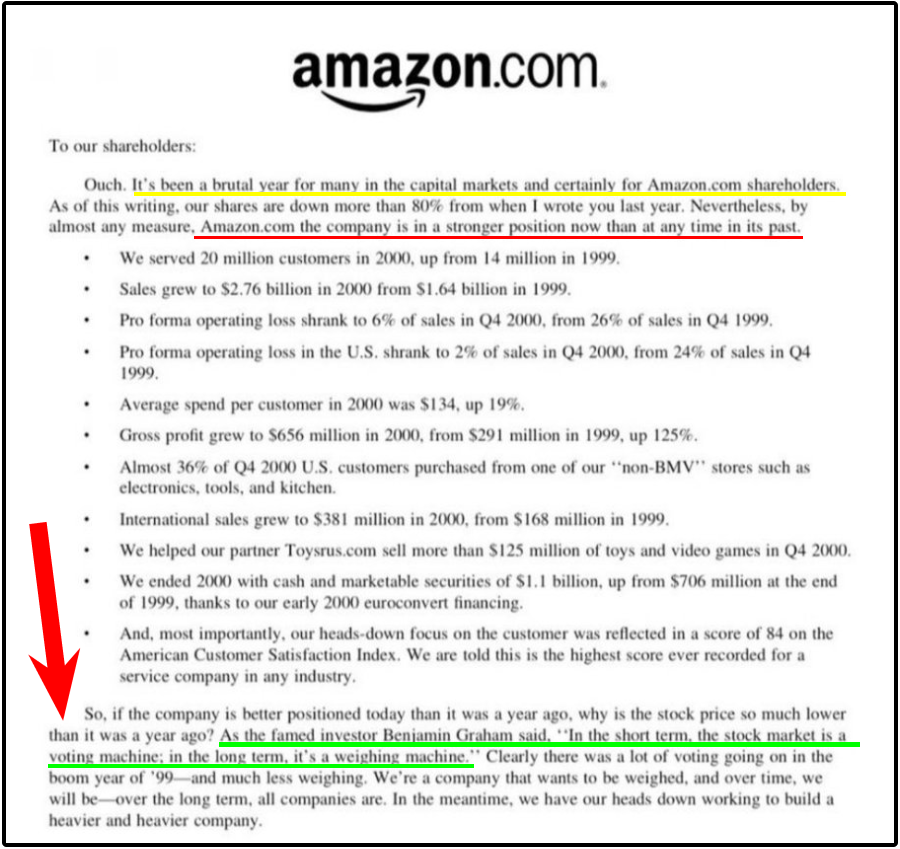
Instead of panicking, he highlighted how the company had never been stronger.
At the end of his letter, Bezos quoted Benjamin Graham:
“In the short term, the stock market is a voting machine; in the long term, it’s a weighing machine.”
But how do we measure whether or not the company is fundamentally getting stronger?
⚙️ The Power of Quality Compounding
Free cash flow per share is the ultimate driver of returns over the long term.
Growing free cash flow per share essentially means the company is growing intrinsic value.
However, there are multiple levers a company can pull to grow intrinsic value-
Let’s look at a Visa case study.
Below, we can see the compounded annual growth rate for Visa over a 5 year period.
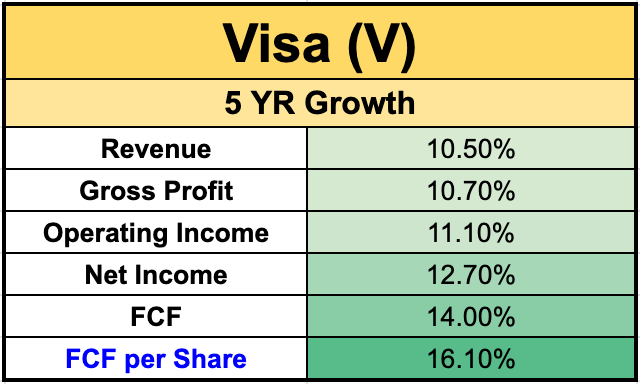
As we move down the income statement, we can see that each metric grew faster than the last.
Why was this the case?
1. 📈 Revenue Growth
Visa’s revenue grew at a double-digit rate over the 5 year time period.
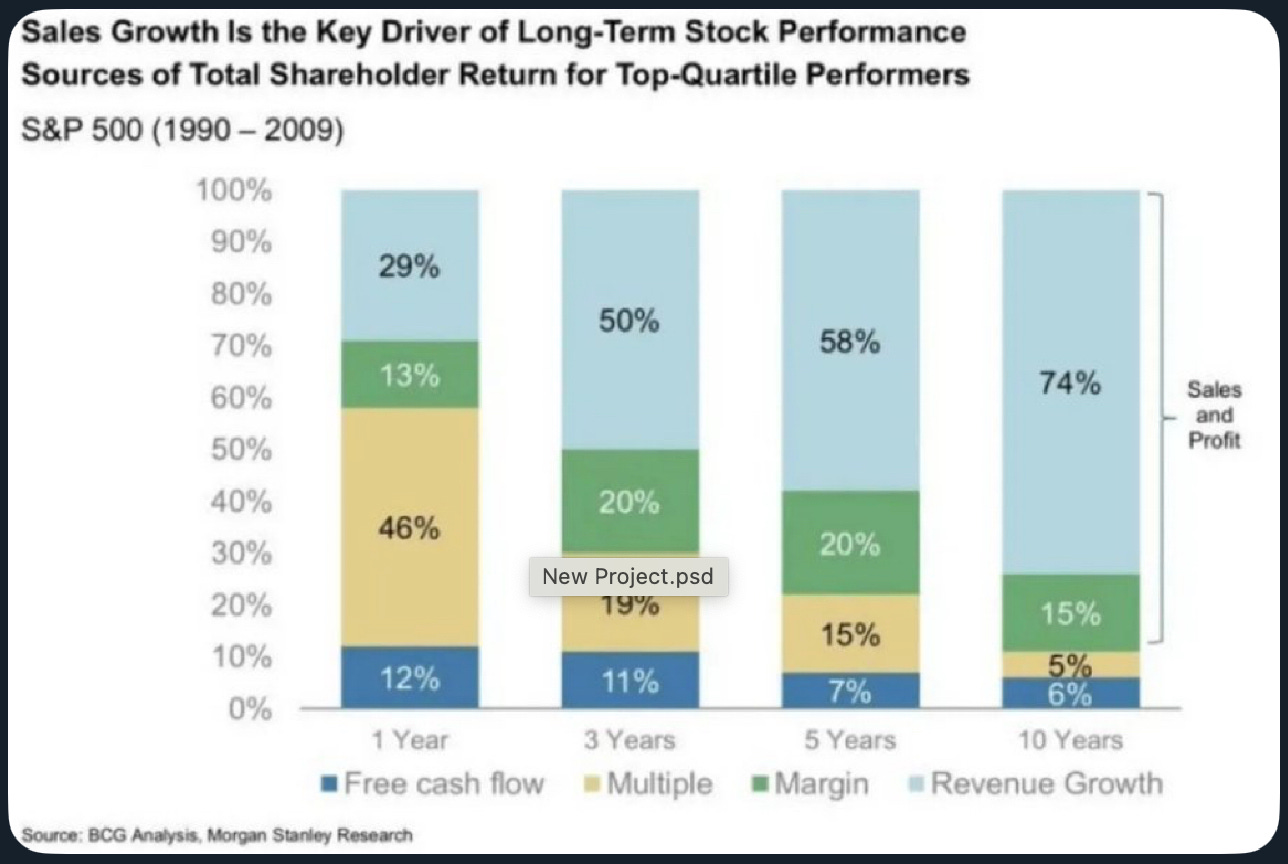
Over the long term, sales growth is a key driver of stock performance.
2. 💰 Revenue → Gross Profit
Visa’s gross profit grows faster than revenue because high-quality companies expand their margins over time.

This happens when they can raise prices without losing customers.
Visa can raise transaction fees and expand into new services without losing customers.
Visa is a clear example of pricing power.
3. 📊 Gross Profit → Operating Income
Operating income grows faster than gross profit as the company becomes more efficient.
For example, reducing R&D, sales, and administrative costs relative to revenue can increase operating margins.
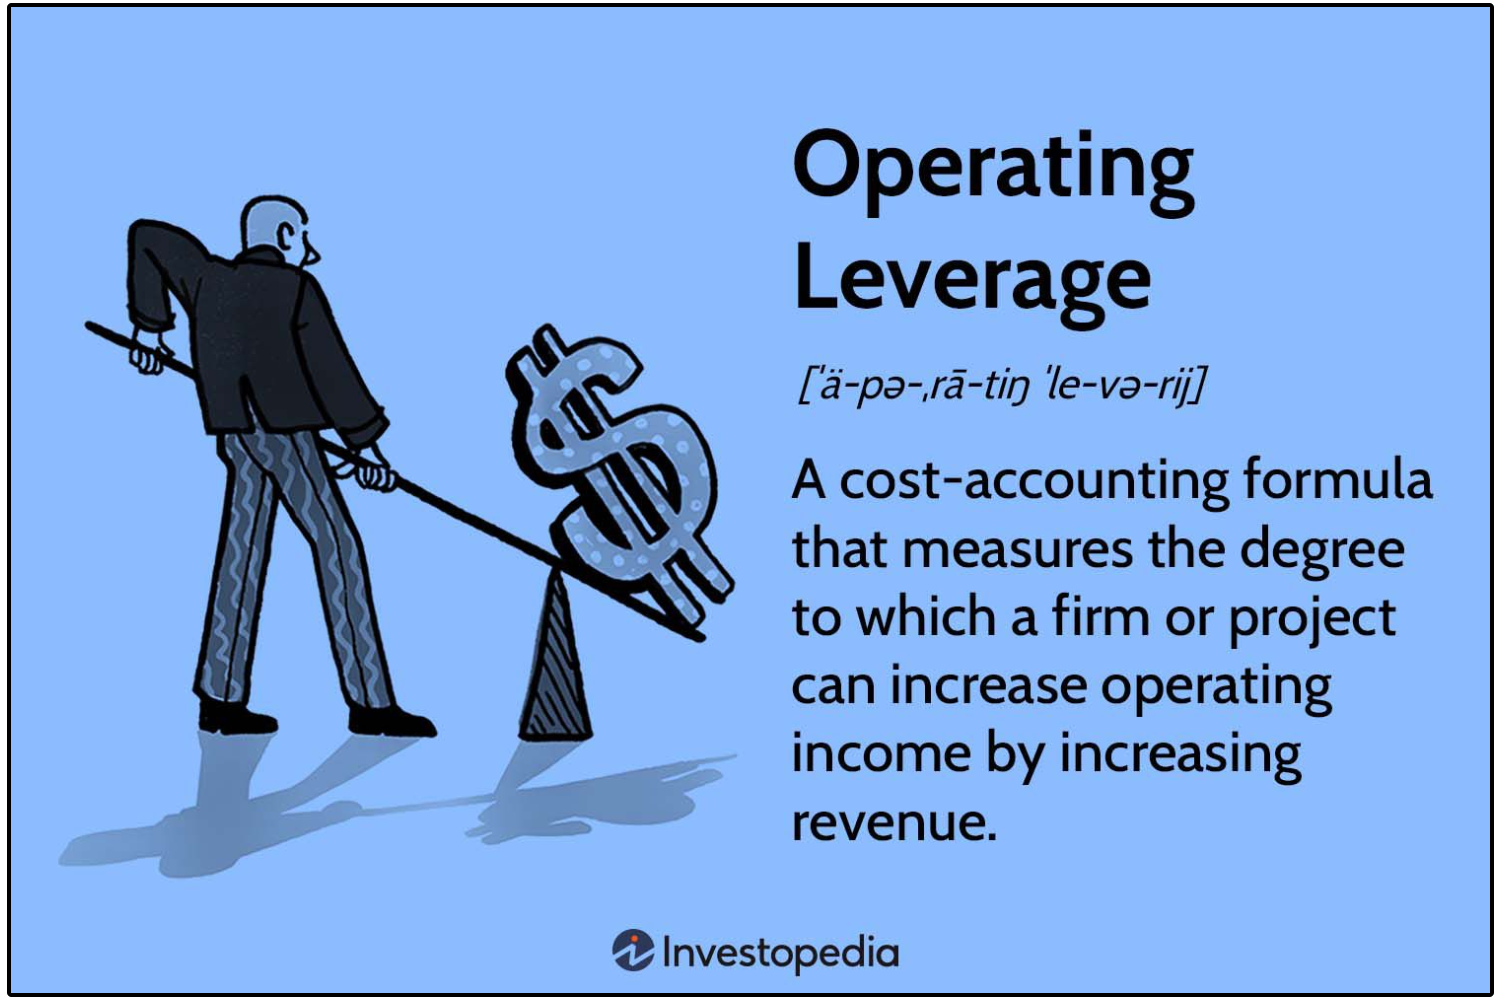
Each new dollar of revenue now contributes more directly to profit.
That’s operational leverage in action.
4. 💵 Net Income → Free Cash Flow
Free cash flow grows faster than net income as the company manages its cash more effectively, reducing capital expenditures while maintaining growth.
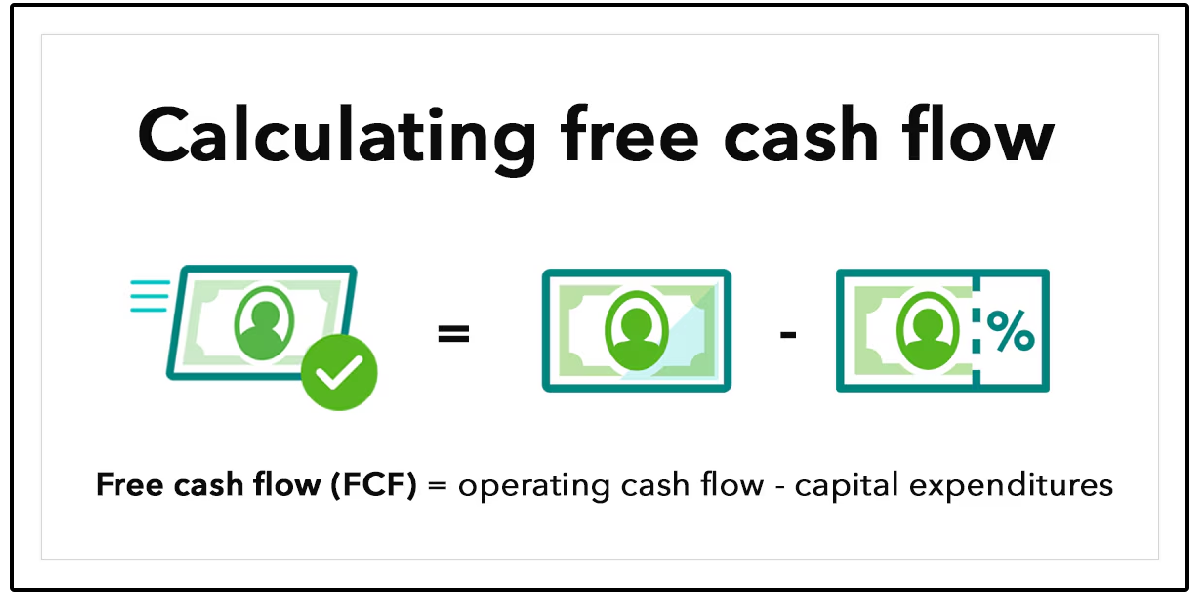
That’s the power of cash conversion.
5. 🧩 Free Cash Flow → Free Cash Flow per Share
Free cash flow per share grows faster than total free cash flow because companies like Visa use excess cash to buy back stock.

This shrinks the total share count and increases ownership per share.
If a company generates $10 million in free cash flow and has 1 million shares outstanding-
That’s $10 of free cash flow per share.
If the company uses some of that cash to repurchase 10% of its shares, the share count drops to 900,000.
Even if total free cash flow stays the same at $10 million, free cash flow per share rises also:
$10 million ÷ 900,000 = $11.11 per share.
That’s an 11% increase in free cash flow per share, without any actual business growth.
6. 🚀 Free Cash Flow per Share → Share Price
This is perhaps the most interesting part.
As mentioned above, free cash flow per share is the ultimate driver of returns over the long term.
Growing free cash flow per share essentially means the company is growing intrinsic value.
So if a company’s free cash flow per share grows 10%, does that mean its share price will grow 10%?
Not typically.
In a scenario like Visa, where the company is improving fundamentally at every level, share price will often grow faster than free cash flow per share.
The reason is because of the other engine of outperformance.
Multiple expansion.
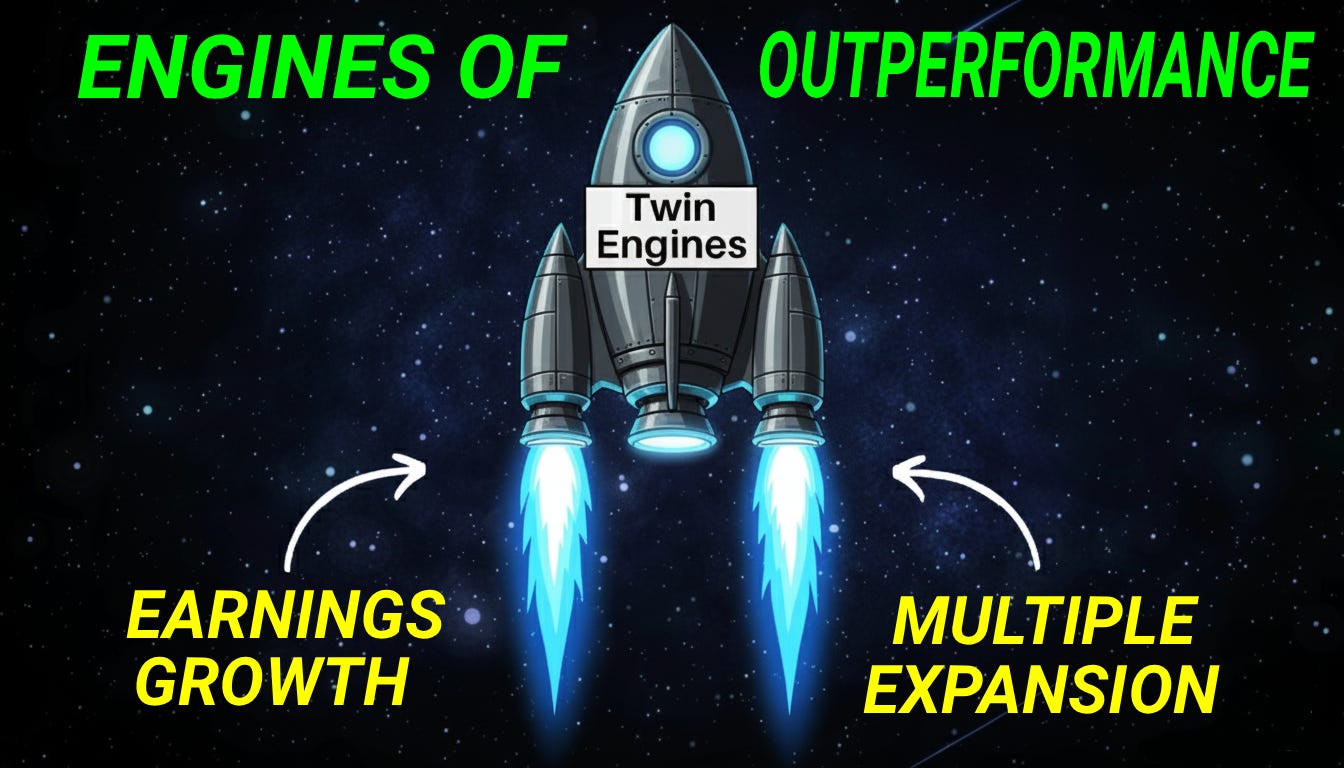
Investors are willing to pay higher valuation multiples for companies that grow earnings and free cash flow at high rates, have predictable revenue streams, and are improving at every fundamental level the way Visa was.
⏳ Connecting The Dots
When you break down Visa’s growth, each layer builds on the one before it.
Revenue growth drives margin expansion, margin expansion drives operating leverage, operating leverage drives cash flow growth, and buybacks amplify it all.
But the beautiful part about this?
The market doesn’t always recognize it right away.
This is incredible news.
This is what creates incredible opportunities to be high quality companies at wonderful valuations.
As free cash flow per share grows, management’s ability to reward you as a shareholder grows, and over the long term, the amount they can pay you in dividends grows.
🏆 Our Dividend Growth Portfolio
In the last few months, we began the process of building our 2 real money portfolios:
The Dividend Growth Portfolio
The High Yield Portfolio
We recently made the first addition to our Dividend Growth Portfolio.
And guess what?
The stock we bought is currently going through the exact same situation Visa went through.
It’s improving at every fundamental level, allowing free cash flow per share to grow substantially faster than revenue.
If you’d like to get access to the Portfolios and all the features below, you can do so here:
📊 Full Access to the Dividendology Database
Built with over $10,000 invested in tools and research, this powerful database tracks dividend stocks and alternative income assets like Covered Call ETFs, REITs, and BDCs.📈 The Dividend Growth Portfolio
A real-money portfolio built from scratch, focused on long-term wealth creation and building a rapidly growing stream of dividend income💸 The High Yield Portfolio
A real-money portfolio, designed to generate massive sustainable income with an average yield of 8%+📉 Running List of Undervalued Dividend Stocks
Updated regularly — stay ahead with a curated list of the most attractively valued dividend opportunities in the market🧠 In-Depth Research & Reports
Deep dives into dividend stocks and income strategies you won’t find on mainstream platforms
Check out these resources:
Tickerdata 🚀 (My automated spreadsheets and instant stock data for Google Sheets!)
Interactive Brokers 💰 (My favorite place to buy and sell stocks all around the world!)
Seeking Alpha 🔥 ($30 off! + 7 day free trial)
The Dividend Report 📊 (Free Newsletter for Straightforward Dividend Stock News)