

There’s a strange misconception in the investing world.
Mention the word dividend, and a lot of investors immediately assume one thing:
Underperformance.

There’s just one problem.
The historical data doesn’t support that conclusion-
At least not when we’re talking about dividend growth investing.
In fact, the data is quite shocking.
Here’s what you need to know.
💰 Capital Allocation
Do you know what the most important task of management is?
It’s capital allocation.

Ultimately, the dividend a company pays out tells you very little about a company without considering their entire capital allocation framework.
As a reminder, a company has five different ways it can allocate its free cash flow.
It can:
Reinvest in the business
Make acquisitions
Pay down debt
Repurchase shares
Pay dividends
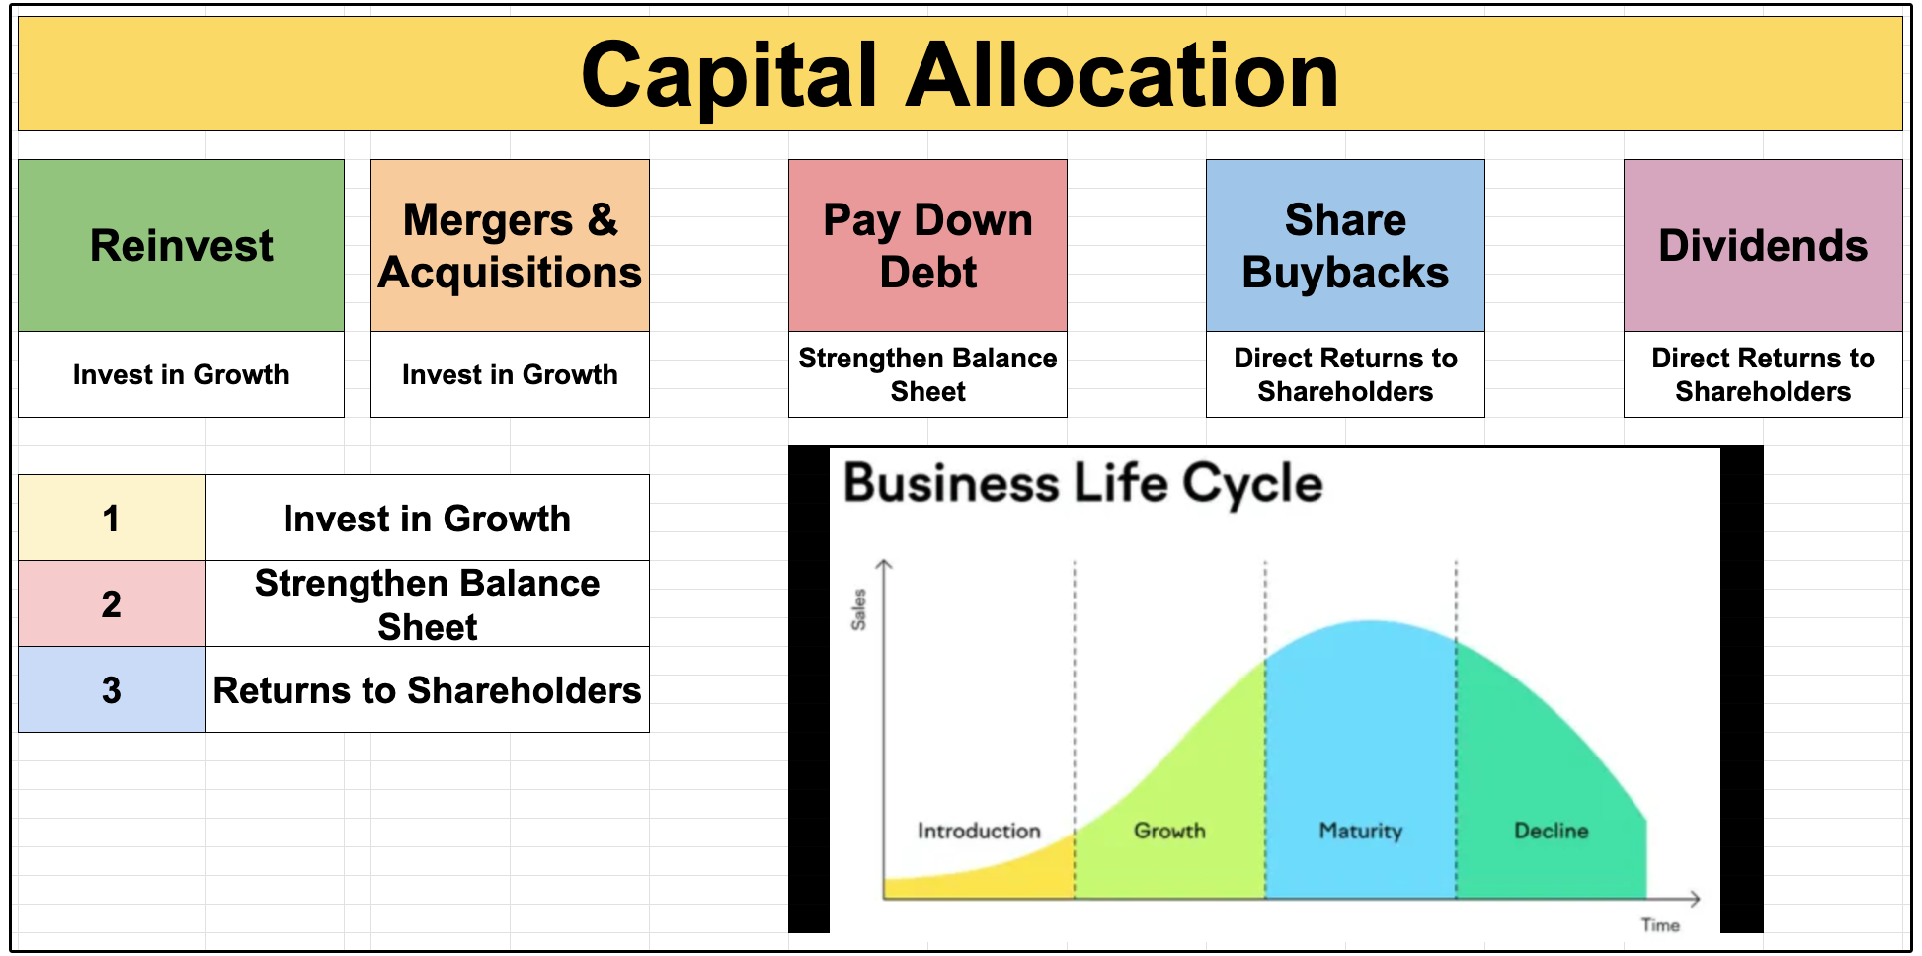
The goal of management is to decide the best way to allocate that capital.
Of course, if a company uses all of their capital to pay out dividends, they cannot reinvest back into the business, making it more difficult to grow free cash flow in subsequent years-
Which actually makes it more difficult to grow dividends in the future.
But wait a second-
Doesn’t this mean if a stock stopped paying a dividend and reinvested all of its capital, then free cash flow would grow faster leading to more share price appreciation?
Ⓜ️ The Meta Case Study
When Meta announced plans to start paying dividends in early 2024, many investors were surprised.
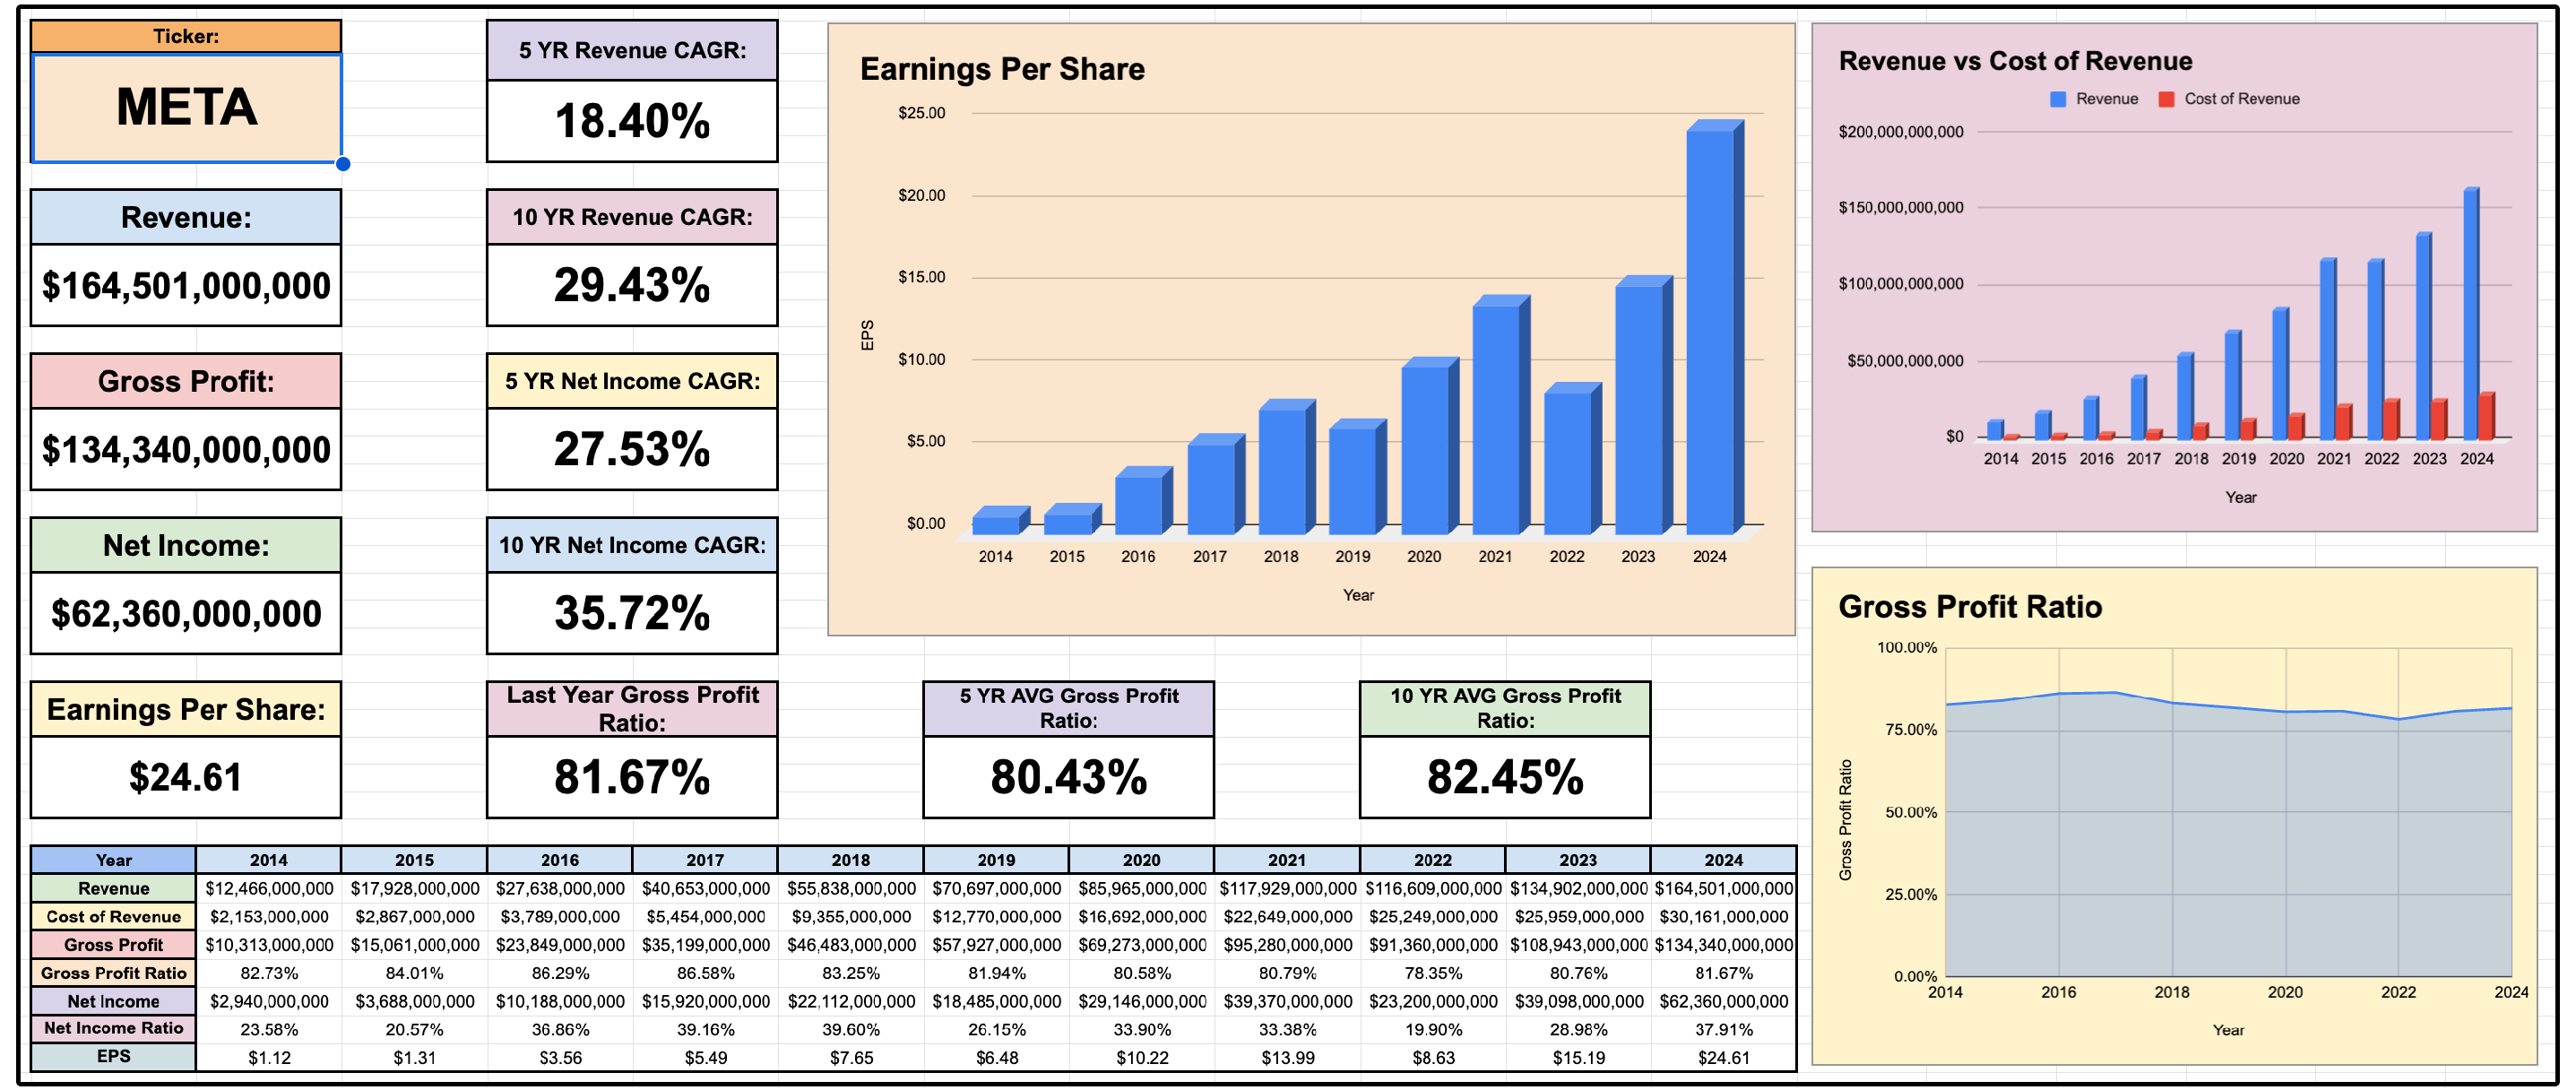
Here was a company with exceptional profitability, a five-year revenue CAGR of 18.4%, over $91 billion in current assets, and minimal debt.
So why start paying a dividend?
Because the company was generating so much free cash flow, it became impossible to reinvest all of it at high rates of return.
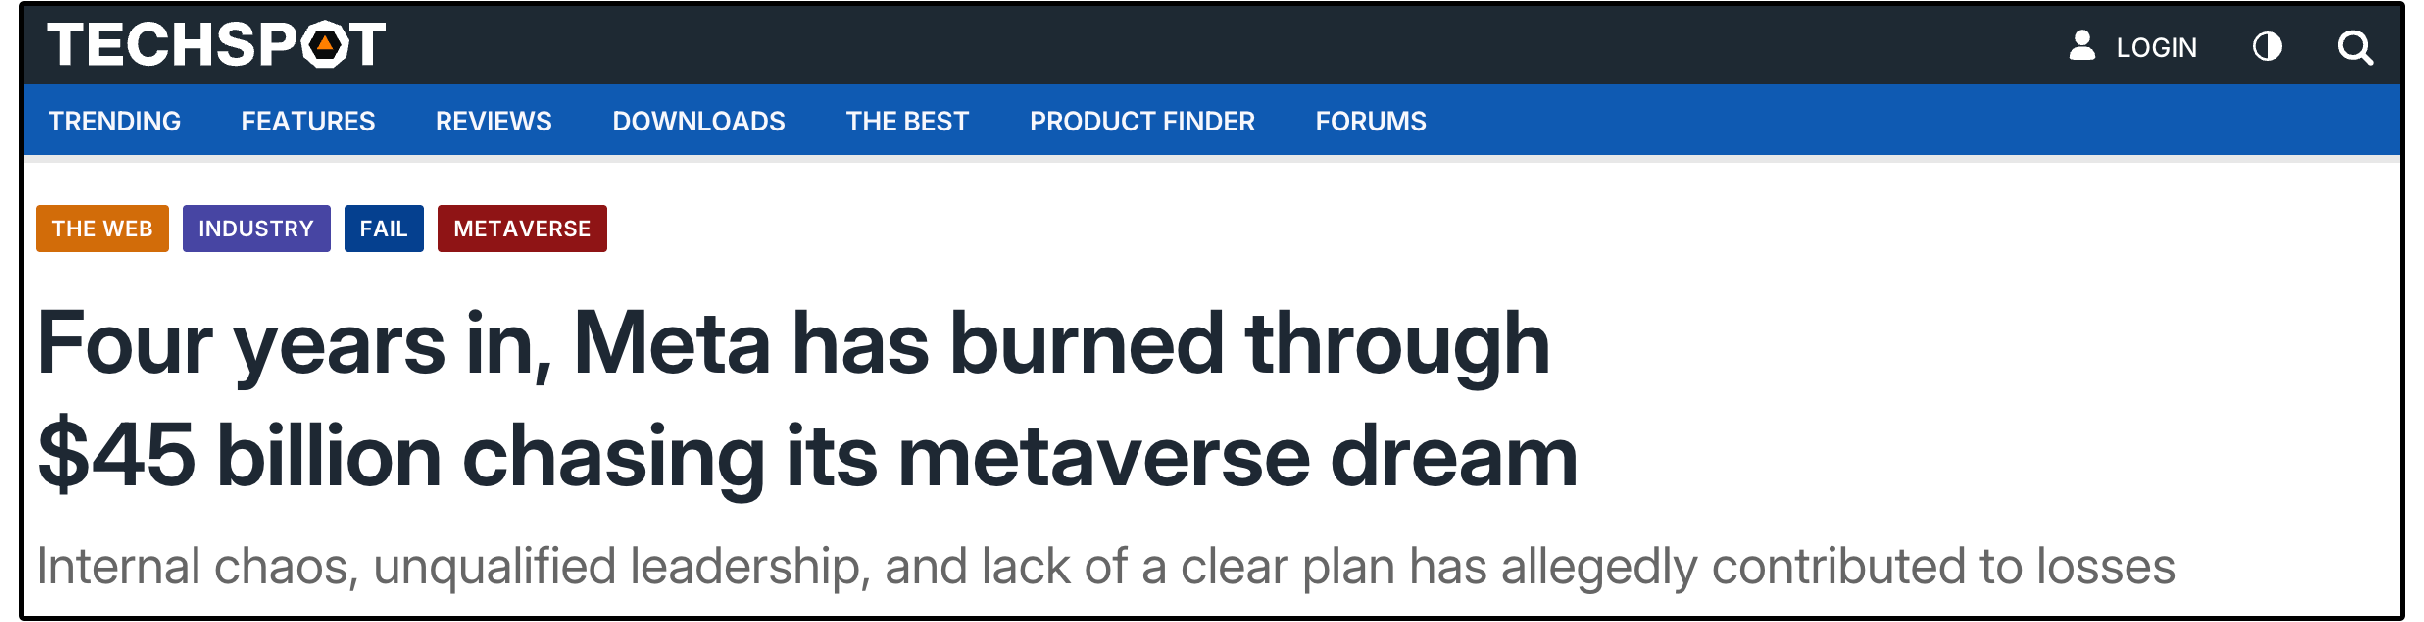
Over the prior four to five years, Meta burned through $45 billion trying to build Reality Labs, their metaverse division, which turned out to be unprofitable.
That’s $45 billion of capital deployed at returns well below their cost of capital.
This is the critical point:
Even the best companies can destroy shareholder value if they reinvest too much capital into low-return projects.
If Meta would have paid out that $45 billion in dividends instead of reinvesting it into low ROI projects, it would have actually increased the company’s total return!
Proper capital allocation always maximizes shareholder returns.
The reality is that a steadily rising dividend can sometimes be a symptom of an exceptional business, rather than a limitation on one.
Think about what a rising dividend signals:
Management is confident future cash flows will remain strong
The company can fund growth and return excess cash to shareholders
Free cash flow is consistently growing
But all of this still doesn’t tell the whole story.
Now that we have a basic understanding of capital allocation, we can start to make sense of some ‘eye-opening’ data…
📊 The Shocking Long-Term Data
Look at how the Dow Jones U.S. Dividend 100 Index is constructed.
The index doesn’t simply grab the 100 highest-yielding stocks in America.
S&P Dow Jones Indices requires a history of consistent dividend payments and then evaluates companies using measures including:
Cash flow to total debt
Return on equity
Dividend yield
Five-year dividend growth
S&P explicitly describes the objective as finding companies capable of producing “quality yields.”
Dividend growth investing is quality investing.
Here’s where things get really interesting.
The Dow Jones U.S. Dividend 100 Index has a documented base date of December 31, 1998 and a base value of 1,000.
The index itself wasn’t officially launched until August 31, 2011, so the period before that is backtested rather than live performance.
But the historical index methodology allows us to examine how this strategy would have performed across multiple market environments.
Using the August 7, 2026 total-return index level I pulled, here’s what the full period looks like:
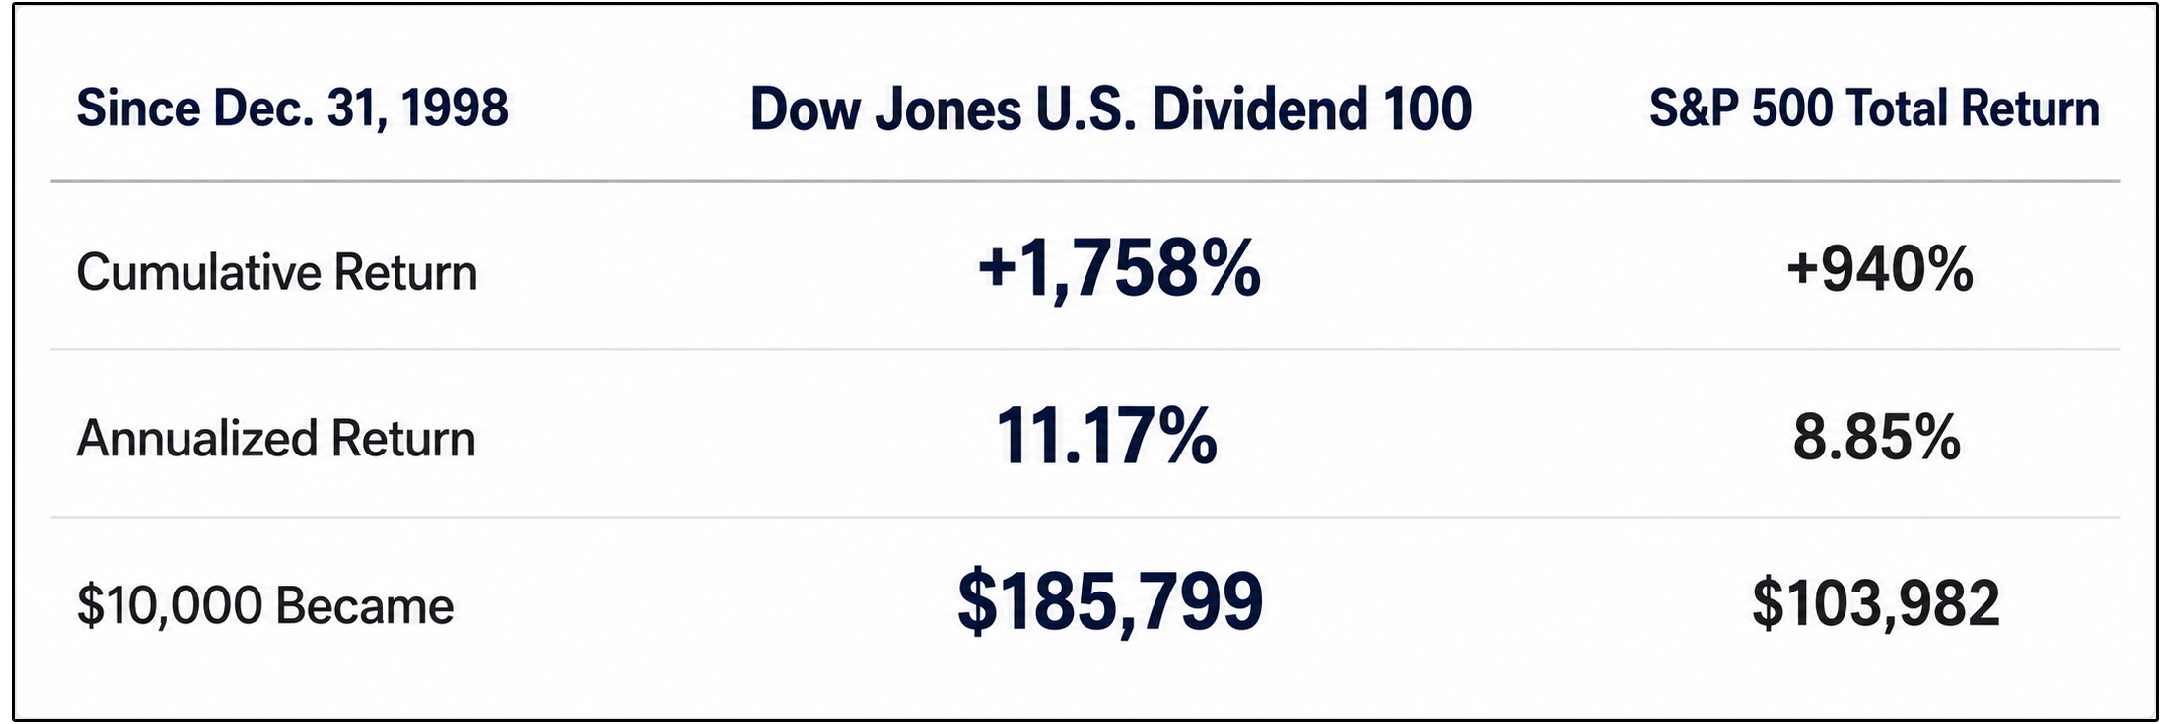
Read those numbers over a near 30 year time period again.
A $10,000 investment in the dividend strategy would have grown to approximately:
$185,799.
The same amount invested in the S&P 500 would have grown to approximately:
$103,982.
That’s an $81,000 difference.
And what’s even crazier is how small the annual difference initially looks.
11.17% versus 8.85%-
Which is just 2.3 percentage points per year.
But compound 2.3% of annual outperformance for almost three decades and suddenly you’re talking about nearly 80% more ending wealth.
S&P Global reached a similar conclusion in its own research.
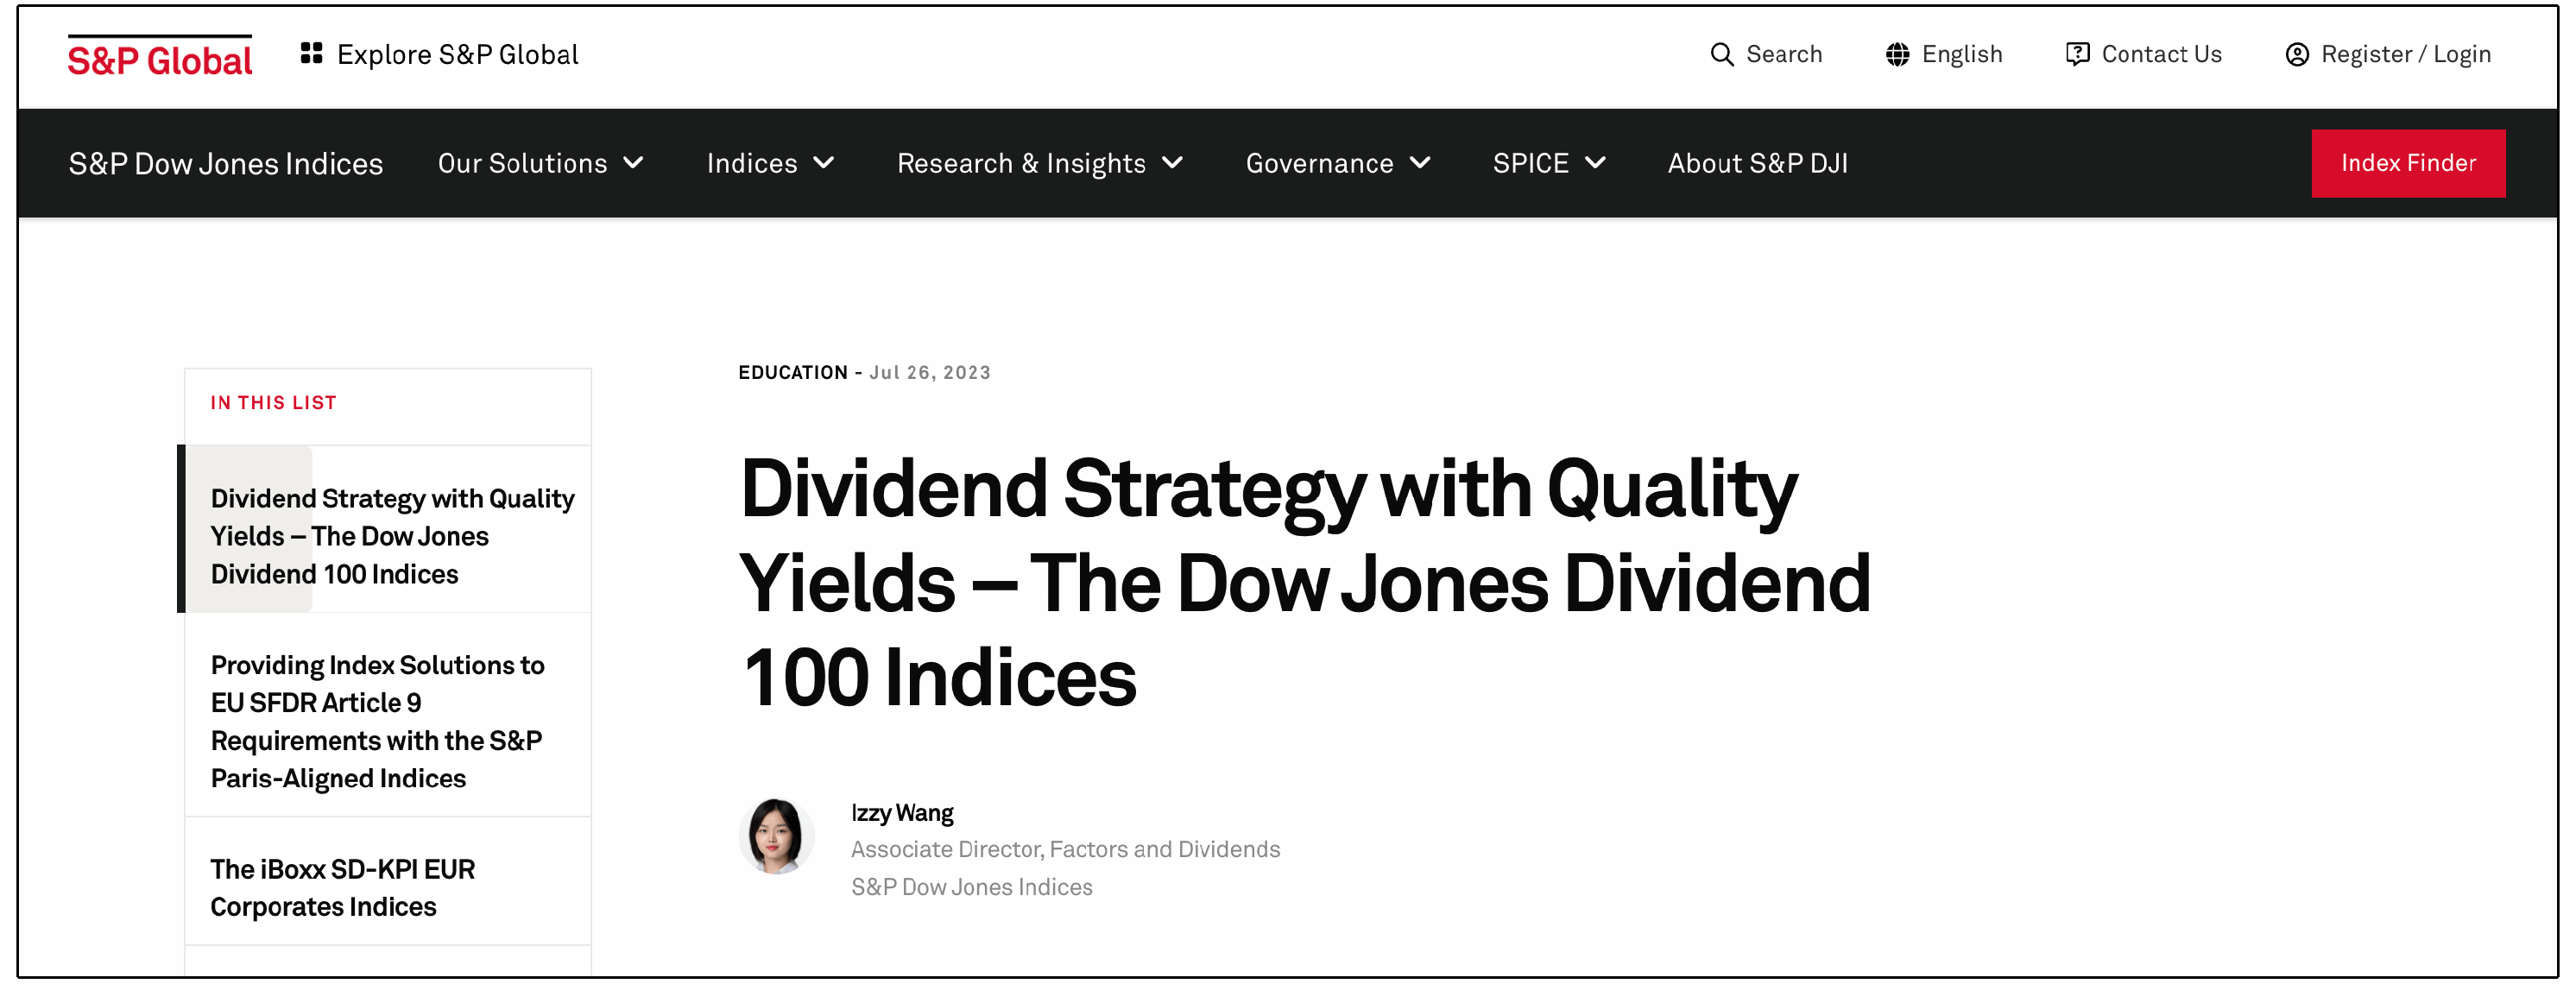
In one study covering June 2001 through June 2023, the Dow Jones U.S. Dividend 100 Index produced an 11.7% annualized return, compared with 10.2% for the broader Dow Jones U.S. stock market benchmark-
Which means that the dividend strategy still outperformed… even if we don’t include the dot com bubble market crash.
So where does that outperformance come from?
📈 Dividend Growth Doesn’t Win Every Year
One of the biggest mistakes investors make is judging a strategy based on whatever has worked over the last three years.
Every investment strategy goes through periods of underperformance.
This is obvious to most investors.
Dividend growth investing can absolutely underperform-
Especially during extremely strong bull markets.
Imagine an environment where investors are willing to pay almost any valuation for the fastest-growing technology companies.
Those companies explode higher.
Meanwhile, a profitable healthcare company growing earnings at 8% or 9% annually looks boring by comparison.
Dividend growth falls behind.
But as we learned above, as well as in this study from Hartford Funds, is that dividend growth outperforms over full market cycles.
But where that outperformance comes from is interesting.
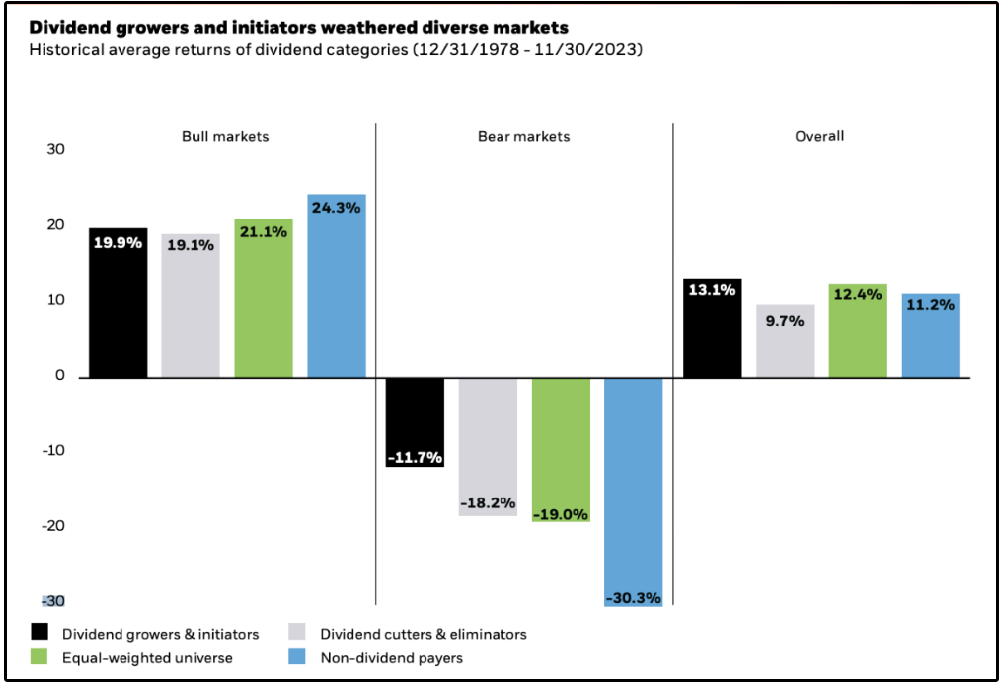
From 1978 through 2023, dividend growers and initiators averaged a loss of just 11.7% during bear markets, compared with:
−18.2% for dividend cutters and eliminators
−19.0% for the equal-weighted universe
−30.3% for non-dividend-paying stocks
The trade-off is that non-dividend payers produced the strongest average returns during bull markets.
But over the full period, dividend growers still generated the highest overall average return at 13.1%.
🛡️ Downside Example
Here’s a great example.
The S&P 500 finished 2022 with roughly an 18% loss, its worst year since 2008.
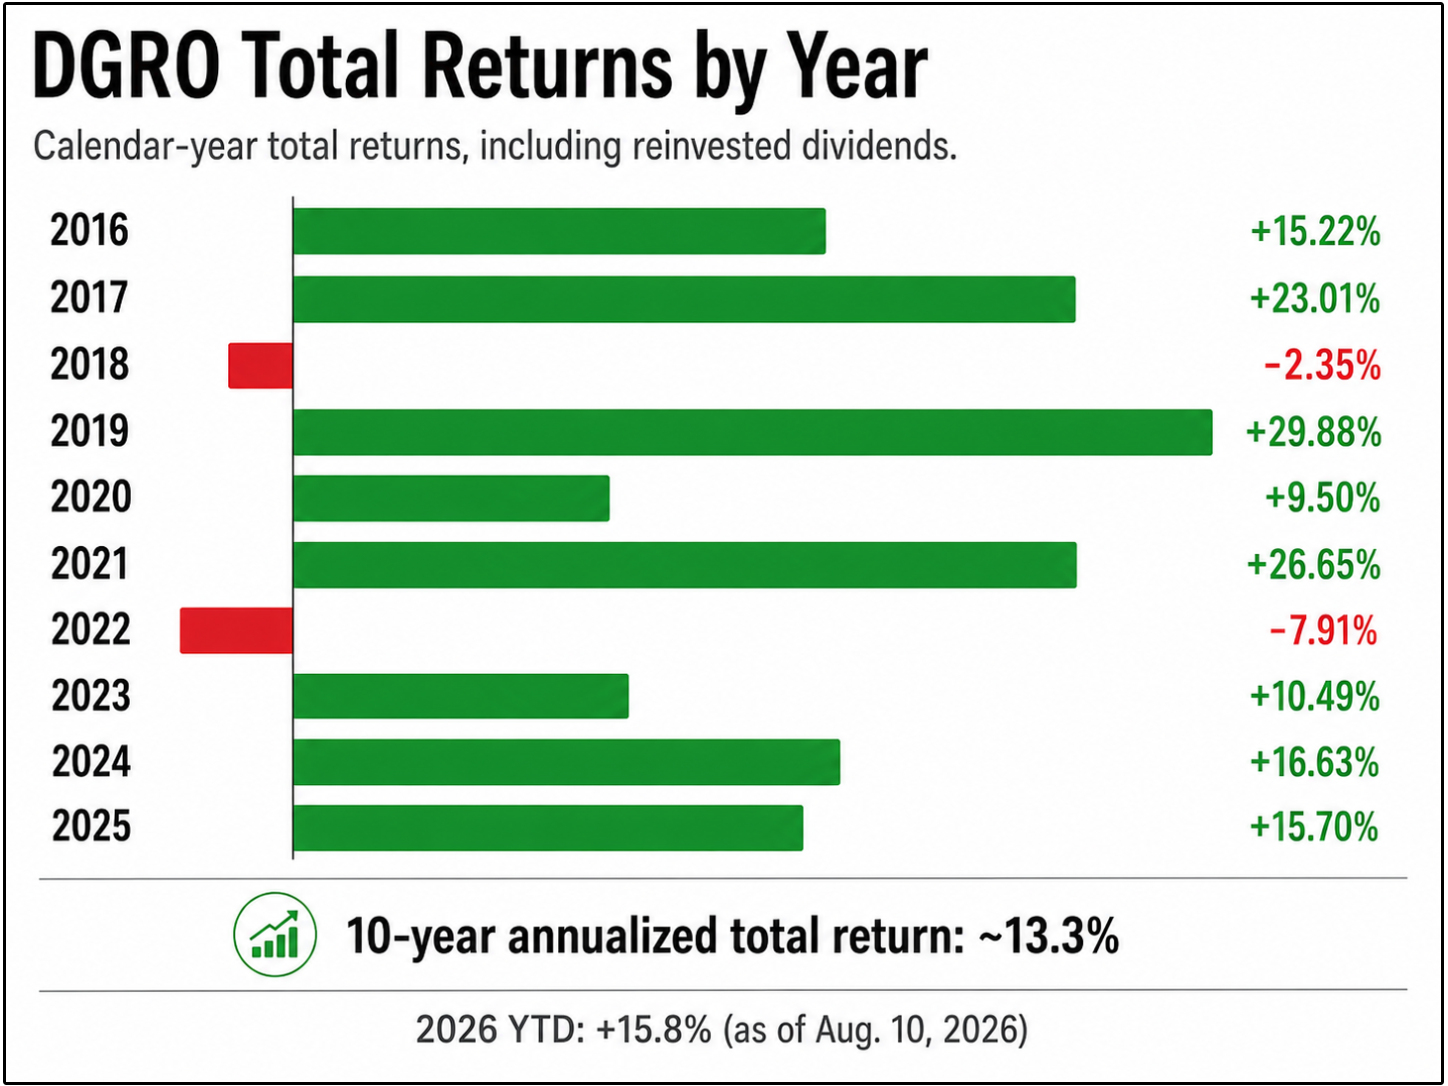
DGRO, the iShares Core Dividend Growth ETF, declined only 7.85% that year.
That’s roughly 10 percentage points of outperformance in a single year.
This is true for 2018, as well as for most down years the S&P 500 has.
What’s particularly impressive for DGRO, is the performance it has posted over the last decade.
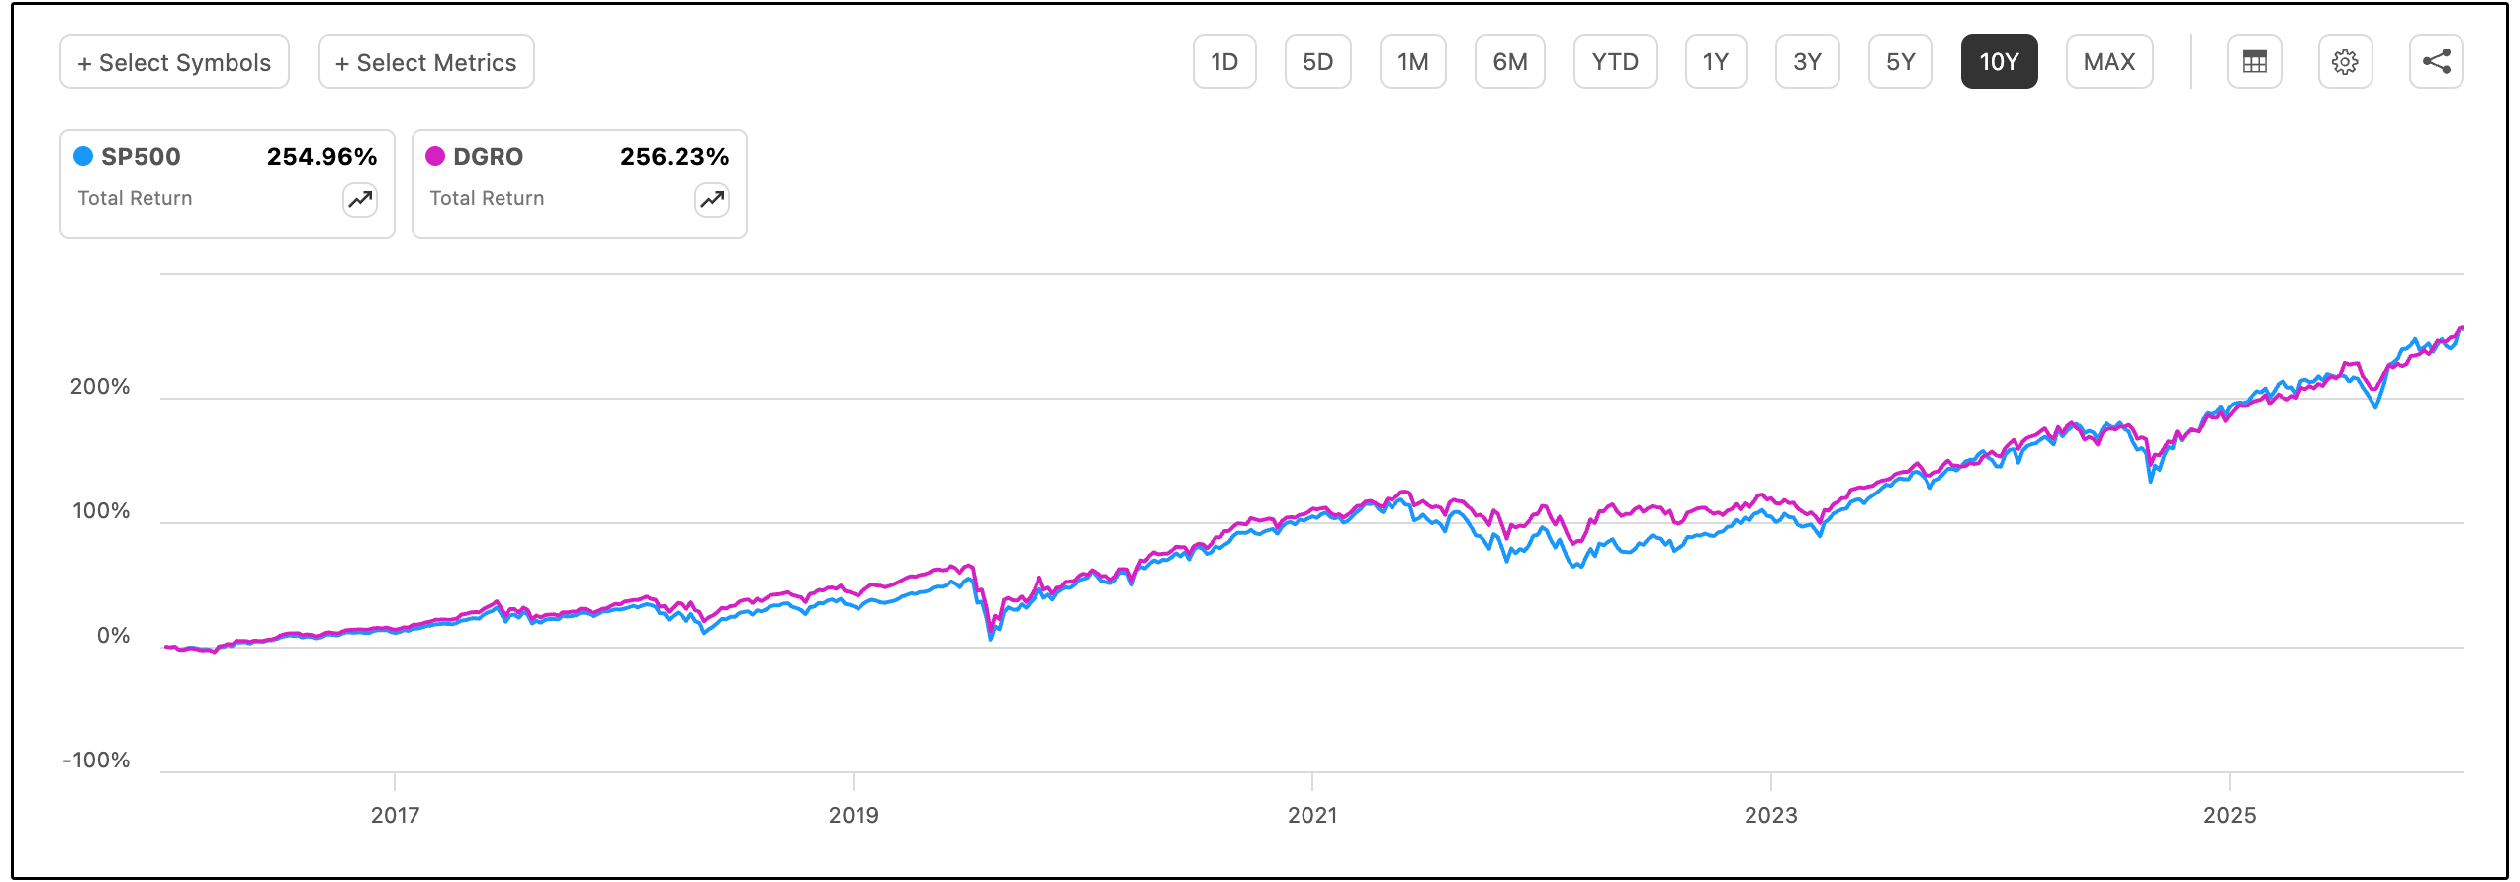
Despite the fact we’ve been operating in a major bull market over the last decade-
DGRO has actually outperformed the market:
DGRO: 256.23%
S&P 500: 254.96%
But even this outperformance doesn’t hit one of the ultimate benefits of dividend growth investing.
⏳ Sequence Risk
I discuss this frequently, but it’s a ‘must understand’ concept.
Look at this comment I saw on YouTube the other day:

The investor above, who was clearly relying on the 4% rule, completely lost their ability to stay retired during the 2000s as his portfolio dropped by 50%.
The 4% rule says a retiree can withdraw 4% of their portfolio in year one, then increase that amount with inflation.
Historically, that strategy succeeded more than 95% of the time over 30-year periods.
But that headline number hides two major risks:
Valuation
Sequence risk
The historical failures of the 4% rule occurred when investors retired with stocks at expensive valuations.
Keep in mind, the CAPE ratio is near historically extreme levels.
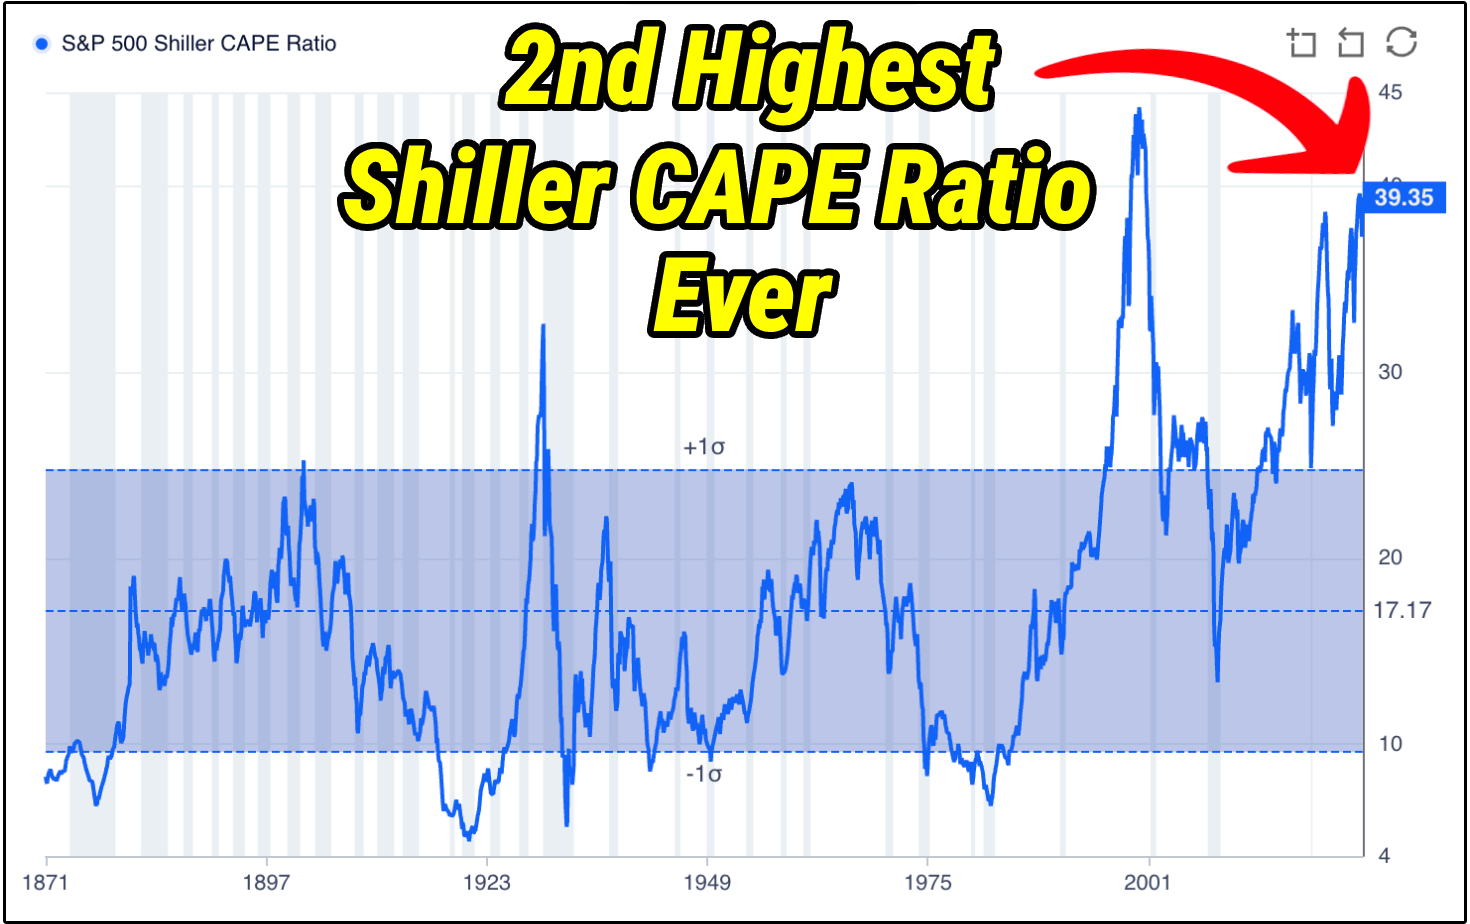
And even if valuations eventually normalize, sequence risk never disappears.
Sequence risk is what happens when poor returns hit early in retirement while you’re simultaneously selling shares to fund your lifestyle.
Two retirees can earn the exact same average return and end up with dramatically different outcomes simply because of when the bad years occur.
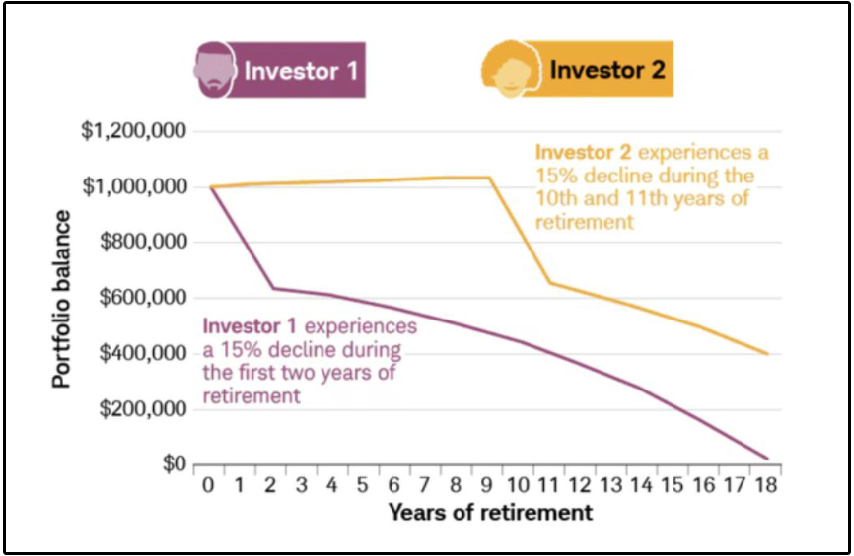
That’s why I prefer a different approach:
Build a portfolio that pays for your retirement without forcing you to sell shares.
If your dividends cover your expenses, a market crash becomes much less threatening. You can continue collecting income while allowing your shares time to recover.
Look at this recent example:
From November of 2021 to November of 2023, the S&P 500 was down 3.38%.
Inflation was up 10% during that time period.
But guess what?
S&P 500 dividends grew by 17% during that period.
This is an absolutely imperative advantage to dividend growth investing that investors must understand.
🔥 But Wait, There’s More!
We now have a much deeper understanding of dividend growth investing, and how:
It outperforms over full market cycles
Eliminates sequence risk
Dividend income can continue growing even when stock prices stagnate
A dividend does not automatically mean sacrificing growth
But there is one more element we must point out:
Volatility.
Not only has dividend growth historically outperformed, it has done so with less volatility.

Dividend growth investing has historically offered one of the rare combinations investors are always searching for…
Stronger returns, lower volatility, and a growing stream of income.
🎯 Our Dividend Growth Portfolio
Dividend growth investing is incredibly attractive-
But most investors are still yet to recognize the immense advantages this strategy has.
We’re still in the process of building out our Dividend Growth Portfolio.
What does our portfolio roughly look like right now?

In a market that many would argue is overvalued, we’ve been able to add positions to our portfolio that:
Are fundamentally healthier than the S&P 500
Are growing revenues and EPS at a faster rate than the S&P 500
Trade at a more attractive valuation than the S&P 500
And of course, our portfolio has a higher yield than the S&P 500 while growing dividends at a substantially faster rate.
Let’s review our current holdings: