
💰 Generating 10%+ Yields with BDCs!
Get Paid BIG Dividends! 🚀

Are you familiar with Business Development Companies?
These investment vehicles can often deliver double-digit yields-
And often pay out large special dividends.

But these are also incredibly dangerous investments…
If you don’t know what to look for.
Today we will be looking at 4 key metrics you have to know to evaluate BDCs, as well as creating a small watchlist of quality BDCs that meet our strict requirements.
🔍 Dividendology Database
Earlier this month, we launched the Dividendology Database.
It took me over 8 months to compile the data to actually create this database, and I had to invest over $10,000 to get access to the data.
The reason I built this?
To provide the data needed to cover alternative income asset classes like:
REITs
BDCs
Covered Call ETFs
The Dividendology Database is available to members of Dividendology, but today, I’m going to be sharing a portion of the BDC database with everyone.
📊 The BDC Database
I update the BDC database at the start of every month.
But simply by looking at a snippet of the BDC database from this past month, we can get some major takeaways.
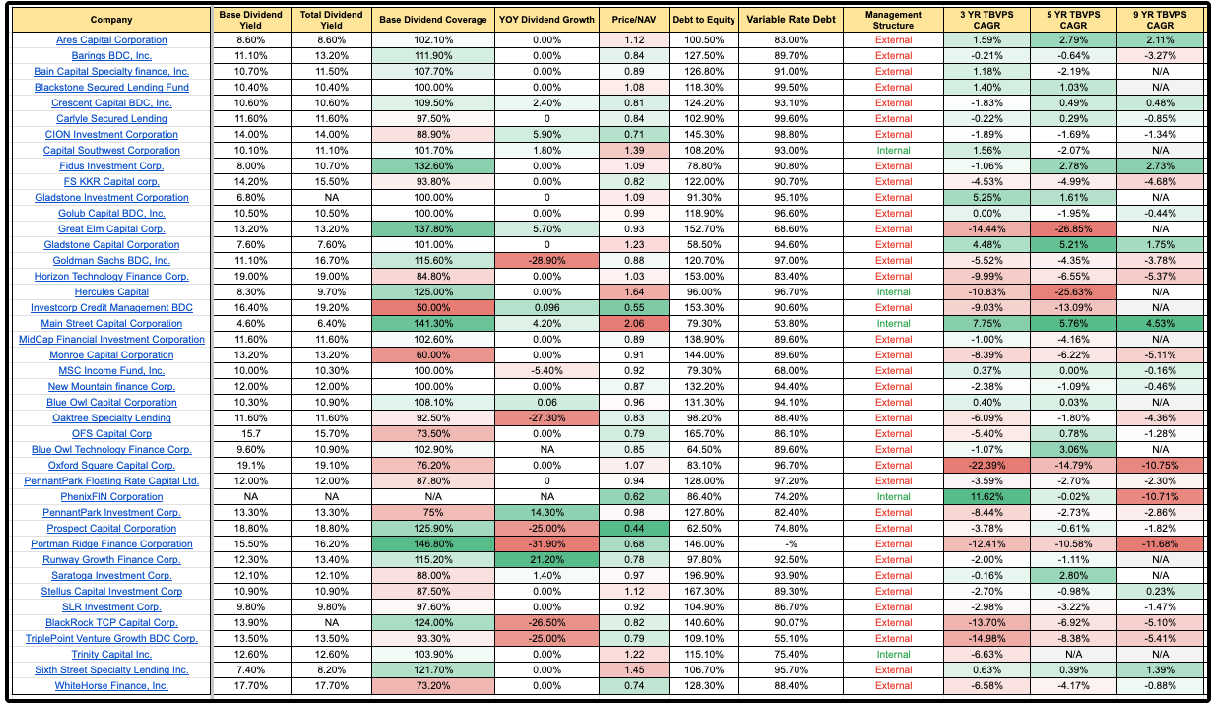
Before we dive into this part of the database and create our watchlist, let’s cover 4 of the most important metrics to analyze BDCs.
💼 4 Key Metrics
📈 1. Base Dividend Coverage
The average dividend yield of the 42 BDCs in the Dividendology Database is currently 12.65%!
As I’ve been building out the Database, I’ve come to notice that nearly every single software lists the incorrect yield for BDCs.
Why is this?
Because BDCs technically have 2 yields:
Base Dividend Yield
Total Dividend Yield
The base yield is the yield we should (hypothetically) be guaranteed to get.
Anything above that is considered “special dividends” that depends on how much extra income a BDC is generating in the moment.
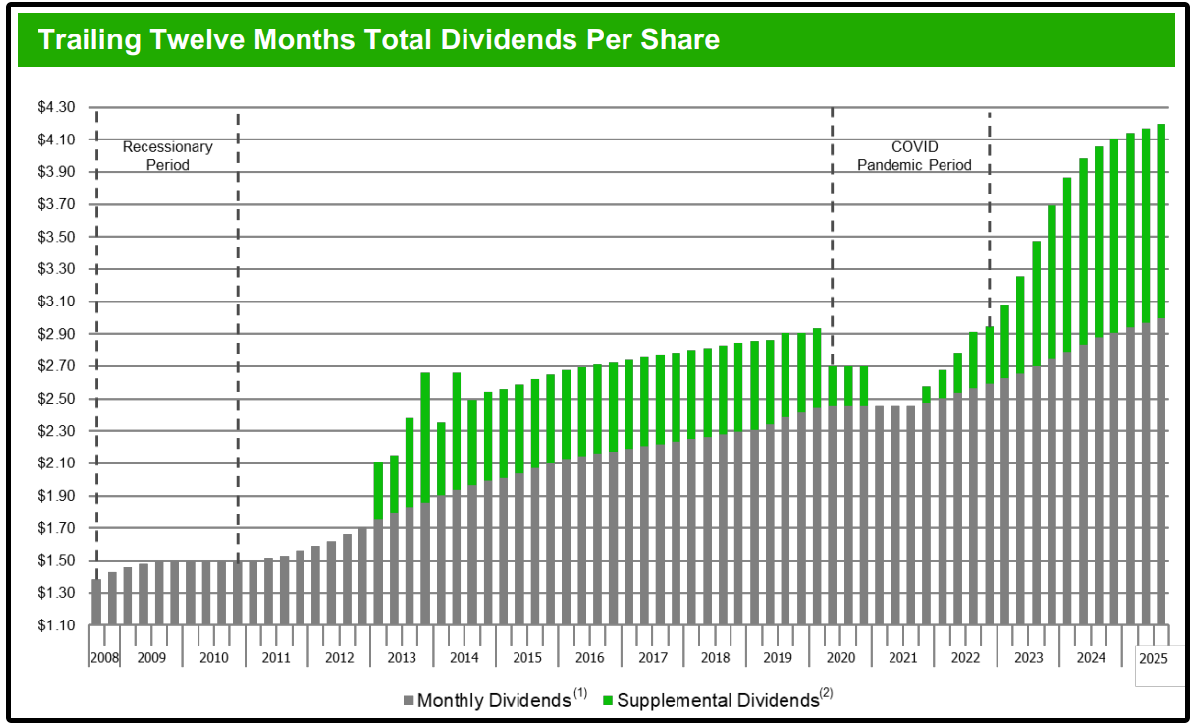
Here is Main Street Capital’s dividends paid, as well as special dividends in green.
The base dividend coverage tells us how sustainable those base dividend payments are.
BDCs don’t pay dividends out of GAAP earnings-
They pay from Net Investment Income (NII), which reflects the interest and fees collected on their loan portfolios.
Here is the formula for base dividend coverage:
Formula: Dividend Coverage Ratio = Net Investment Income (NII) / Dividends Paid100% = just covered. Above that, you have a cushion. Below that, the dividend may be at risk.
Example: ARCC base dividend coverage sits at around 102%. This means the dividend is covered, but thin if NII declines. HTGC at ~125% has much more breathing room.
Out of 42 BDCs in the BDC database, only 25 have base dividend coverage of 100% or above.
🏦 2. Rate Sensitivity (Floating-Rate Debt)
To understand rate sensitivity, we first need to remember how BDCs generate revenue.
BDCs provide loans to small and mid-sized businesses that can’t always access traditional bank financing.
In return, those businesses typically pay interest at above-average rates.
The interest collected, minus expenses, flows into Net Investment Income (NII).
Most of the loans given out by BDCs are floating rate.
When interest rates are rising, loan yields increase, boosting NII and dividend coverage.
But when rates fall, loan yields drop, squeezing NII and putting pressure on dividends.
This is why rate sensitivity is such a big deal for BDC investors.
So if a BDC has low base dividend coverage, and high variable rate debt, an environment where interest rates are being lowered could be quite dangerous…
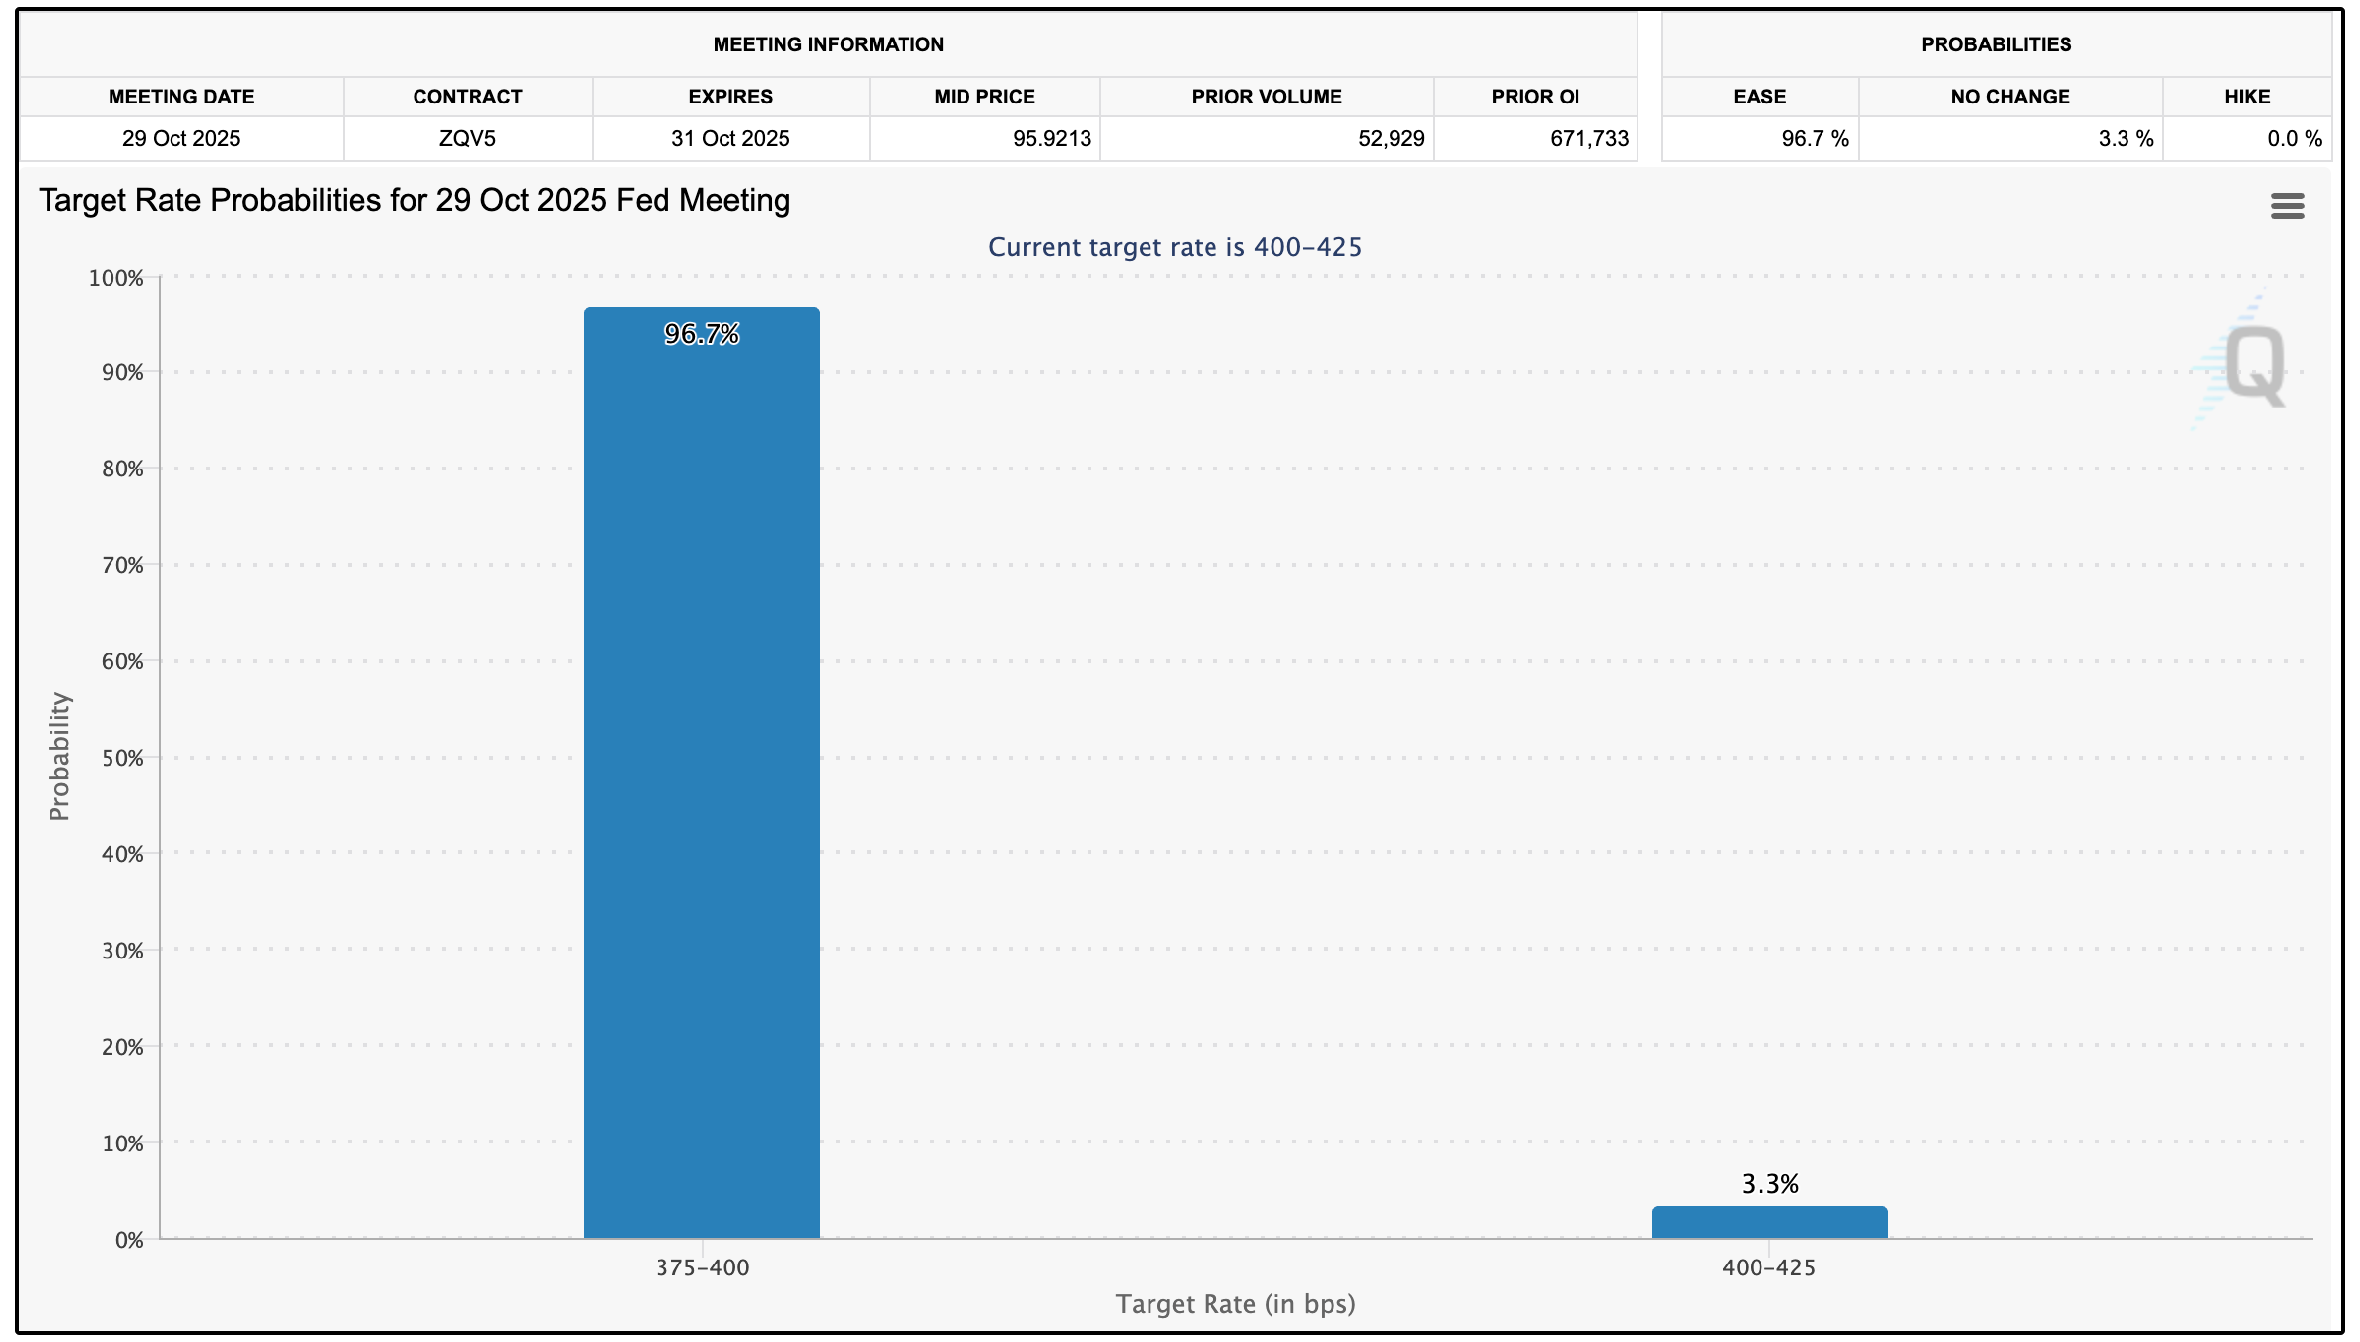
Which is the exact environment we are in right now.
In fact, there is already a 96.7% chance that the FED cuts rates again when they meet on October 29th.
22 BDCs in our database have floating rate debt of above 90%.
The BDC with the lowest variable rate debt is Main Street Capital, at just 53.80%.
💸 3. Tangible Book Value Per Share (TBVPS) Growth
When we want to see if a stock is growing intrinsic value, we see if they are growing free cash flow.
When we want to see if a REIT is growing intrinsic value, we see if they are growing adjusted funds from operations per share.
And when we want to know if a BDC is growing intrinsic value?
We check for Tangible Book Value Per Share (TBVPS) Growth.
TBVPS is the true net worth per share (assets – liabilities – intangibles).
Only about 31% of BDCs in our database showed positive 5-yr TBVPS CAGR.
TBVPS growth is the quality filter.
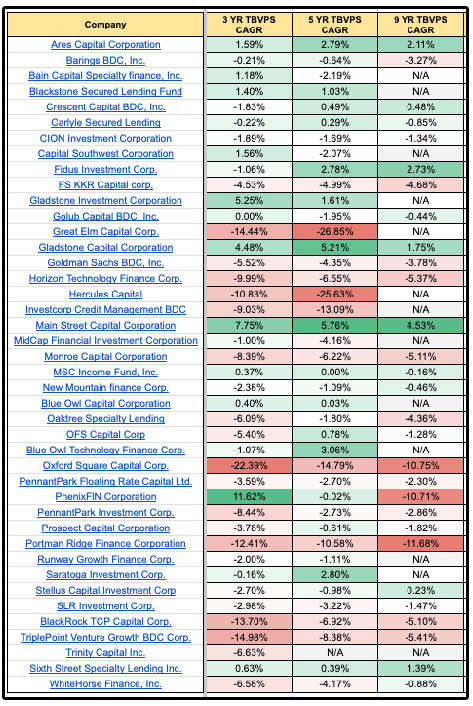
These 3 BDCs have grown TBVPS at the highest rate over the last 5 years:
Main Street Capital (5.76% CAGR)
Gladstone Capital (5.21% CAGR)
Blue Owl Technology Finance Corp. (3.06% CAGR)
⚖️ 4. Price / NAV (Valuation!)
Valuation matters.
It always does.
The simplest valuation lens for BDCs is this:
How the market prices the BDC relative to its net assets.
Premium (>1.0x NAV): When a BDC trades above NAV, investors are willing to pay more than the underlying assets are worth on paper. Sometimes this is justified if they are growing TBVPS and have healthy dividend coverage.
Discount (<1.0x NAV): When a BDC trades below NAV, it can indicate weak fundamentals, or it can be an opportunity if the BDC is improving.
The important thing isn’t to just look at the multiple itself.
It’s to analyze whether the BDC deserves to be trading at the multiple it is at.
Personally, I’m willing to pay a reasonable premium for a BDC that grows TBVPS, has healthy base dividend coverage, and has a positive future outlook.
13 BDCs in our database trade at a premium P/NAV of above 1.0x.
🧮 Creating our Watchlist
While there is certainly more we can take into account when analyzing BDCs (Management structure, spillover, credit ratings, etc)-
The 4 key metrics above are a great place to start to build a watchlist of BDCs.
Let’s run a screen on our database with the following criteria:
Base dividend coverage greater than 100%
Positive TBVPS growth over the last 5 years
Variable rate debt less than 95%
This screen left us with just 8 BDCs:
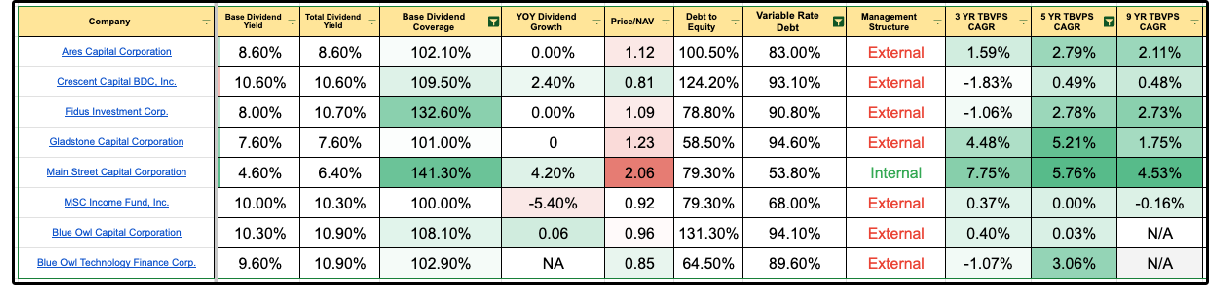
These BDCs are currently covering their dividends by generating sufficient NII, they are growing intrinsic value (TBVPS), and are less exposed to lowering interest rates.
However, we can see 4 of them are trading at a slight premium:
Ares Capital P/NAV: 1.12
Fidus Investment P/NAV: 1.09
Gladstone Capital P/NAV: 1.23
Main Street Capital P/NAV: 2.06
For example, it’s easy to see why Main Street Capital trades at the highest premium.
They’ve grown TBVPS faster than anyone, have the lowest variable rate debt, high dividend coverage, and are even internally managed, meaning that management payment structure is tied to the performance of the BDC, aligning management with shareholders.
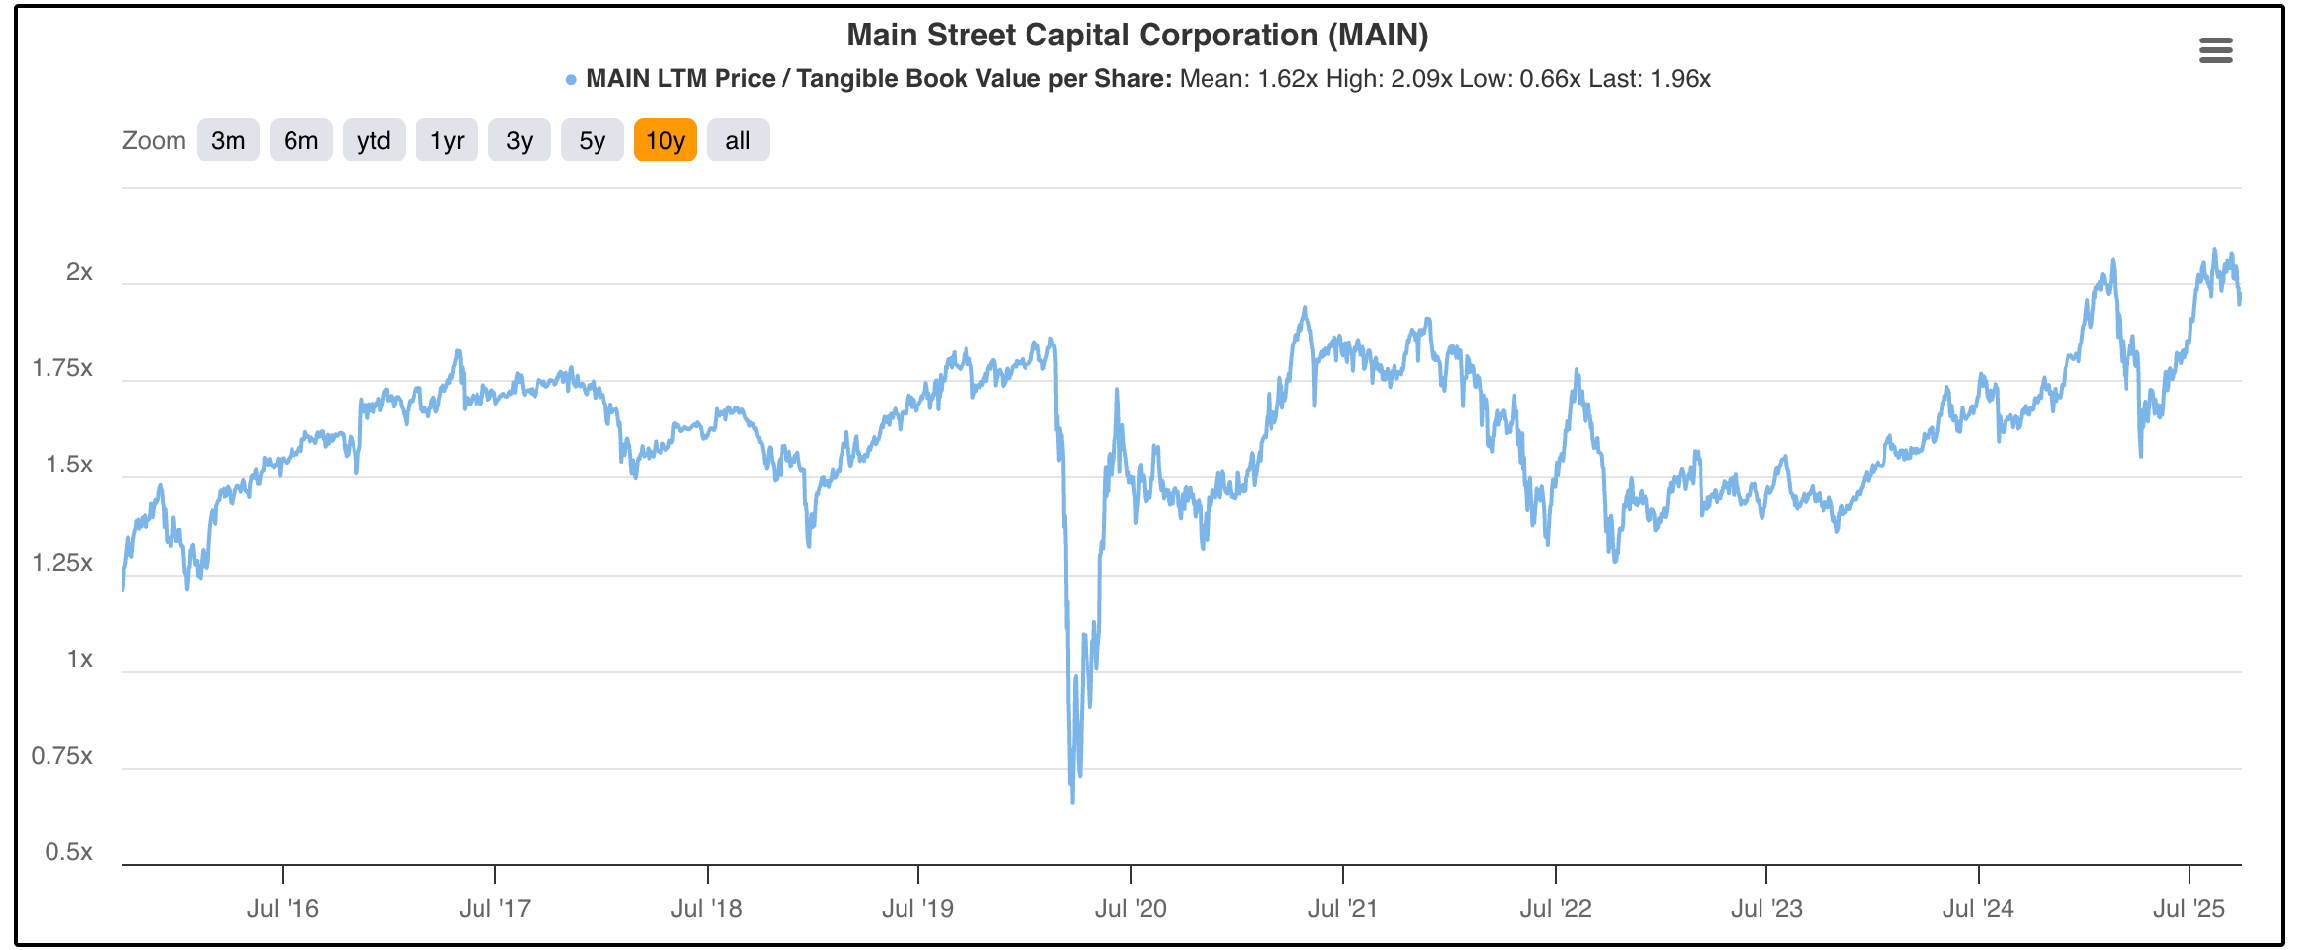
But they are now trading at one of their highest P/TBVPS ratios ever.
Current: 1.96x
10 YR Average: 1.62x
The question we have to ask ourselves as we analyze these BDCs-
What type of premium are we willing to pay?
⚡ High Yield Portfolio
Earlier this month, we began the process of building out our real money Dividend Growth Portfolio and High Yield Portfolio.
Last week, we added our first position to the High Yield Portfolio that yields over 9% and grows dividend payments.
In the coming weeks, we will be adding more positions, with one of them being a BDC in our database.
If you want to be a part of the process of building these portfolios and also get access to everything mentioned below, you can join here:
Here’s everything you’ll get as a paid Dividendology member 👇
📊 Full Access to the Dividendology Database
Built with over $10,000 invested in tools and research, this powerful database tracks dividend stocks and alternative income assets like Covered Call ETFs, REITs, and BDCs.📈 The Dividend Growth Portfolio
A real-money portfolio built from scratch, focused on long-term wealth creation and building a rapidly growing stream of dividend income💸 The High Yield Portfolio
A real-money portfolio, designed to generate massive sustainable income with an average yield of 8%+📉 Running List of Undervalued Dividend Stocks
Updated regularly — stay ahead with a curated list of the most attractively valued dividend opportunities in the market🧠 In-Depth Research & Reports
Deep dives into dividend stocks and income strategies you won’t find on mainstream platforms
Check out these resources:
Tickerdata 🚀 (My automated spreadsheets and instant stock data for Google Sheets!)
Interactive Brokers 💰 (My favorite place to buy and sell stocks all around the world!)
Seeking Alpha 🔥 (Now currently running their Summer sale ($30 off! + 7 day free trial)
The Dividend Report 📊 (Free Newsletter for Straightforward Dividend Stock News)
My money's on Main Street Capital or Fidus Investment as the High-Yield Portfolio contenders.
What do you think generally about internally managed vs externally managed BDCs and especially how this aligns with shareholder interests (or not)?