
📊 Generating BIG Dividends With REITs!
The Top 13 REITs Revealed! 💎

It’s typically not difficult to identify trends when it comes to investing.
Think of some of the historical trends over the past couple of centuries:
1848 California Gold Rush
The 2nd Industrial Revolution around 1900
The Internet Boom in the 1990s
The AI Rush Right Now

Investors have historically been quite good at realizing the impact these trends would have on the economy and stock market in general.
However, they’ve been incredibly bad at capitalizing on these trends.
Most people who moved to California in hopes of striking gold found nothing, and most who invested during the internet boom were wiped out during the dot com bubble.
📊 The REIT Trend
Did you know we are currently in the midst of a REIT trend?
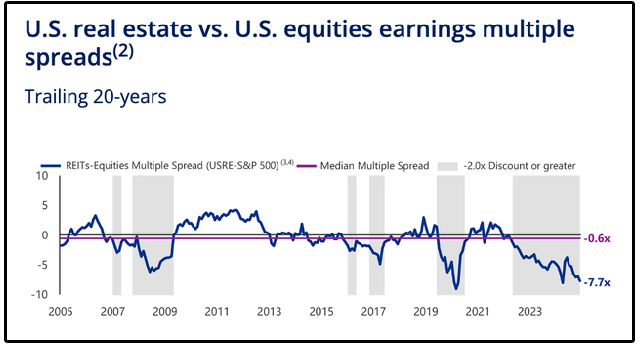
When REITs have traded at a discount of -2.0x or greater to U.S. equities, the average forward returns have been impressive:
1 year later: +25.6% for REITs vs. +21.0% for U.S. equities
2 years later (annualized): +18.7% vs. +12.7%
3 years later (annualized): +13.9% vs. +12.8%
But Today?
They’re trading at a 7.7x discount, which is one of the steepest discounts in history.
It’s easy to spot this trend, but how can we actually take advantage of this information?
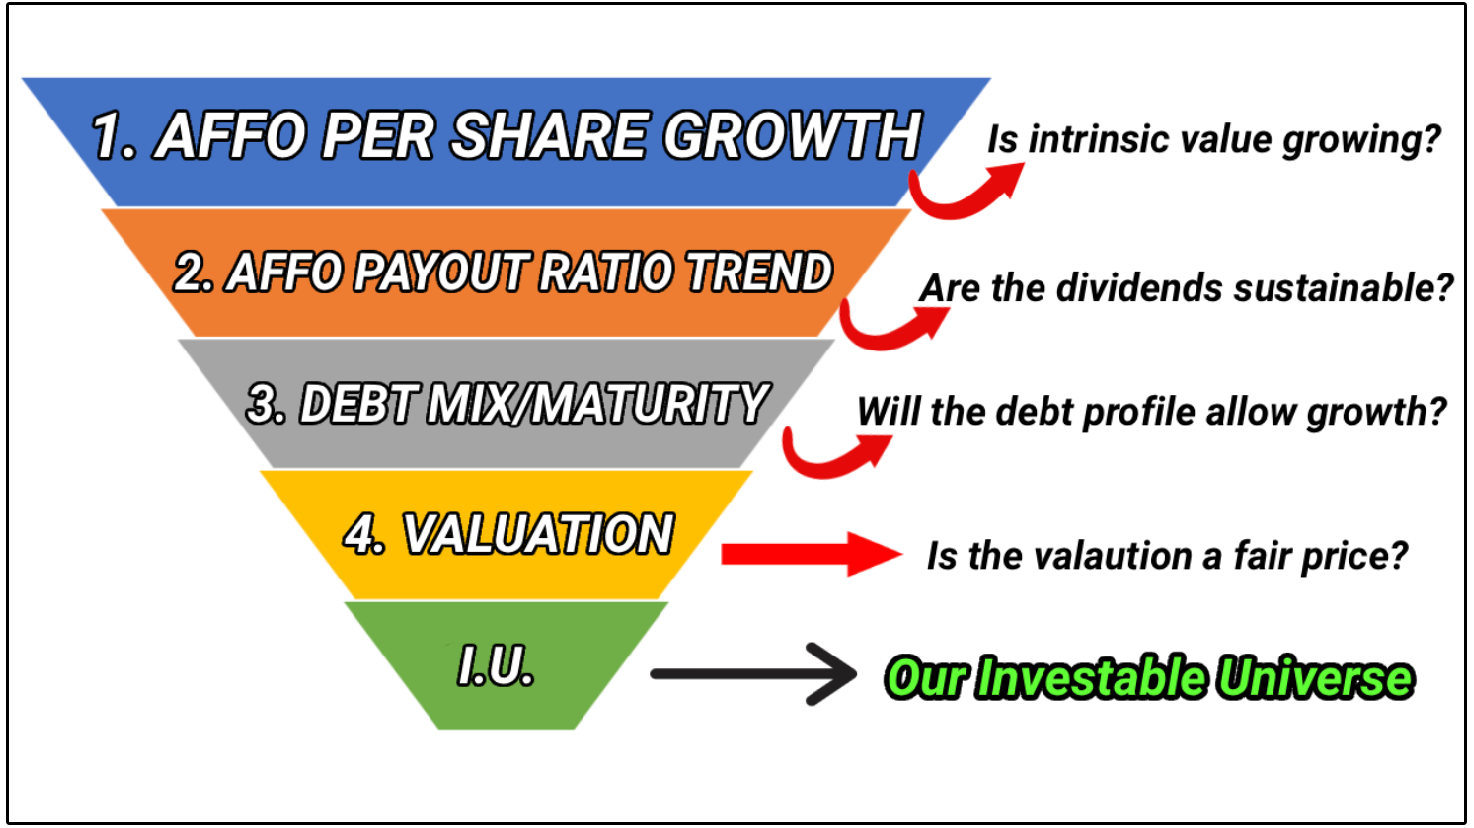
🏢 Creating a REIT Investable Universe
The idea of creating an ‘Investable Universe’ makes it incredibly easier to identify opportunities.
An investable universe is simply the full set of assets you’re willing and able to invest in based on your strategy, rules, or constraints.
For example, there are plenty of bad REITs out there.
To take advantage of REITs trading at a discount, we need to filter out the bad ones from the ones with potential.
To do this, we will turn to the Dividendology REIT Database.
📌 Dividendology REIT Database
The Dividendology Database is available for members of Dividendology.
But today, I’m sharing a portion of it with everyone.
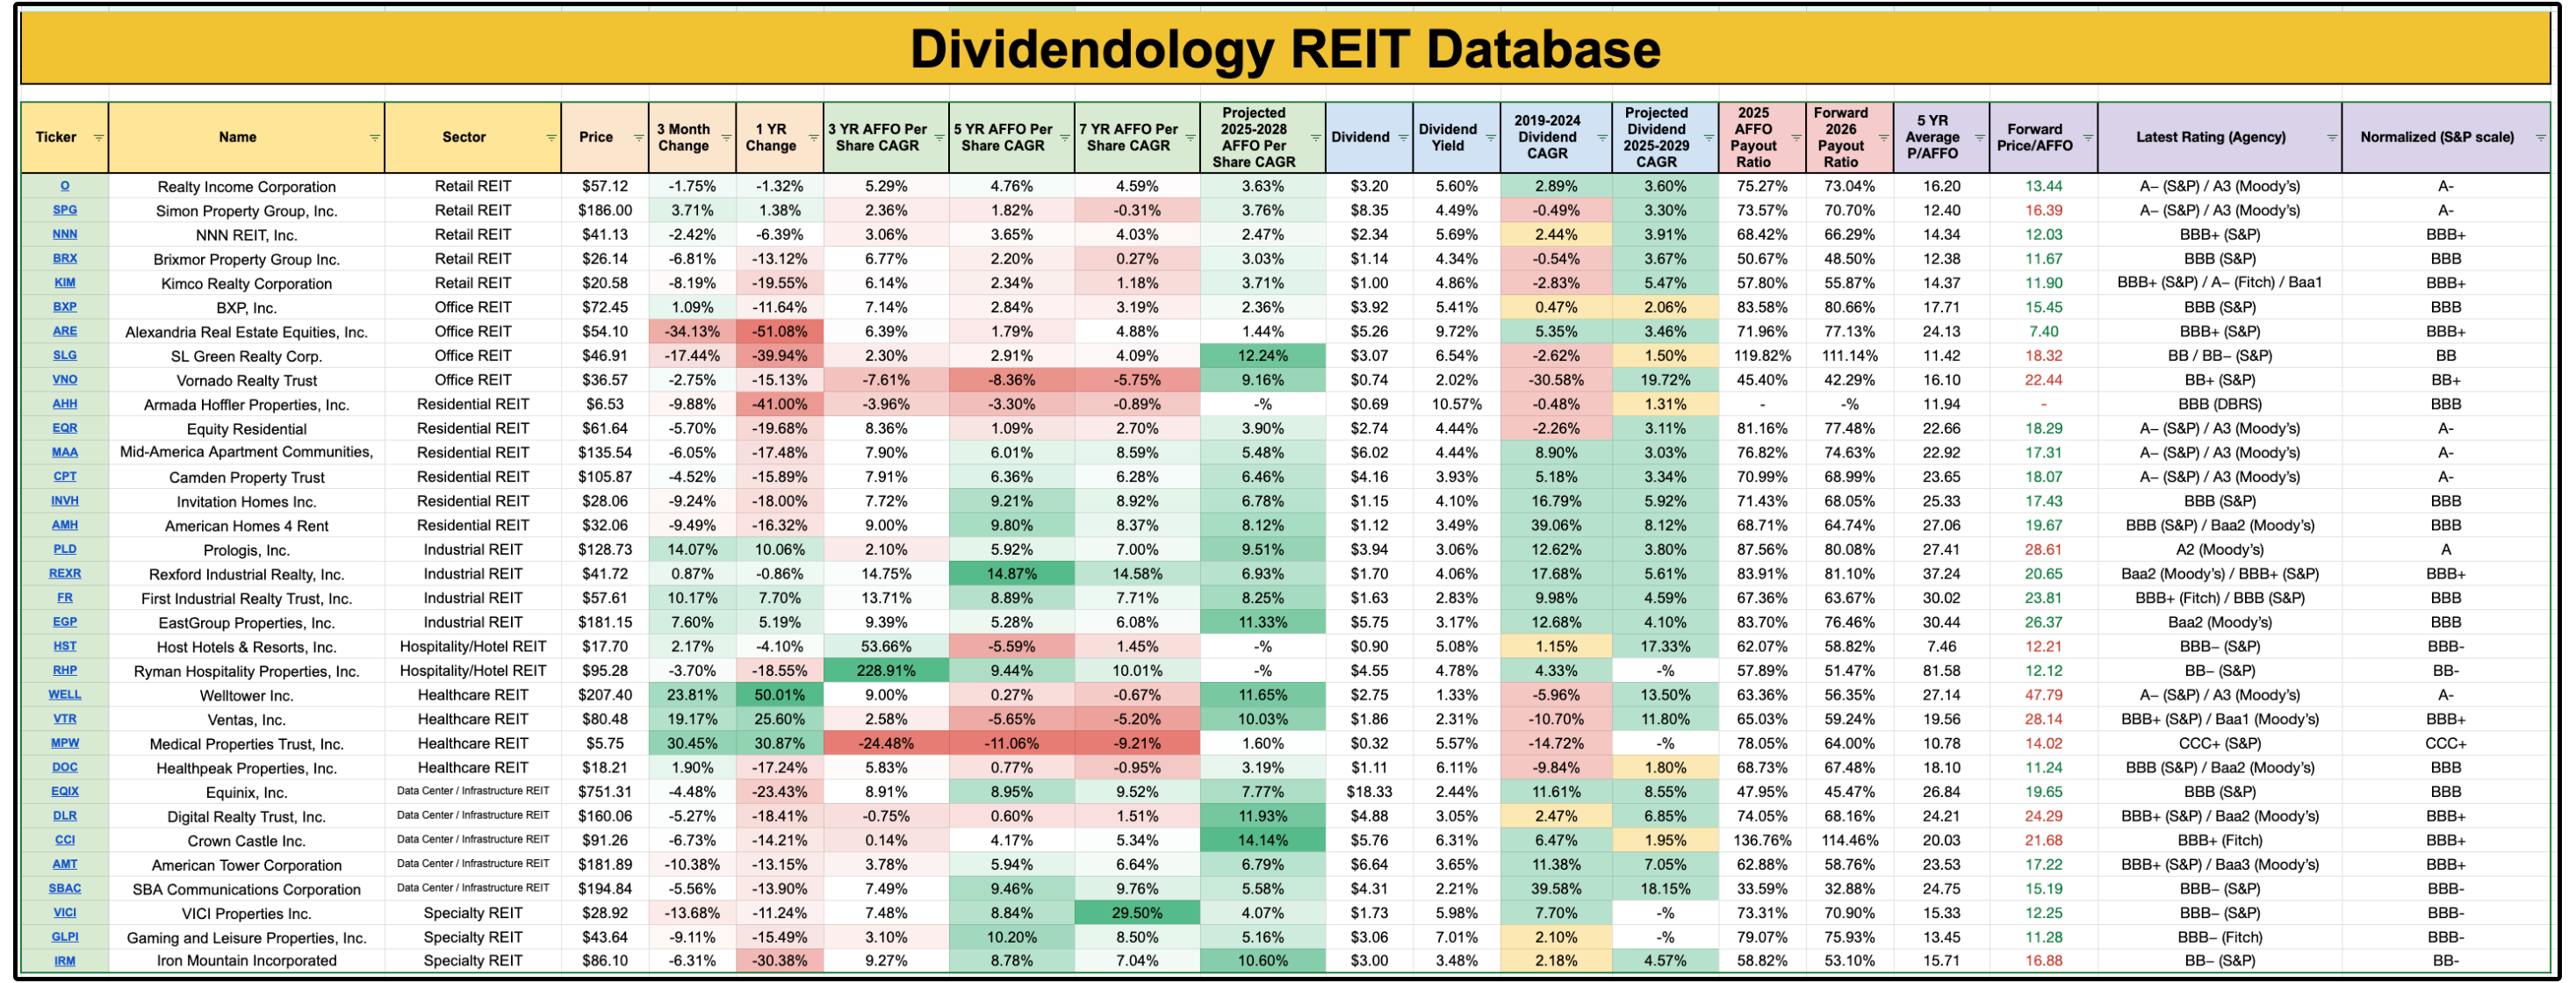
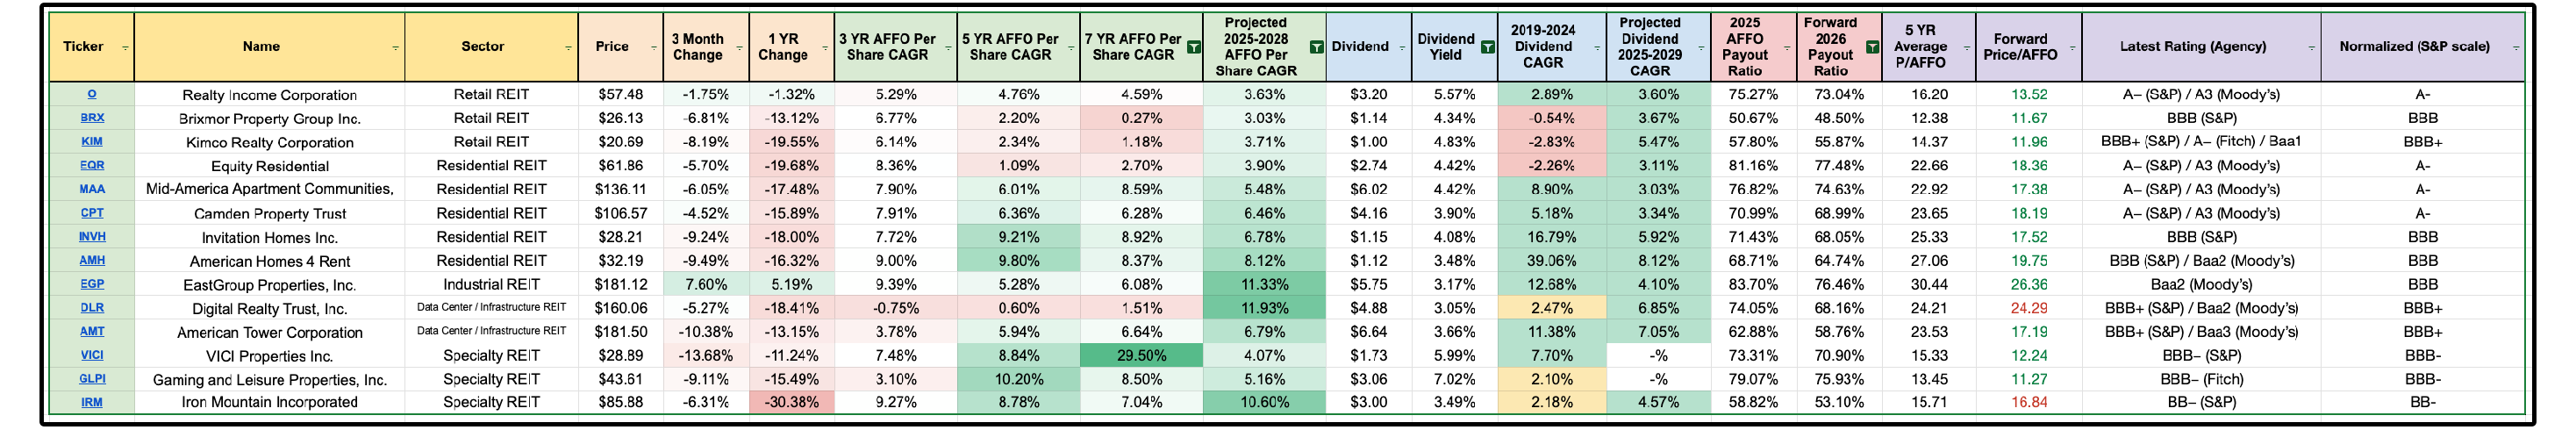
There are currently 33 REITs being tracked in the REIT Database.
Let’s see if we can use our investable universe screen to narrow this down.
We want to look for REITs that are fundamentally strong, so to start, we look for AFFO per share growth.
🗂️ 1. Growing AFFO Per Share
When we want to see if a stock is growing intrinsic value, we see if they are growing free cash flow.
When we want to see if a BDC is growing intrinsic value, we see if they are growing tangible book value per share.
And if we want to see if a REIT is growing intrinsic value?
We see if they are growing adjusted funds from operations per share.
AFFO per share is the ultimate metric for REITs.
Let’s filter out all REITs that do not have positive AFFO per share growth over the past 7 years AND filter out any REIT not projected to grow AFFO per share at at least 3% annually moving forward.
All of a sudden, we went from 33 REITs down to 21.
💸 2. Growing Dividends
The majority of people investing in REITs are buying them for their high yields.
So naturally, we need to make sure those dividends are sustainable.
Let’s filter out all REITs that have a forward AFFO payout ratio of above 80% AND a yield of at least 3%.
Now, we are left with just 14 REITs.
📑 3. Balance Sheet Health
Finally, we must assess the health of the REITs balance sheet.
In reality, this would require analyzing things like:
Total debt vs. market cap
Secured vs. unsecured debt
Fixed-rate vs. variable-rate mix
Weighted average interest rate
Debt ladder
Leverage ratios
These are things I discuss in my 46 minute video on how to analyze REITs.
But since we’re simply running screens, we will use our credit ratings.
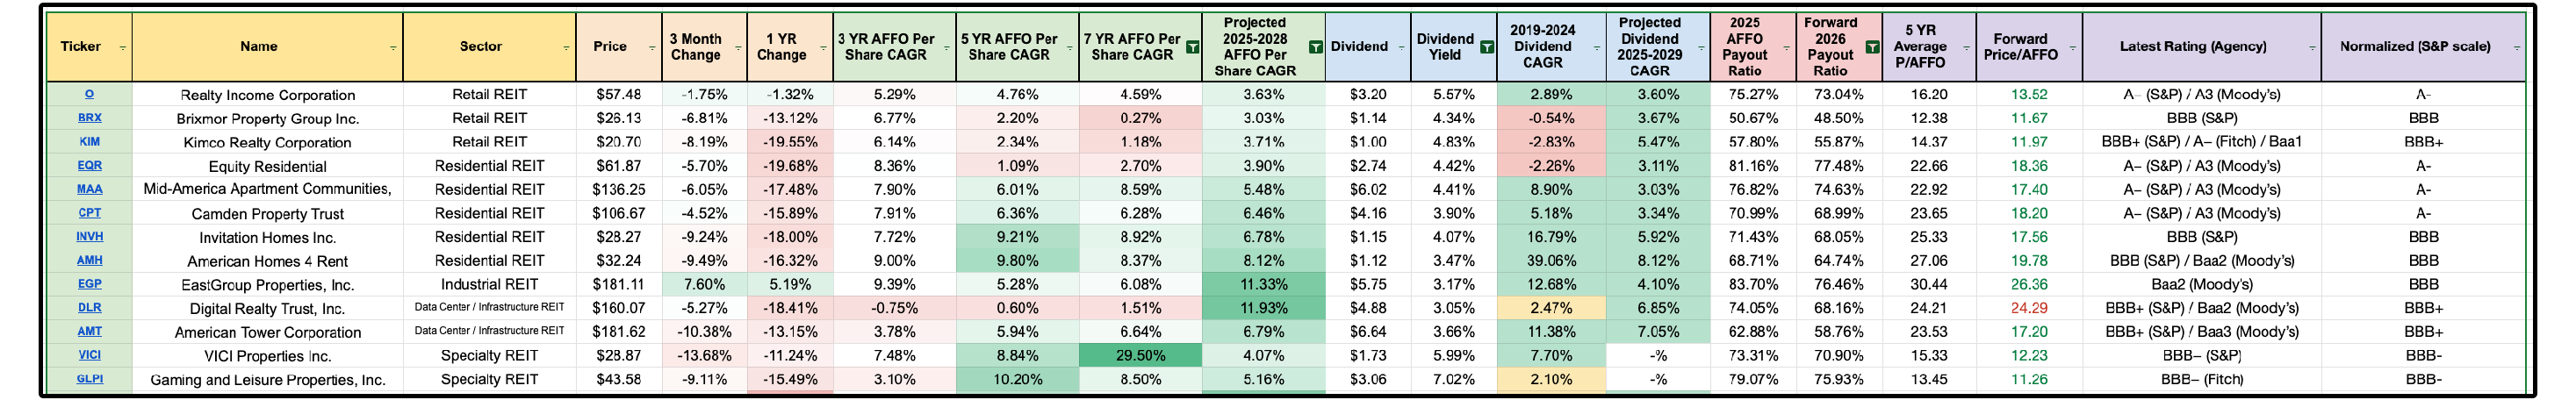
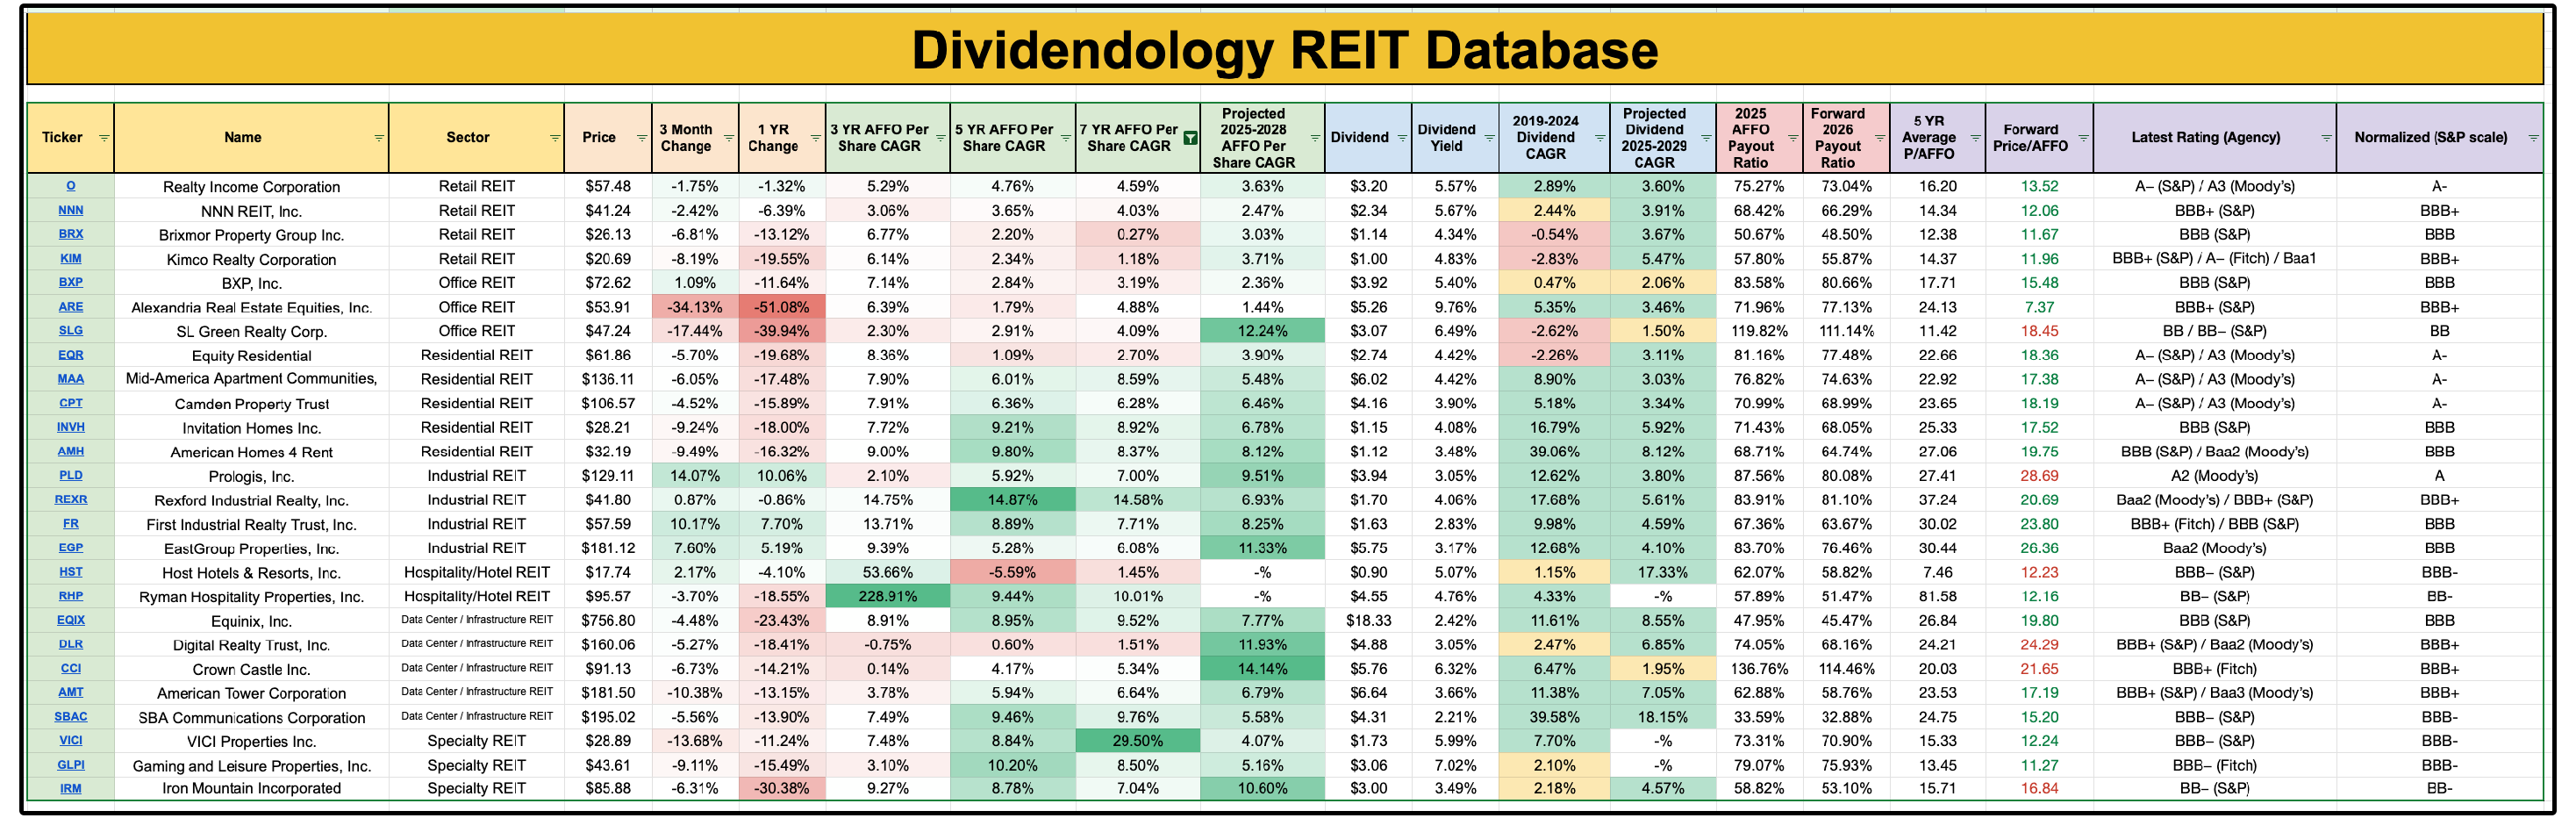
If we remove any REIT with a normalized credit rating of BB- or below, we are left with 13 REITs.
💥 4. Valuation
The last thing to assess?
Valuation.
Valuations for REITs have been so compressed, that there is only 1 REIT in our investable universe trading above its 5 year average P/AFFO per share multiple valuation!
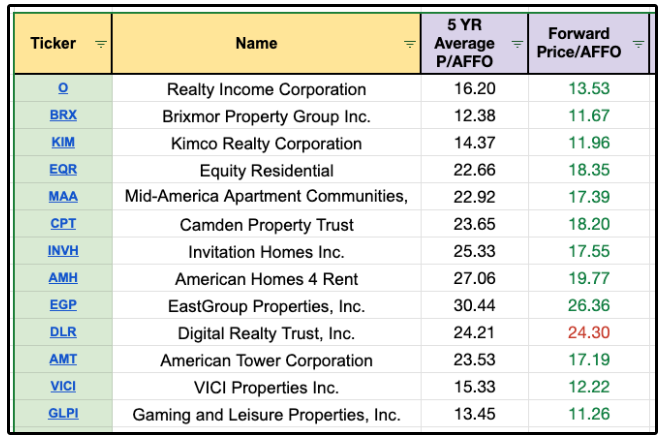
Obviously there is more to assess when it comes to valuations, and the rate at which they can grow AFFO per share heavily impacts the multiple that REITs deserve to trade at.
But with that being said…
It’s clear valuations are vastly more attractive now than they have historically been.
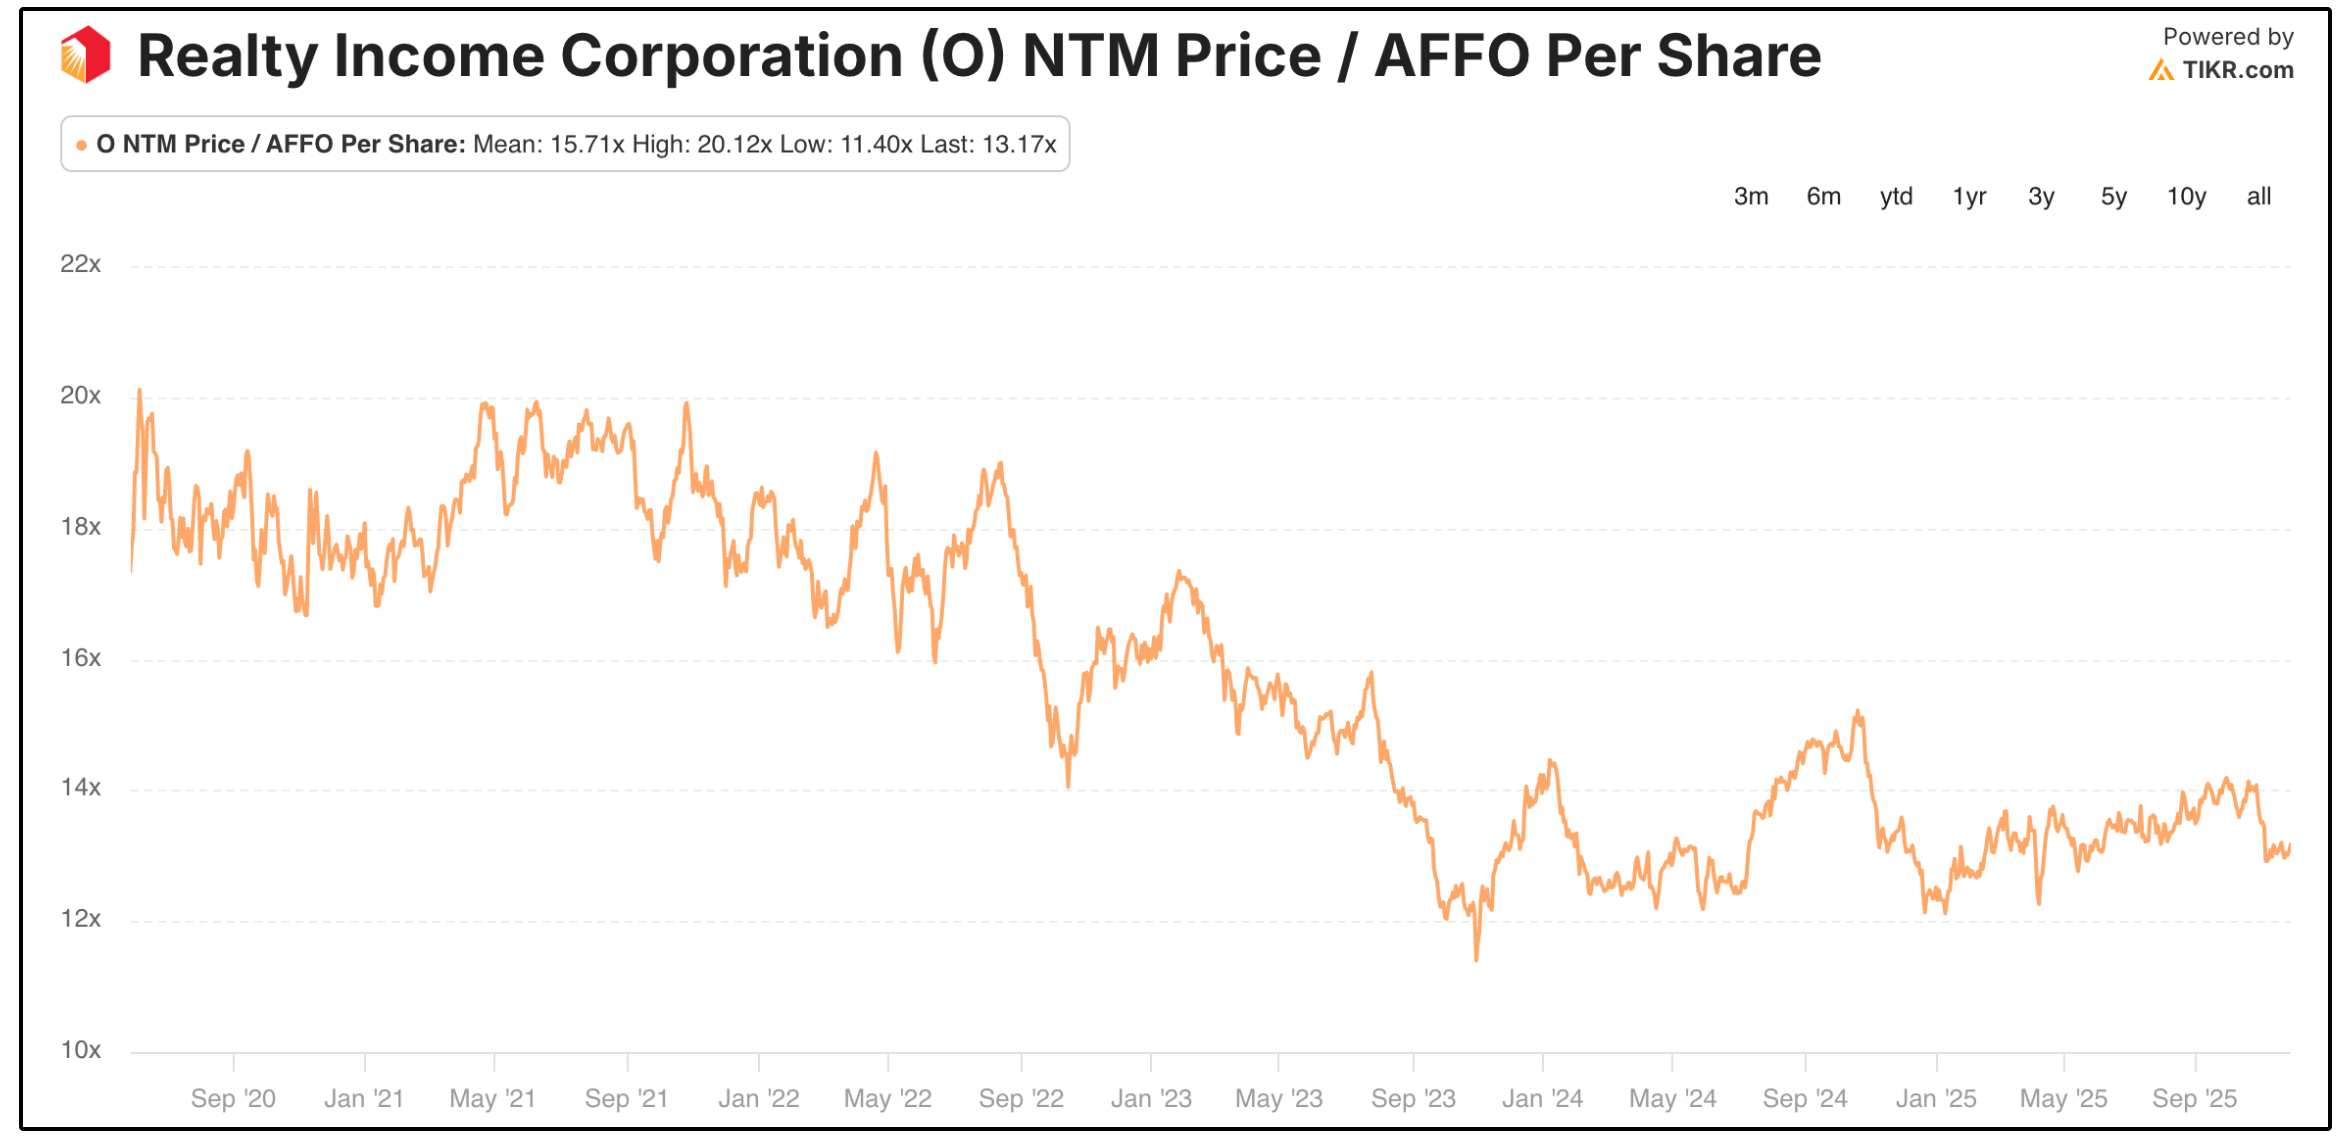
If we look at the most popular REIT on our list (Realty Income), we can see they are essentially trading at their lowest P/AFFO Per Share multiple in the last 5 years.
Current P/AFFO Per Share: 13.17x
5 Year Average P/AFFO Per Share: 15.71
10 Year Average P/AFFO Per Share: 17.41
🔑 Our Universe
With the help of the Dividendology Database, we were able to quickly spot where some of the best potential opportunities in the REIT market are by creating an investable universe.
The trends are easy to spot for most people.
Taking advantage of them is not always quite as easy.
Creating an investable universe removes roughly 80% of the work required.
As we continue to build out our Dividend Growth and High Yield Portfolios, we will filter out the weeds and look for quality.
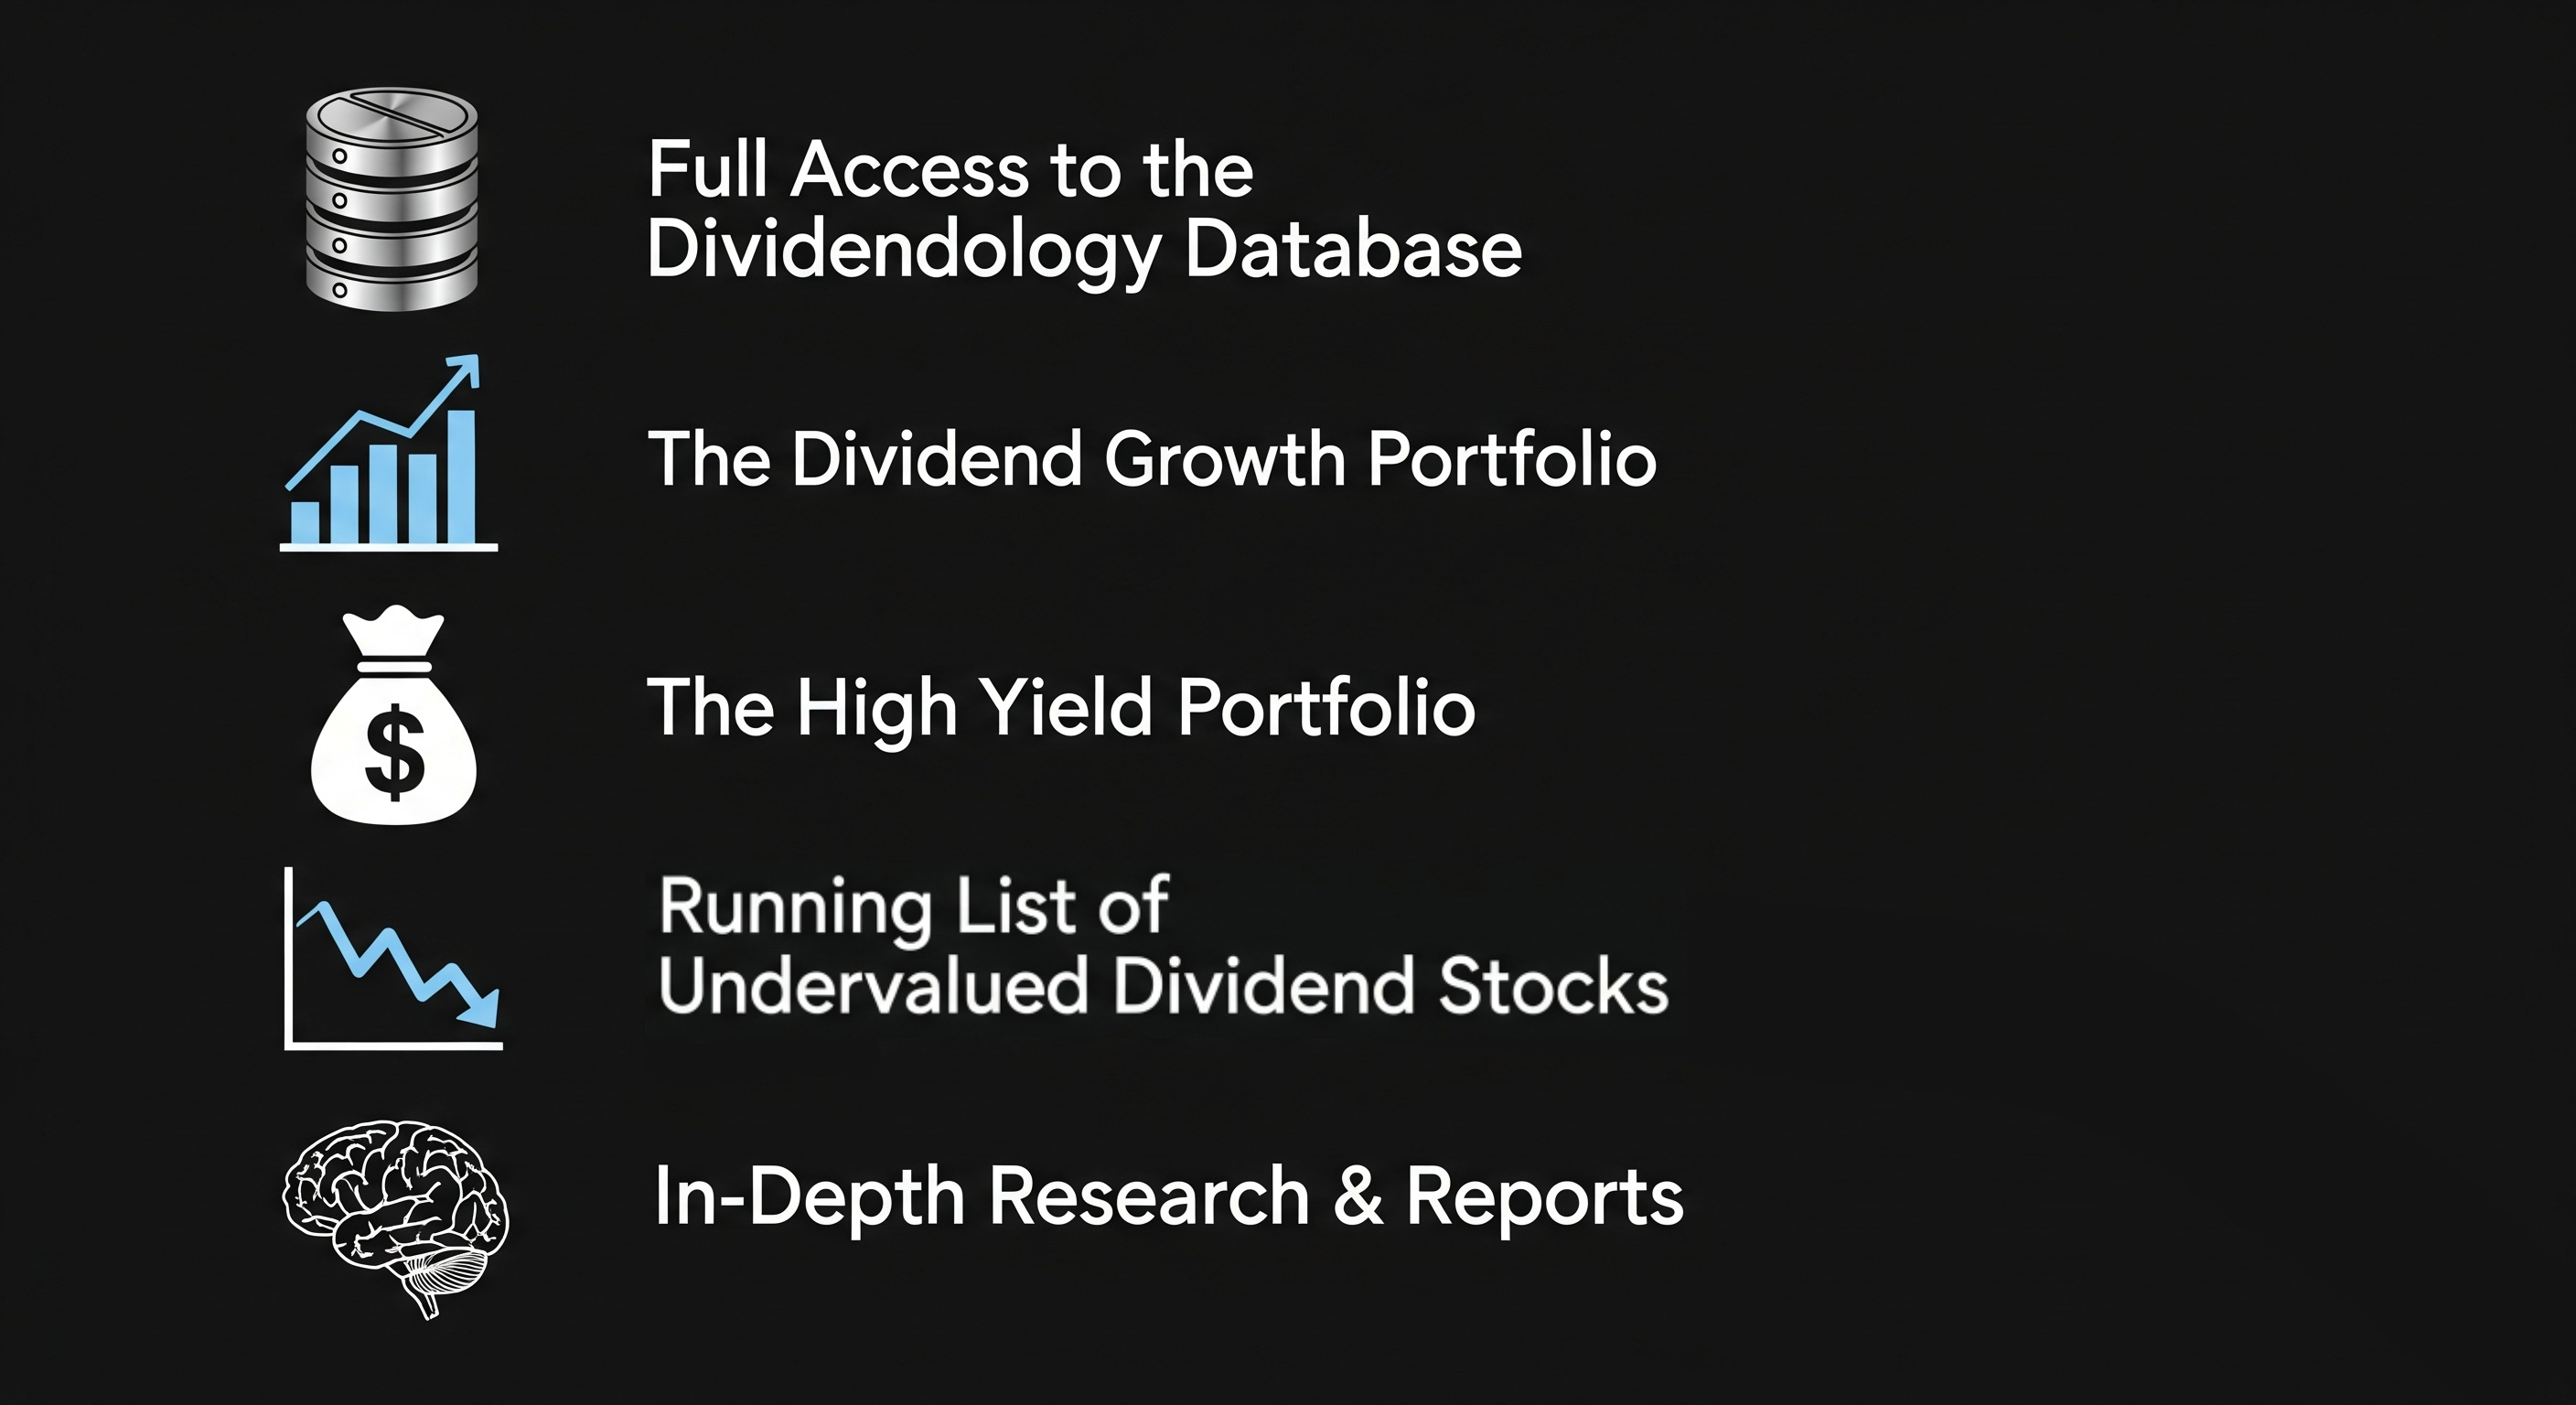
If you want to be a part of the process of building these portfolios and also get access to everything mentioned below, you can join here:
Here’s everything you’ll get as a paid Dividendology member 👇
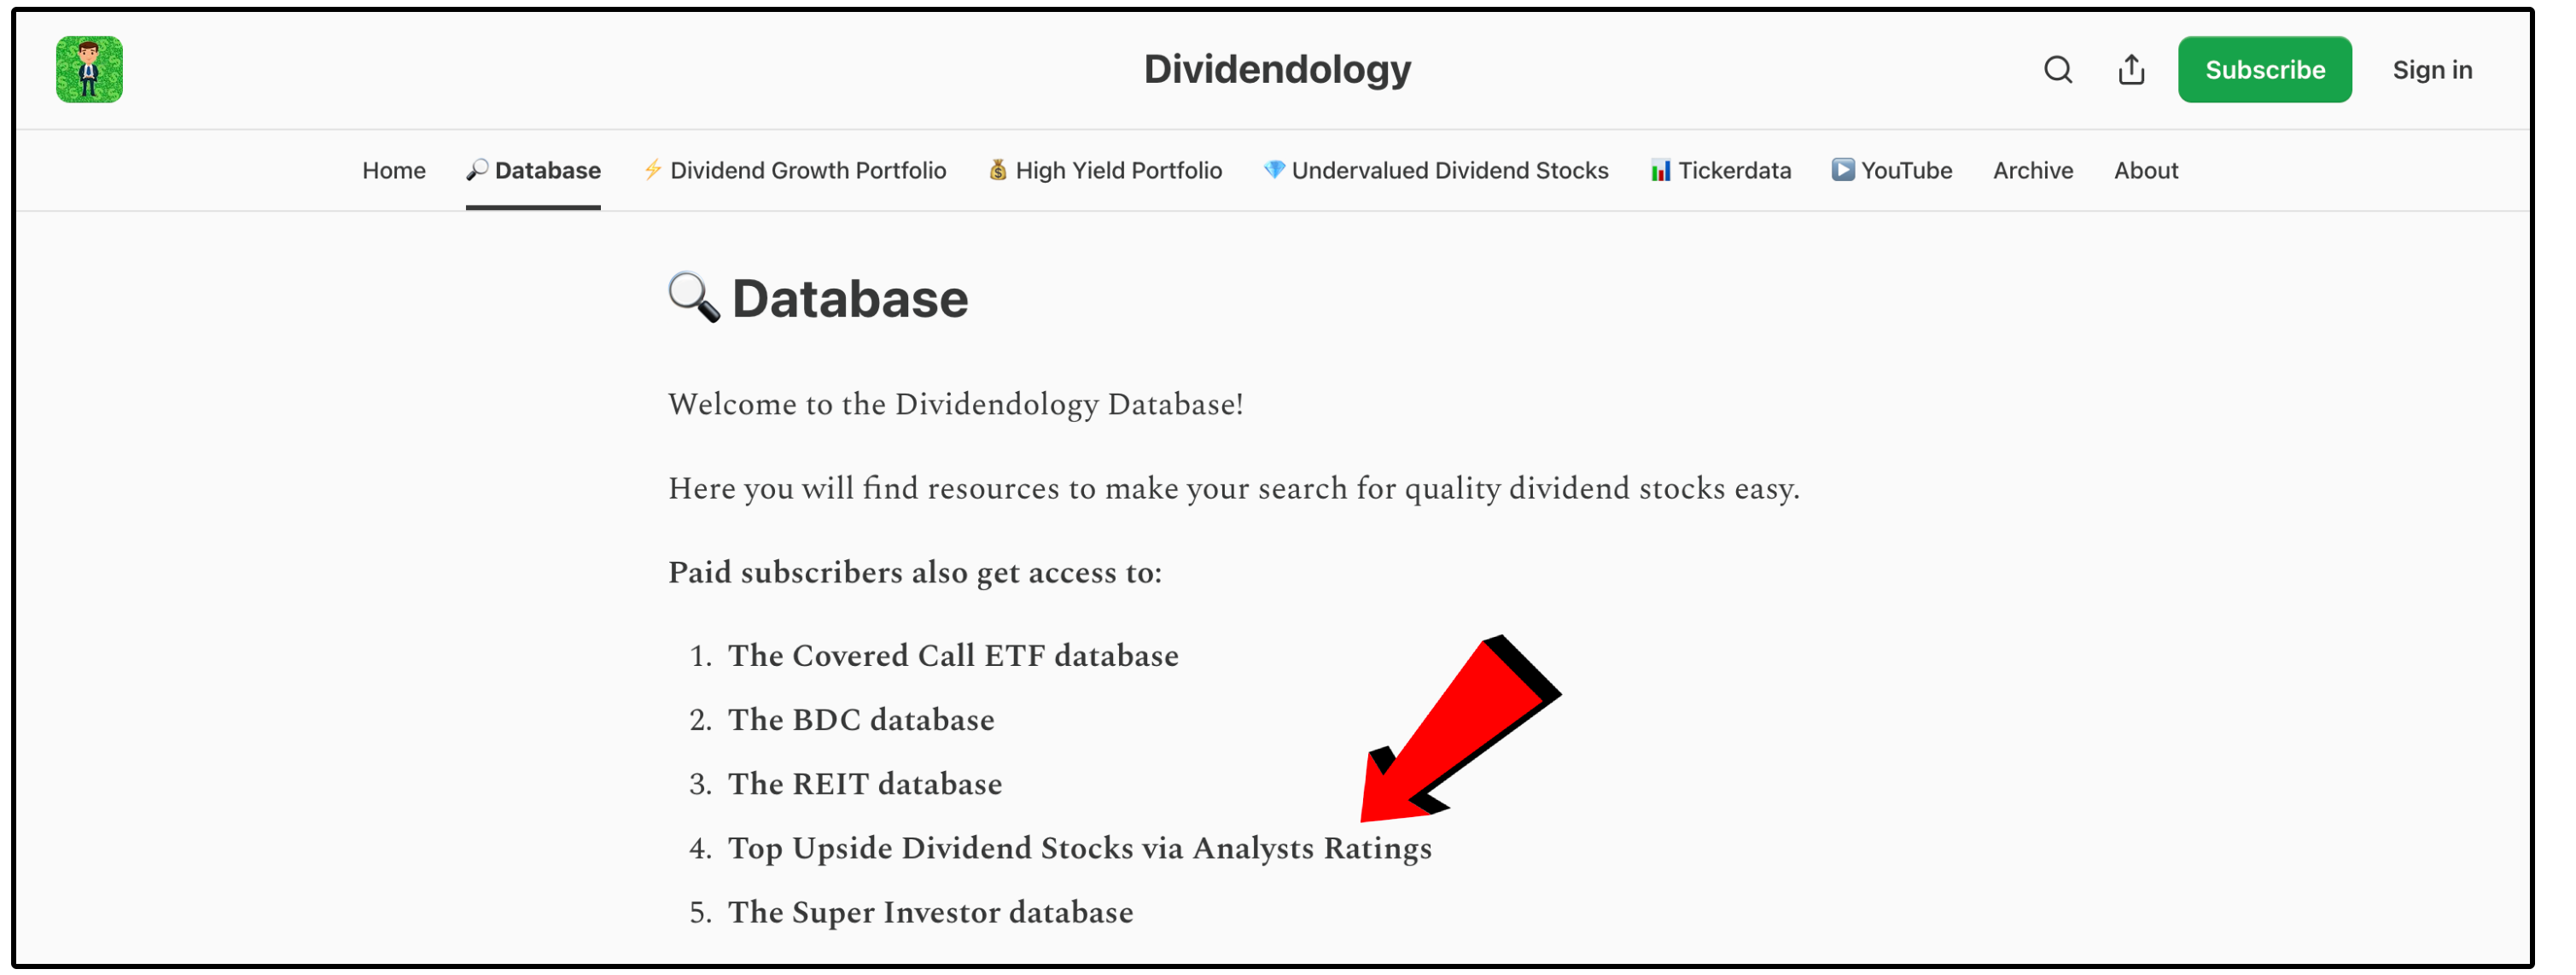
We just added a new feature to the Dividendology Database this week as well!
Every month, I compile a data on Wall Street price targets and compile it to bring you the ‘Most Upside Dividend Stocks via Analyst Ratings’.
Dividendology is continuing to grow.
The best is yet to come!
Check out these resources:
Tickerdata 🚀 (My automated spreadsheets and instant stock data for Google Sheets!)
Interactive Brokers 💰 (My favorite place to buy and sell stocks all around the world!)
Seeking Alpha 🔥 (Now currently running their Summer sale ($30 off! + 7 day free trial)
The Dividend Report 📊 (Free Newsletter for Straightforward Dividend Stock News)
I don't see ADC anywhere in your database. Why did you choose to ignore it?(or maybe its there but I missed it somehow)
I’m curious about PG. I’ve been watching them for a while. What are your thoughts on this stock?