

Despite recent volatility in the markets-
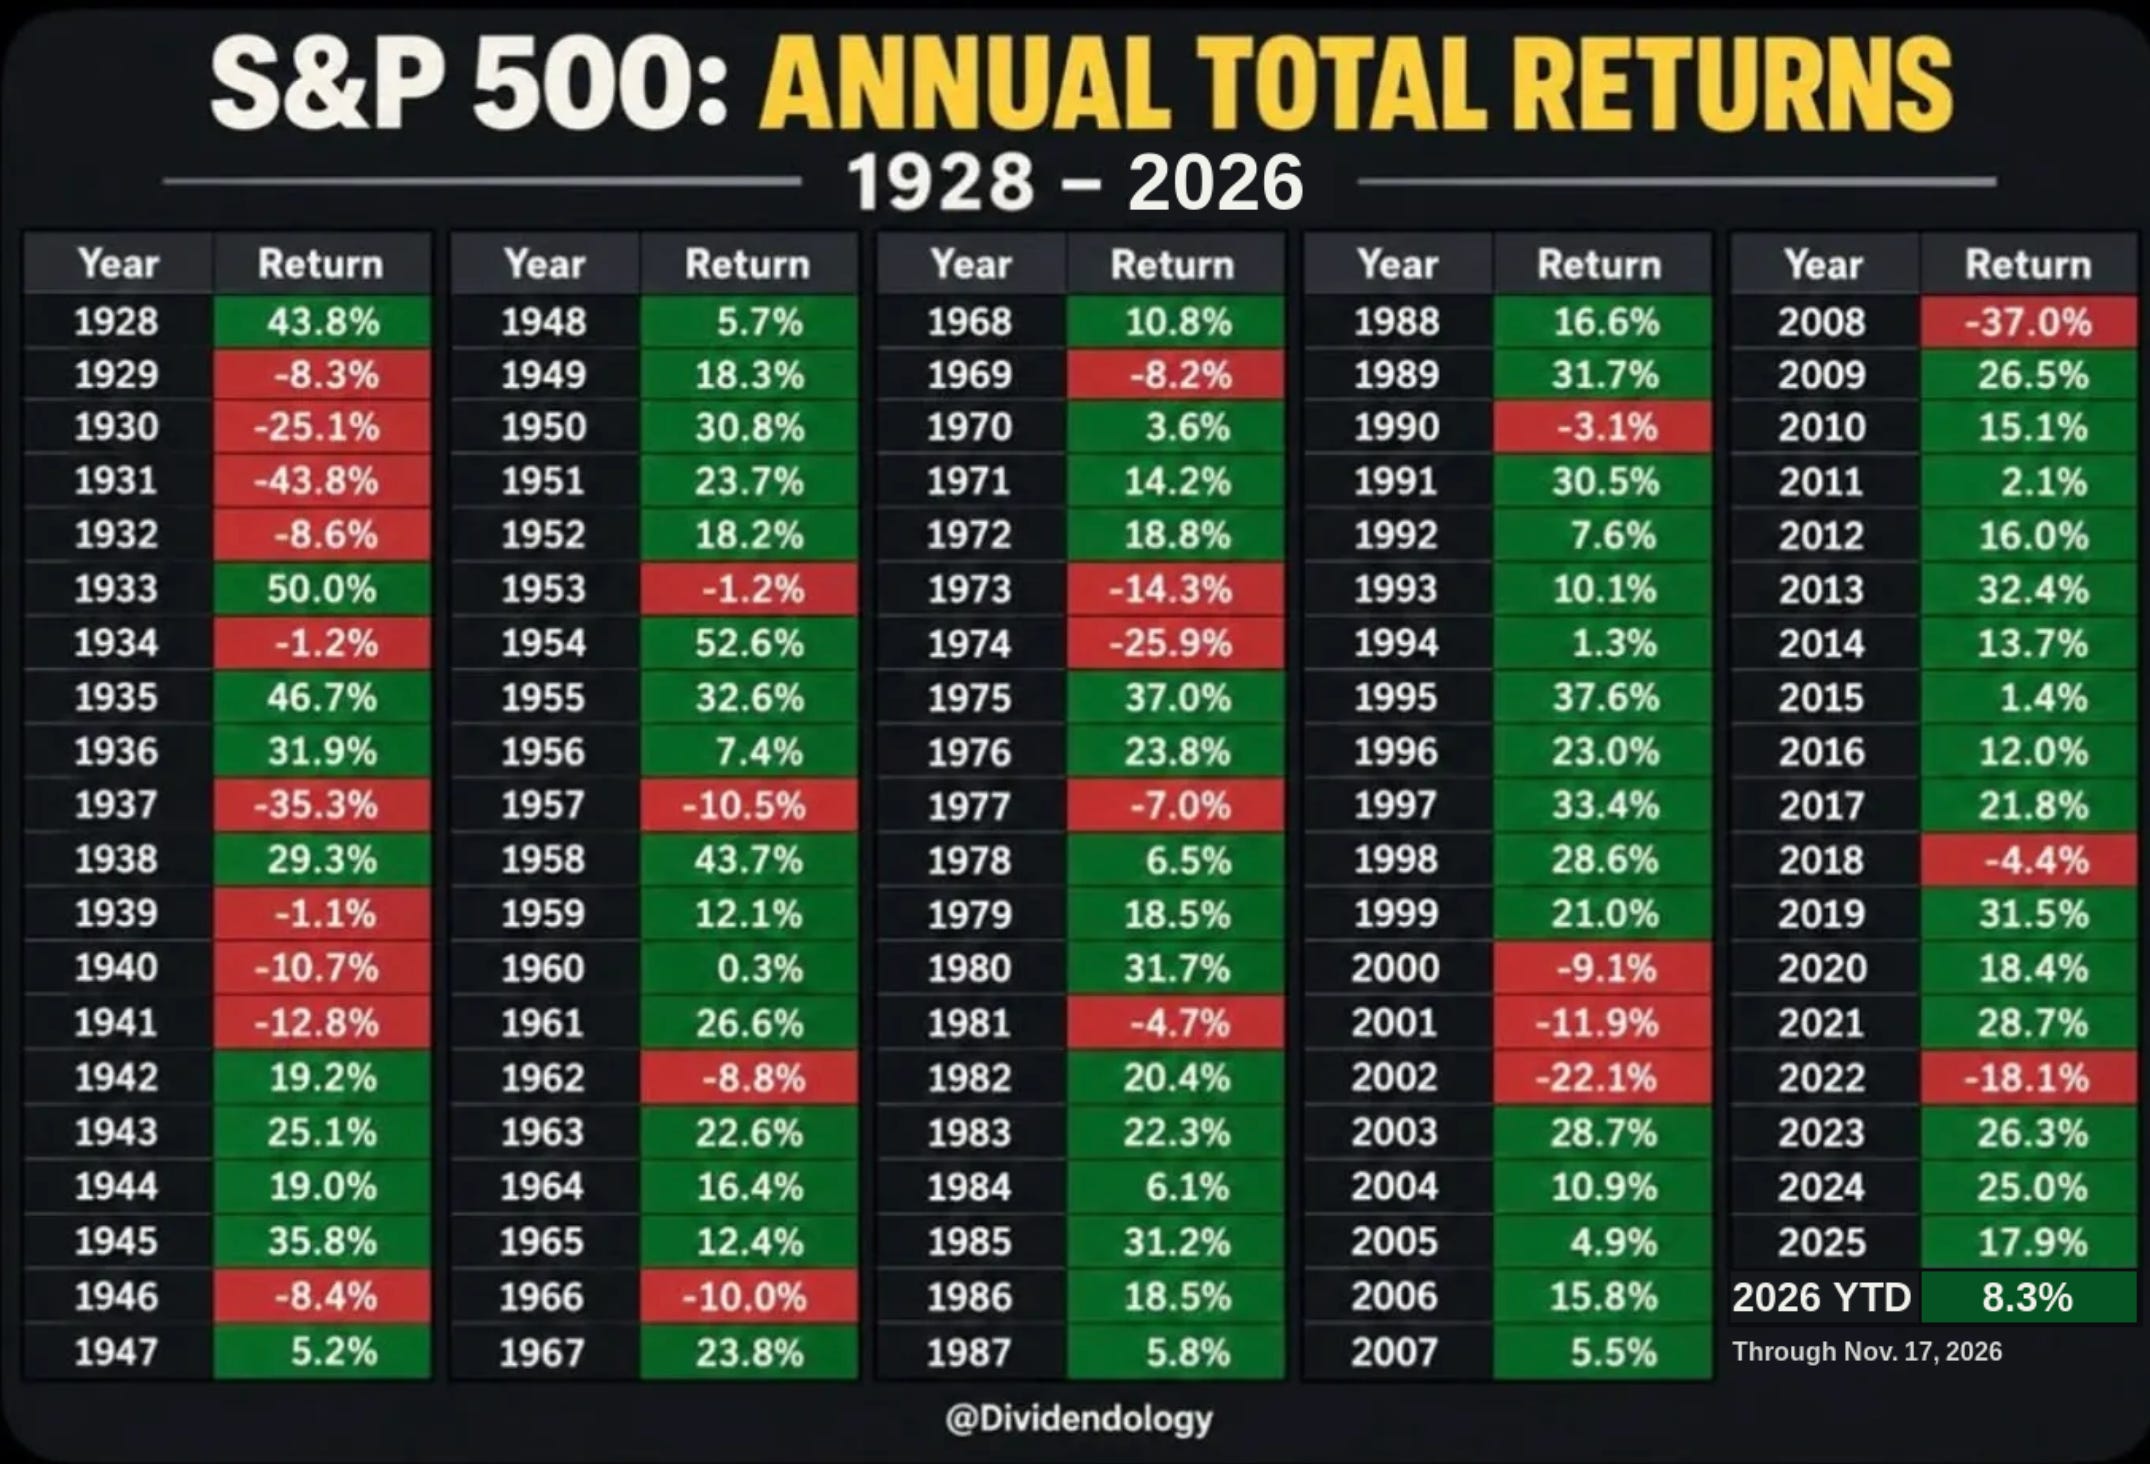
The S&P 500 is on the verge of posting it’s strongest four year run since the late 90’s.
And while we are still building out the Dividend Growth Portfolio here on Dividendology.com-
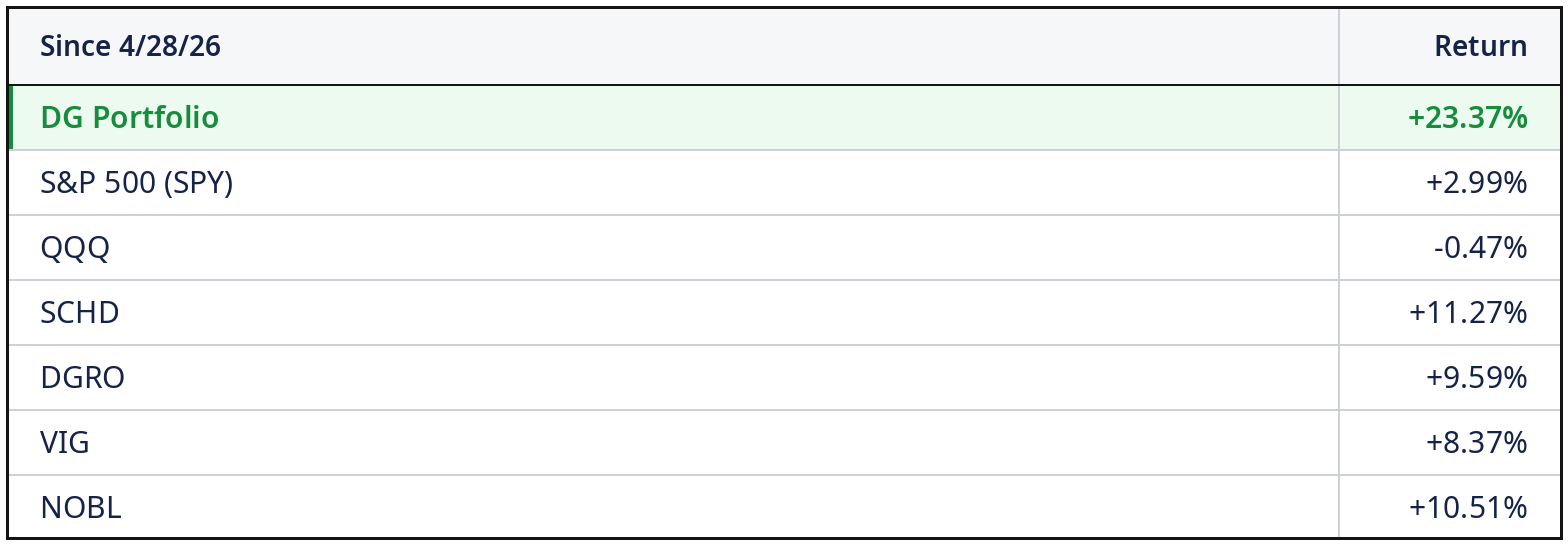
3 out of the 4 new additions we’ve made this year have outperformed the market…
Leading to our portfolio out performing year to date.
Most of this performance has come after Q1 of this year, with the portfolio outperforming significantly since the end of April.
Perhaps much more importantly though, the underlying fundamentals of our portfolio continue to be substantially stronger than that of the S&P 500.
2026 has been an incredible year for us.
With that being said…
We must continue to build out our portfolio with the fact that 2027 will likely look very different from 2026 in terms of the type of market environment we are operating in.
Goldman Sachs recently released its 2027 outlook for the stock market-
And I compiled the 6 key data points we must review.
Let’s dive in.
📝 Real Quick…Have You Heard The News?
On November 23rd (this Monday!)-
Dividendology is getting a major addition to the Dividendology Database.
Over the last year, we’ve built out:
The Covered Call ETF Database
The BDC Database
The REIT Database
Each database provides in depth information on these asset classes traditional investing softwares don’t provide.
Now, we’re adding a Midstream/MLP database this Monday!
This is one of the most exciting features we’ve launched in a long time.
Now back to Goldman Sachs 2027 outlook…
1. 📈 How Much Upside?
Goldman’s 12-month target for the S&P 500 is 8,700.
That implies roughly 14% of upside for the S&P 500.
That’s 16% upside including dividends.
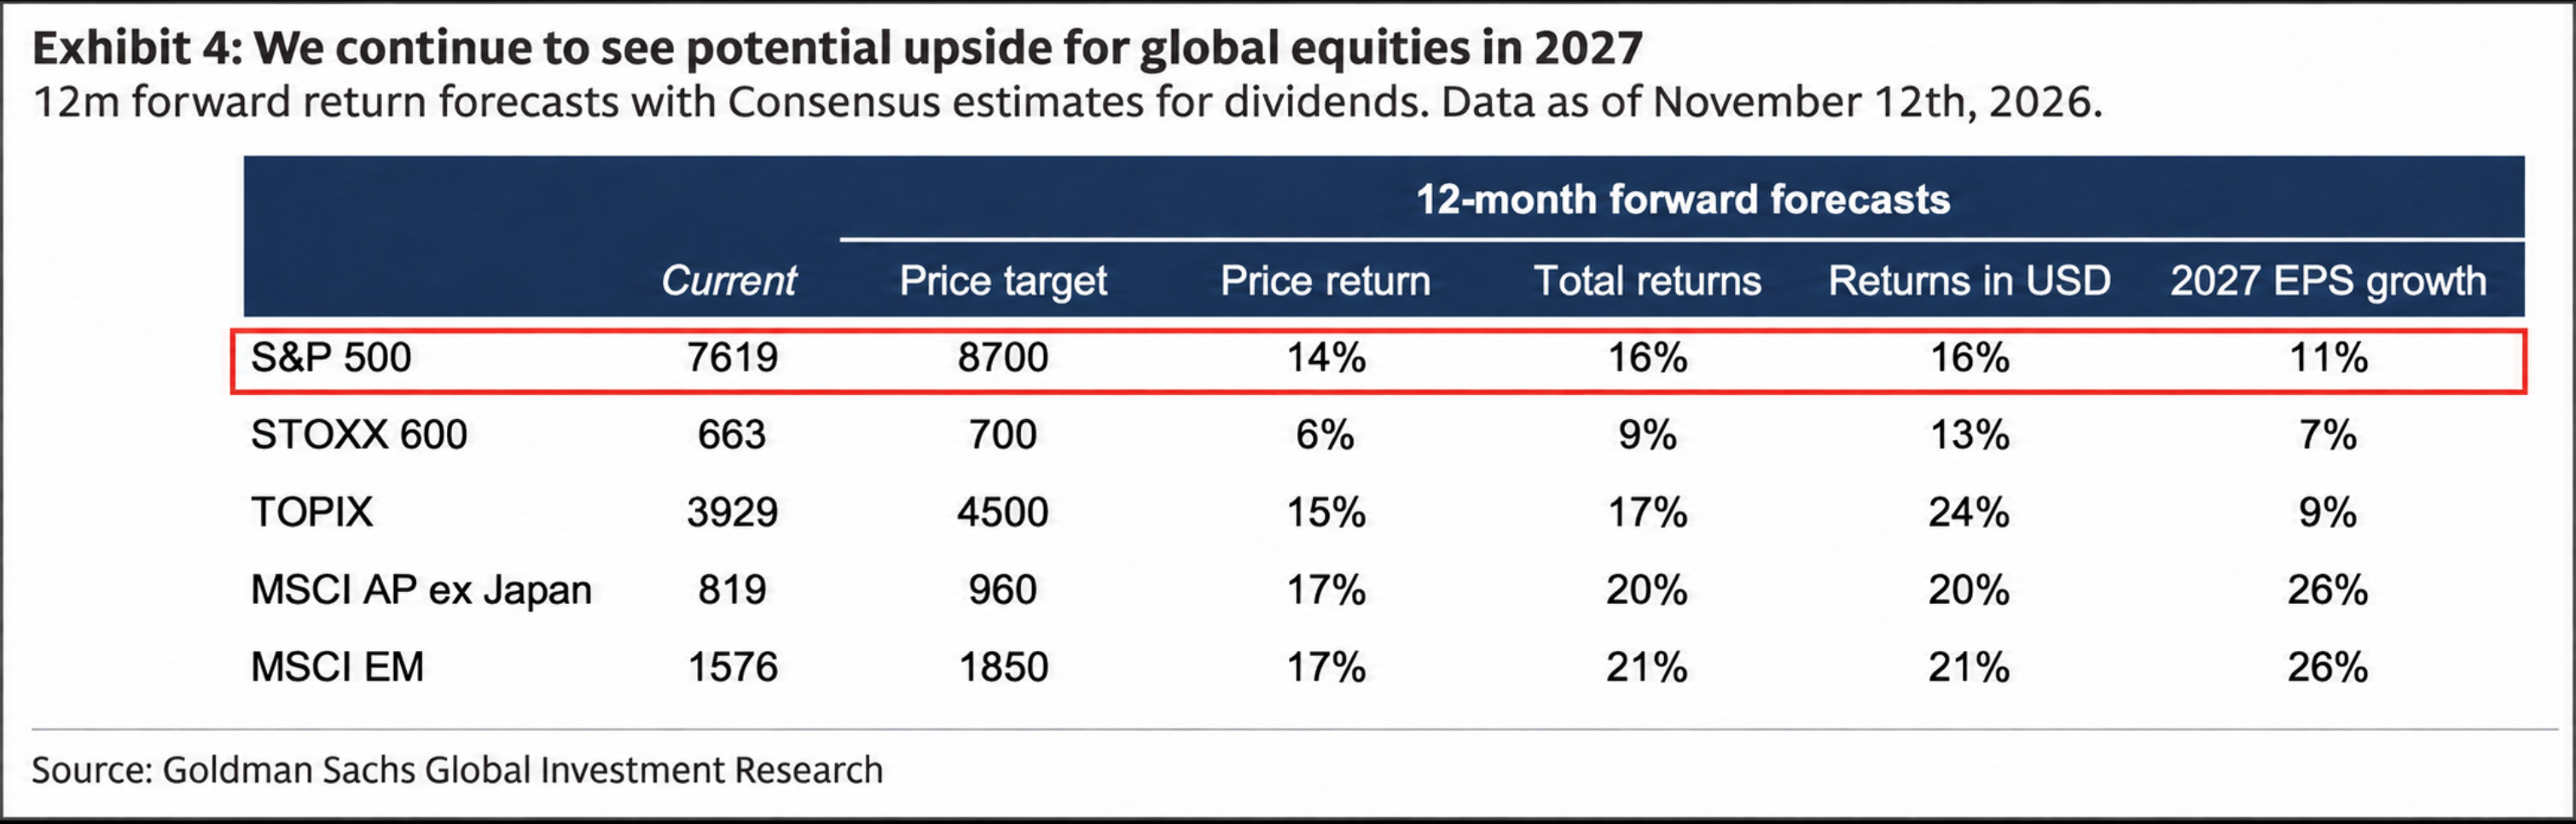
However, the sources of those returns are what’s interesting.
Remember, all market returns come from three potential sources:
Earnings per share growth
Multiple expansion
Dividends
Goldman expects 2027 EPS growth for the S&P 500, implying around 3% multiple expansion.
That’s a drastic difference from what happened with valuation multiples over the last 12 months across the world…
2. 🧮 Valuation Multiples
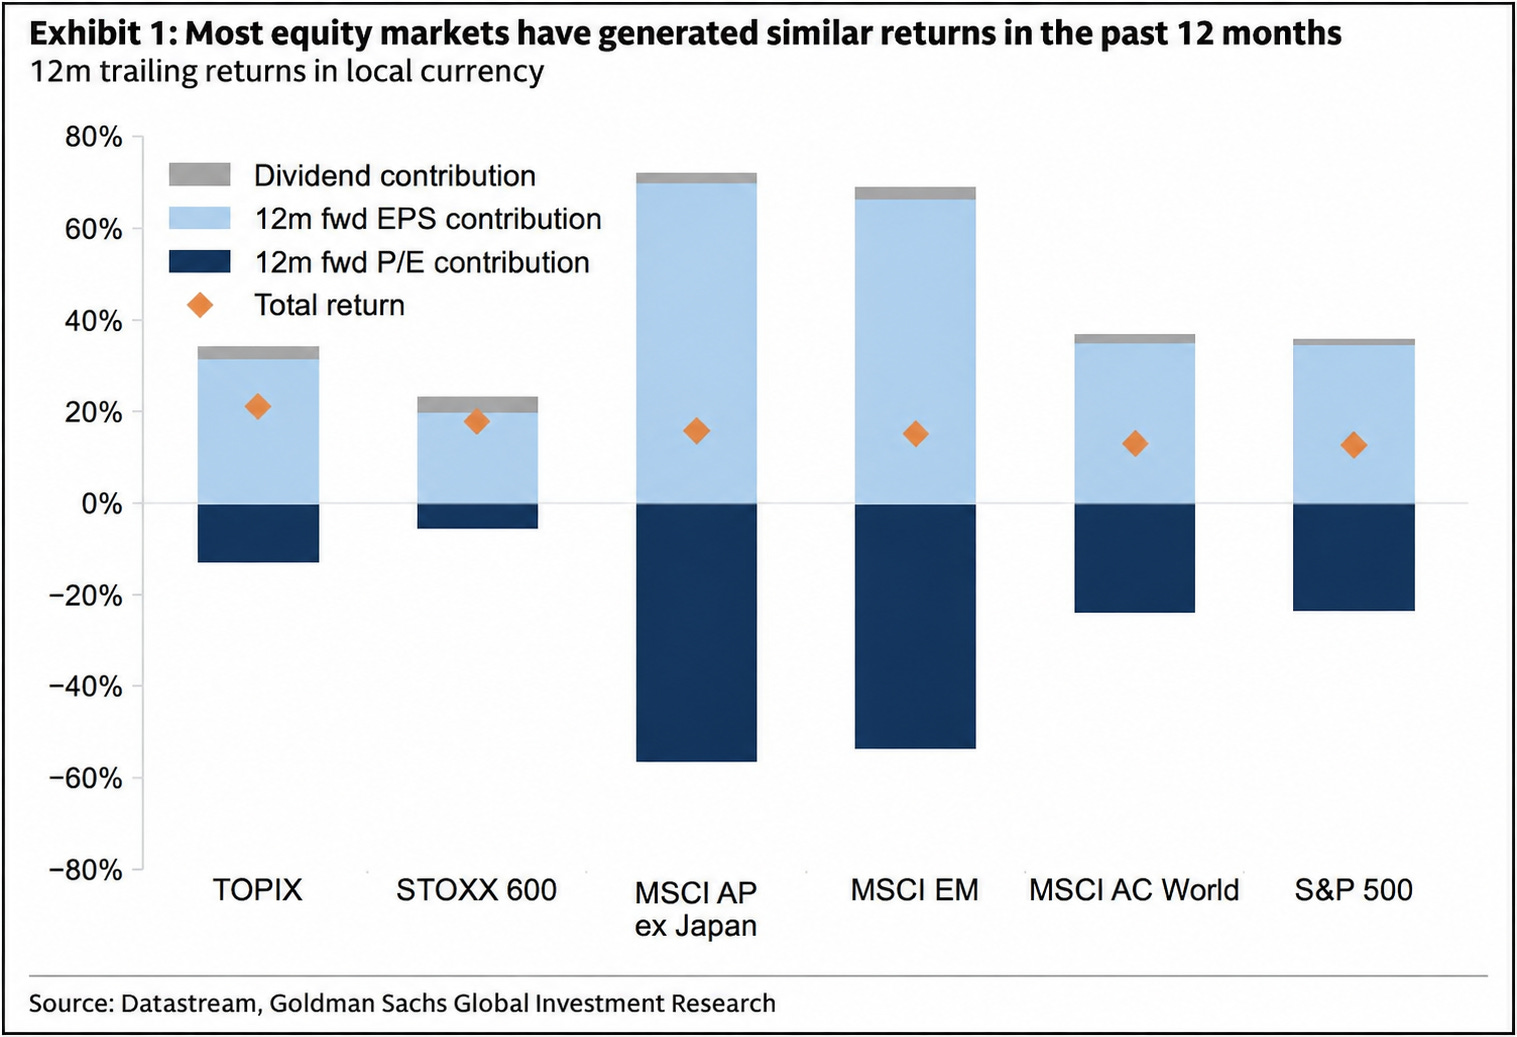
Japan, Europe, emerging markets, and the U.S. all posted double-digit returns over the past 12 months in local currency.
But valuations actually fell in every single market Goldman tracked.
In fact, the valuation multiple for the S&P 500 fell by over 20%!
Higher earnings expectations drove the gains.
But there’s a reason the valuation multiples across the world fell…
3. ⏳ Slowing Earnings Growth
The primary driver of a valuation multiple is the rate at which a stock or market is growing earnings-
And earnings growth is set to slow across the world.
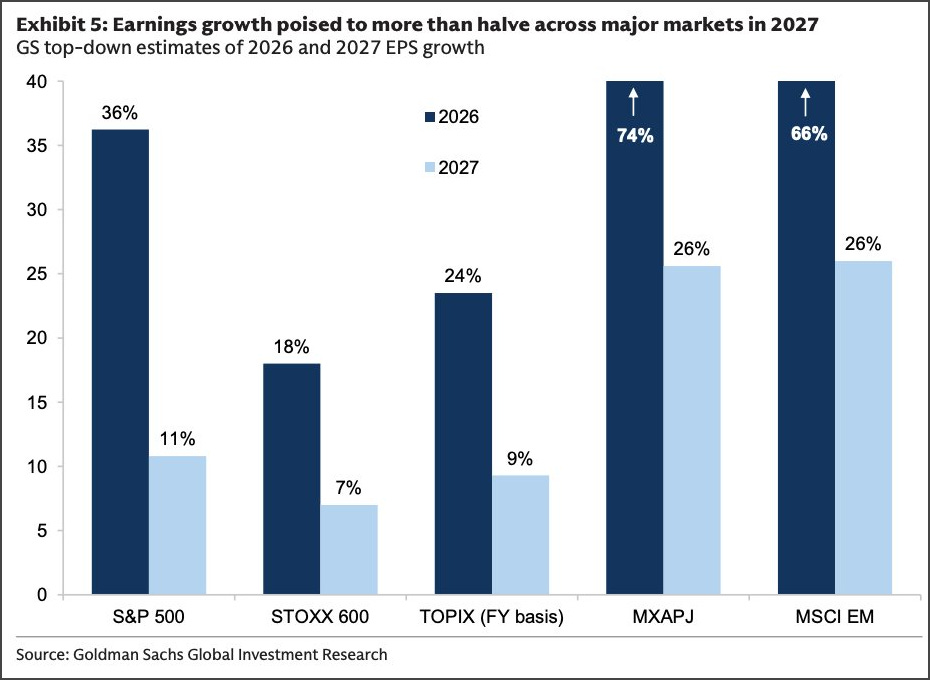
Goldman’s 2026 to 2027 earnings growth estimates:
🇺🇸 S&P 500: 36% → 11%
🇪🇺 STOXX 600: 18% → 7%
🇯🇵 TOPIX: 24% → 9%
🌏 Asia ex-Japan: 74% → 26%
🌎 Emerging markets: 66% → 26%
Every major market in the forecast sees its earnings growth rate more than cut in half.
4. ⚡ AI boom/doom
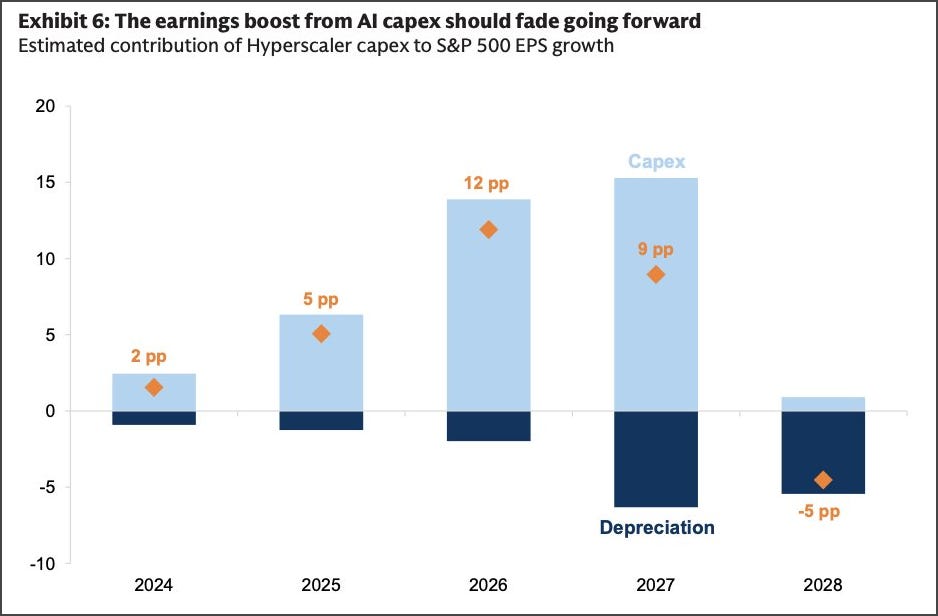
The AI spending boom will start dragging on earnings.
Goldman estimates AI infrastructure spending added 12 percentage points to S&P 500 earnings growth in 2026....
But it sees that net boost shrinking to 9 points in 2027, then turning into a 5-point drag in 2028 as depreciation bills mount.
5. 🏷️ The Value Play
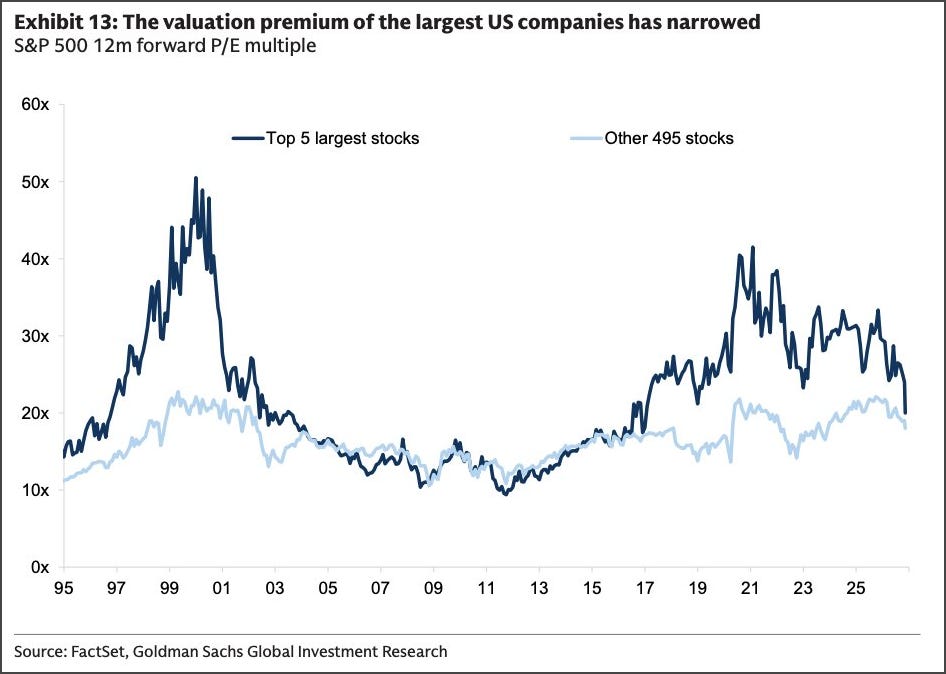
The five biggest S&P 500 stocks have lost most of their valuation premium.
The five largest stocks in the S&P 500 now trade at nearly the same forward P/E as the other 495.
This is a HUGE shift from what we've seen over the last 3 years...
6. 💡 Investment Themes
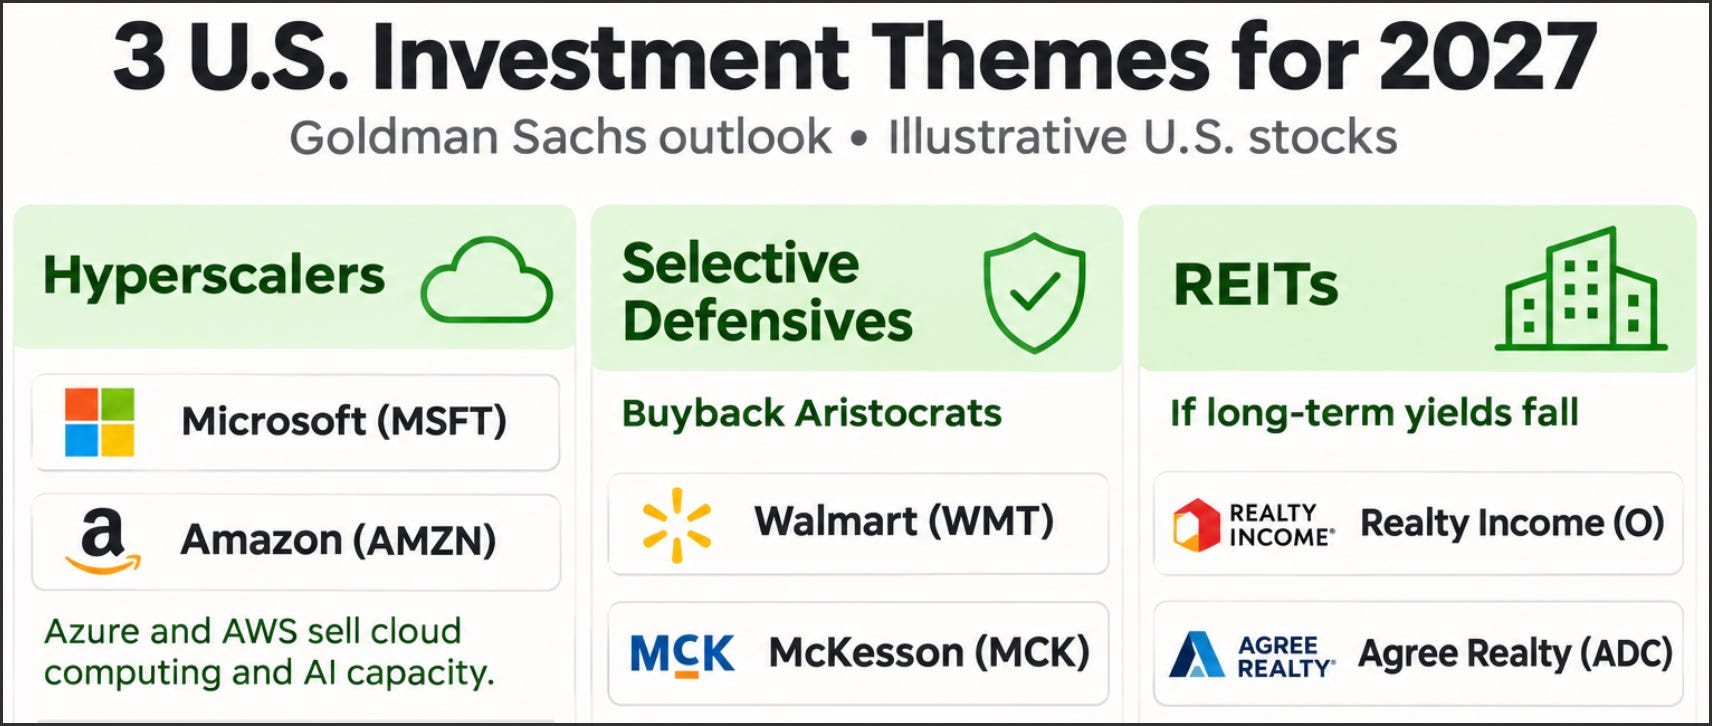
Goldman highlights three themes for 2027:
Growth scarcity
Selective defensives
Lower inflation and bond yields
Here’s what each one looks like in the U.S:
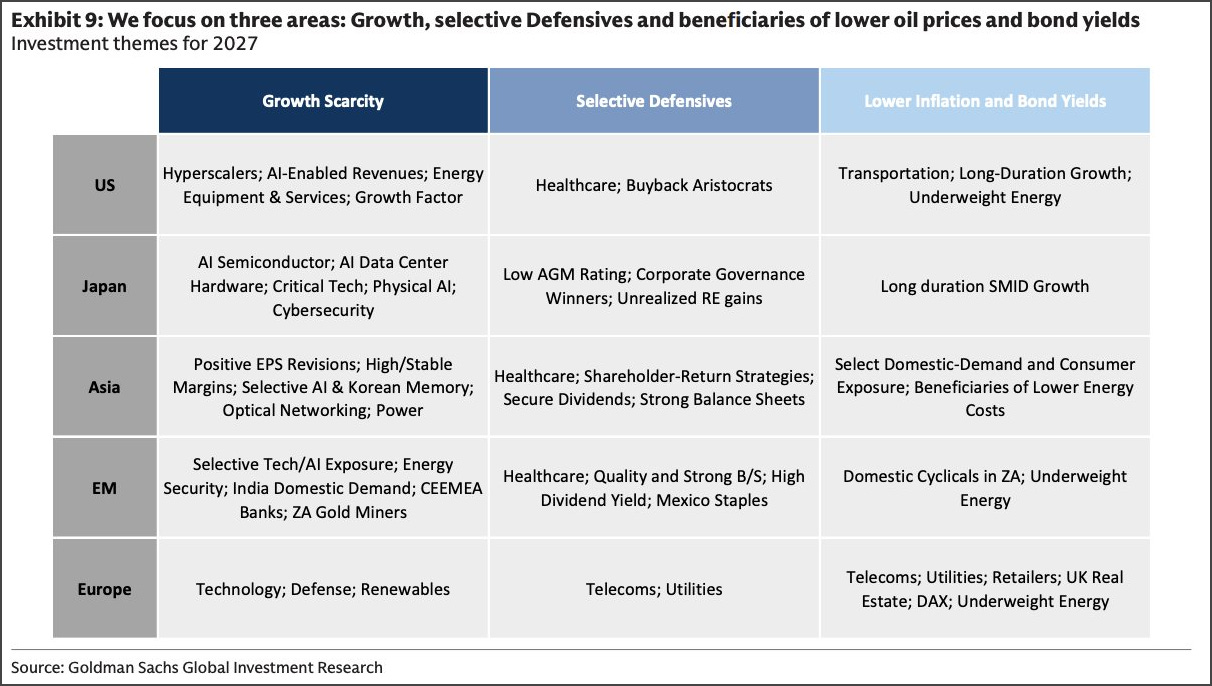
Two examples of hyperscalers are Microsoft ($MSFT) and Amazon ($AMZN). Through Azure and AWS, they operate massive networks of data centers and rent computing power to other businesses.
If more companies start running AI applications, Microsoft and Amazon will earn revenue from the computing power those applications use.
For defensive, Goldman focuses on Buyback aristocrats.
Think of these as the buyback equivalent of Dividend Aristocrats.
The S&P 500 Buyback Aristocrats Index looks for companies that have reduced their outstanding share count for at least 10 consecutive years.
Walmart ($WMT) and McKesson ($MCK) are two examples held by the ETF that tracks that index.
And finally, Goldman specifically calls out U.K. real estate in the chart.
The same setup will absolutely be a major catalyst for U.S. REITs if inflation cools and the 10-year Treasury yield falls while rents and occupancy hold up.
Lower Treasury yields can make REIT dividends more attractive relative to bonds.
If borrowing costs fall too, REITs can refinance maturing debt at better rates than they could today, and more acquisitions can make sense because the gap between what a property earns and what it costs to finance gets wider.
💭 So What?
These insights are undoubtedly insightful and can play a role in the moves we make-
But they aren’t the sole determining factor.
If you want to be a part of the process of building out our Dividend Growth and High Yield Portfolio, and get access to all the features mentioned below, then you can join Dividendology here:
See you soon!
Dividendology
Check out these resources:
Tickerdata 🚀 (My automated spreadsheets and instant stock data for Google Sheets!)
Interactive Brokers 💰 (My favorite place to buy and sell stocks all around the world!)
Seeking Alpha 🔥 ($30 off! + 7 day free trial)
Gosto da inf.tenho 80 anos e nao posso pagar a minha reforma nao chega pra pagar
Really clear summary. The part that stuck with me was the shift in where returns come from — earnings growth doing the heavy lifting instead of multiple expansion. That one change frames the whole 2027 outlook. Thanks for laying it out so plainly.