
💵 How to Analyze Free Cash Flow (Masterclass)
A Guide to The Most Important Metric ⚖️

Free cash flow is the most important metric in investing.
Why?
Because ultimately, it determines the company’s
Ability to grow dividends
Strength of its balance sheet
Ability to buyback shares
Direction of its stock price
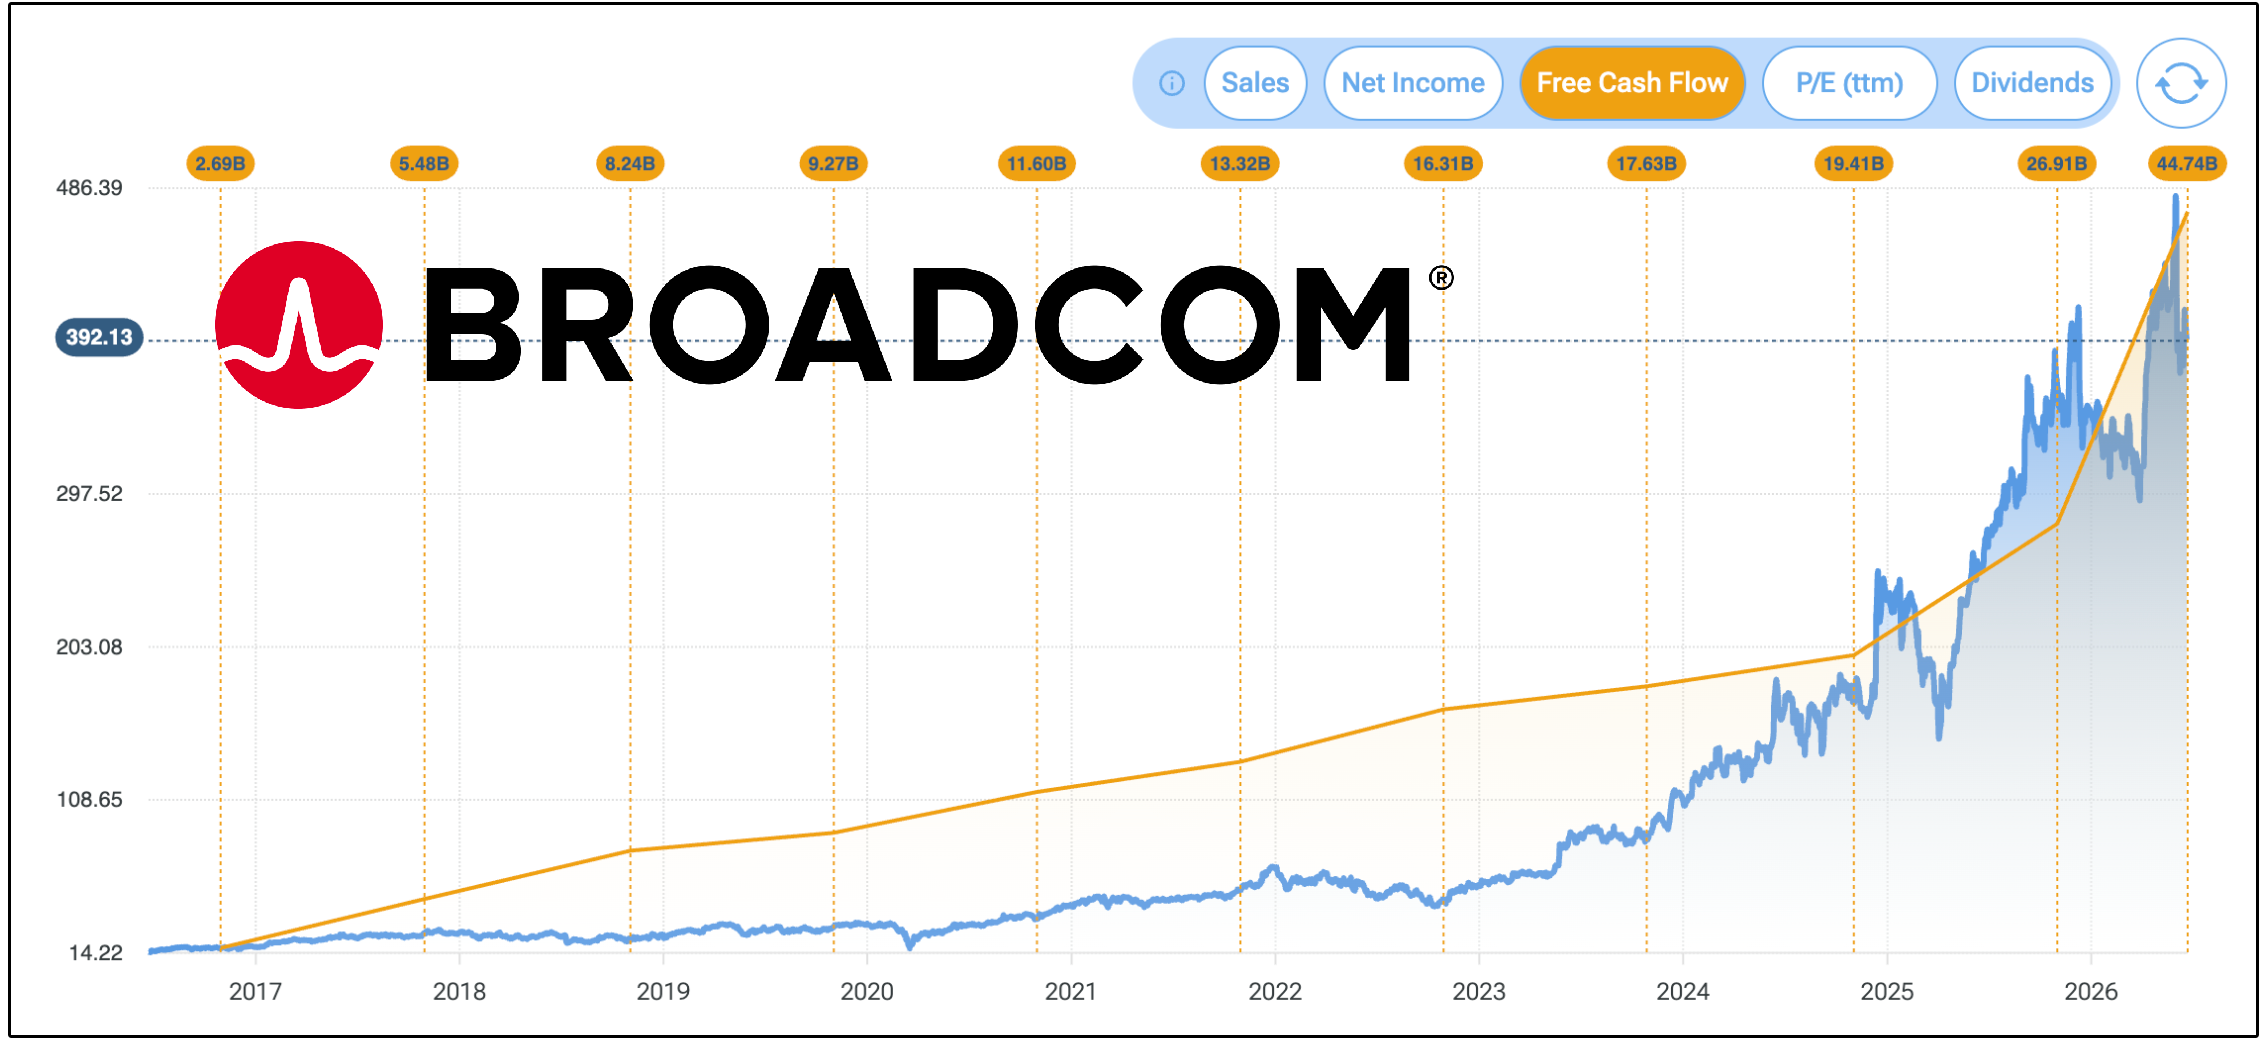
Broadcom is a great example.
However, free cash flow is also one of the most misunderstood financial metrics.
Investors often stop after checking whether free cash flow is growing-
But properly analyzing it requires going several steps deeper.

Today, we’re going to take a masterclass on how to analyze free cash flow.
💵 What Is Free Cash Flow?
The basic formula is straightforward:
Free Cash Flow = Operating Cash Flow − Capital Expenditures
Operating cash flow represents the cash generated by a company’s normal business activities after paying its operating expenses.
For example, the cash Microsoft receives from selling software subscriptions and cloud services contributes to operating cash flow.
However, if Microsoft sold an office building, that would not be considered operating cash flow because selling real estate is not part of its core business.
Capital expenditures, commonly called CapEx, represent the cash a company spends to purchase, build, maintain, or upgrade long-term assets.
These assets can include:
Factories
Equipment
Buildings
Data centers
Technology infrastructure
Subtracting capital expenditures from operating cash flow tells us how much cash remains after the company has funded the investments required to operate its business.
That remaining cash is free cash flow.
But the textbook definition only tells part of the story.
A more useful way to think about free cash flow is this:
Free cash flow is the capital management can allocate to increase shareholder value.
That is what makes it so important.
🧭 Capital Allocation
Management generally has five options for allocating free cash flow:
Reinvest in the existing business
Complete mergers and acquisitions
Pay down debt
Repurchase shares
Pay dividends
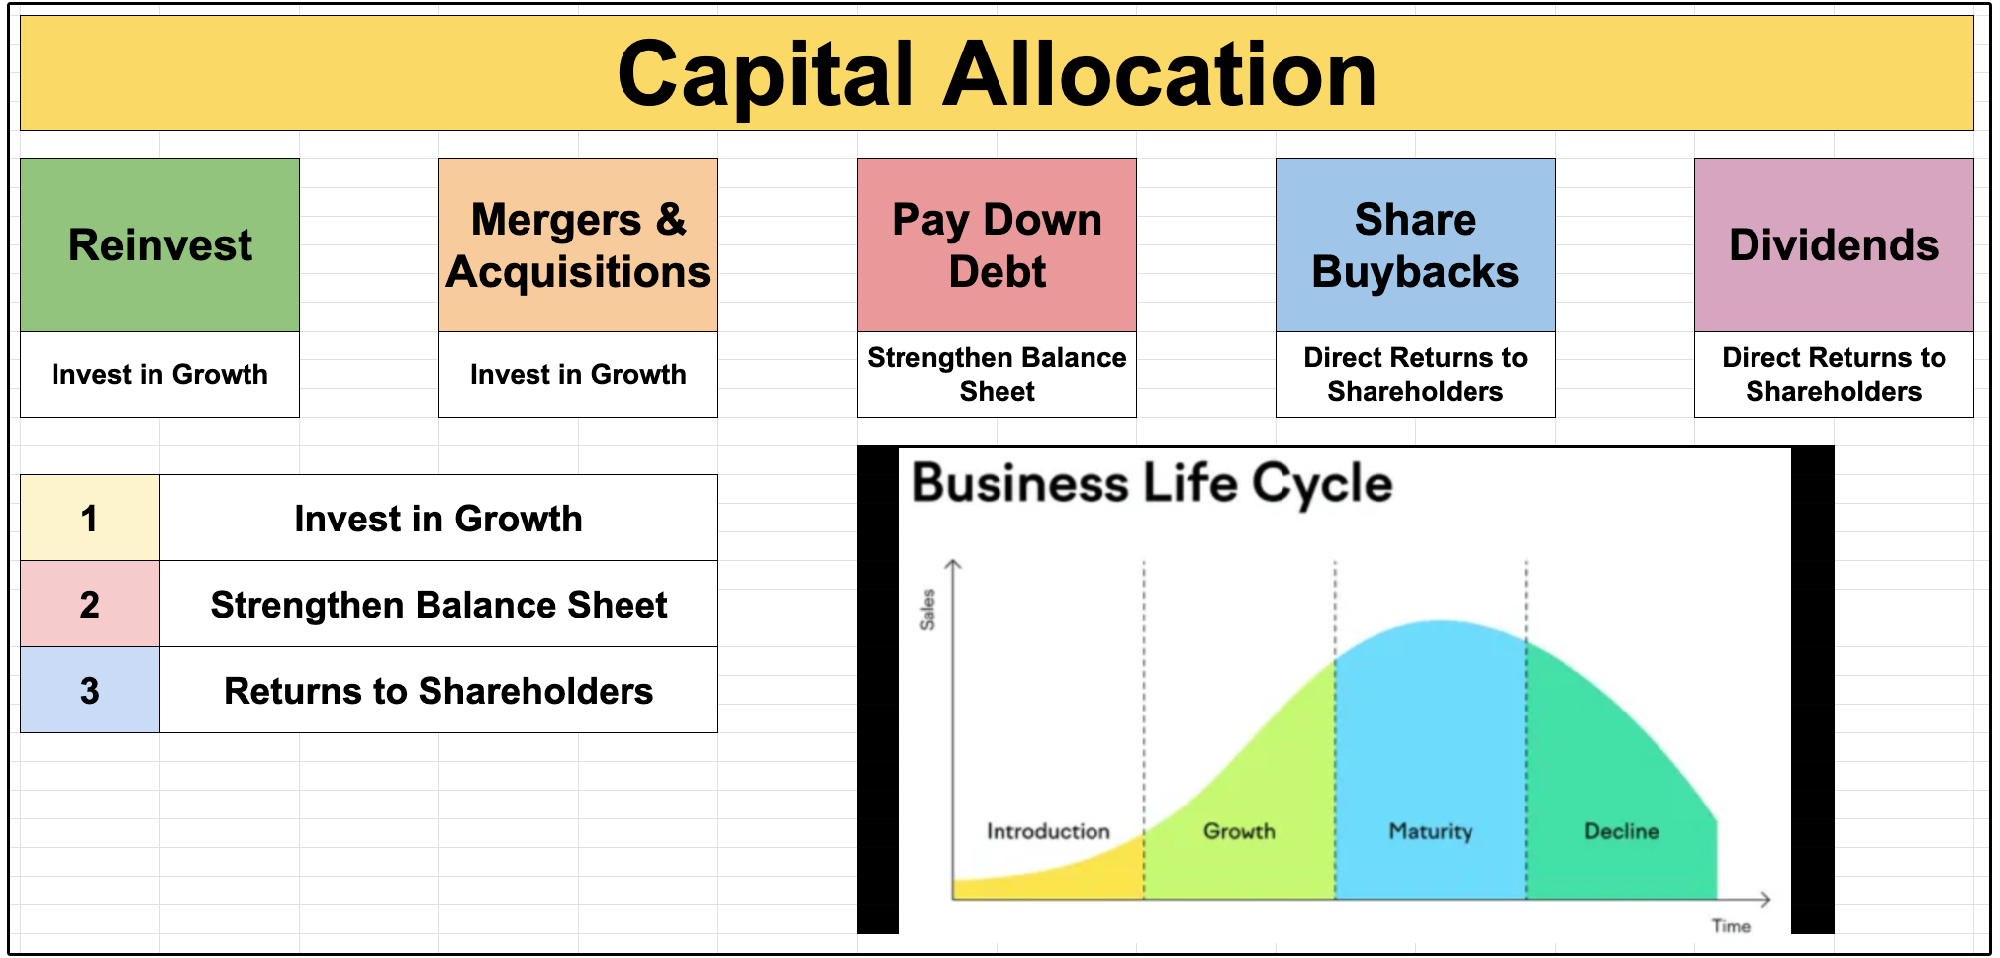
Capital allocation is one of management’s most important responsibilities.
The ultimate goal of capital allocation is to maximize shareholder value.
The way capital is allocated to maximize shareholder returns will look entirely different for each company.
A company can generate enormous amounts of cash, but shareholders may still receive poor returns if management does a bad job of allocating that capital.
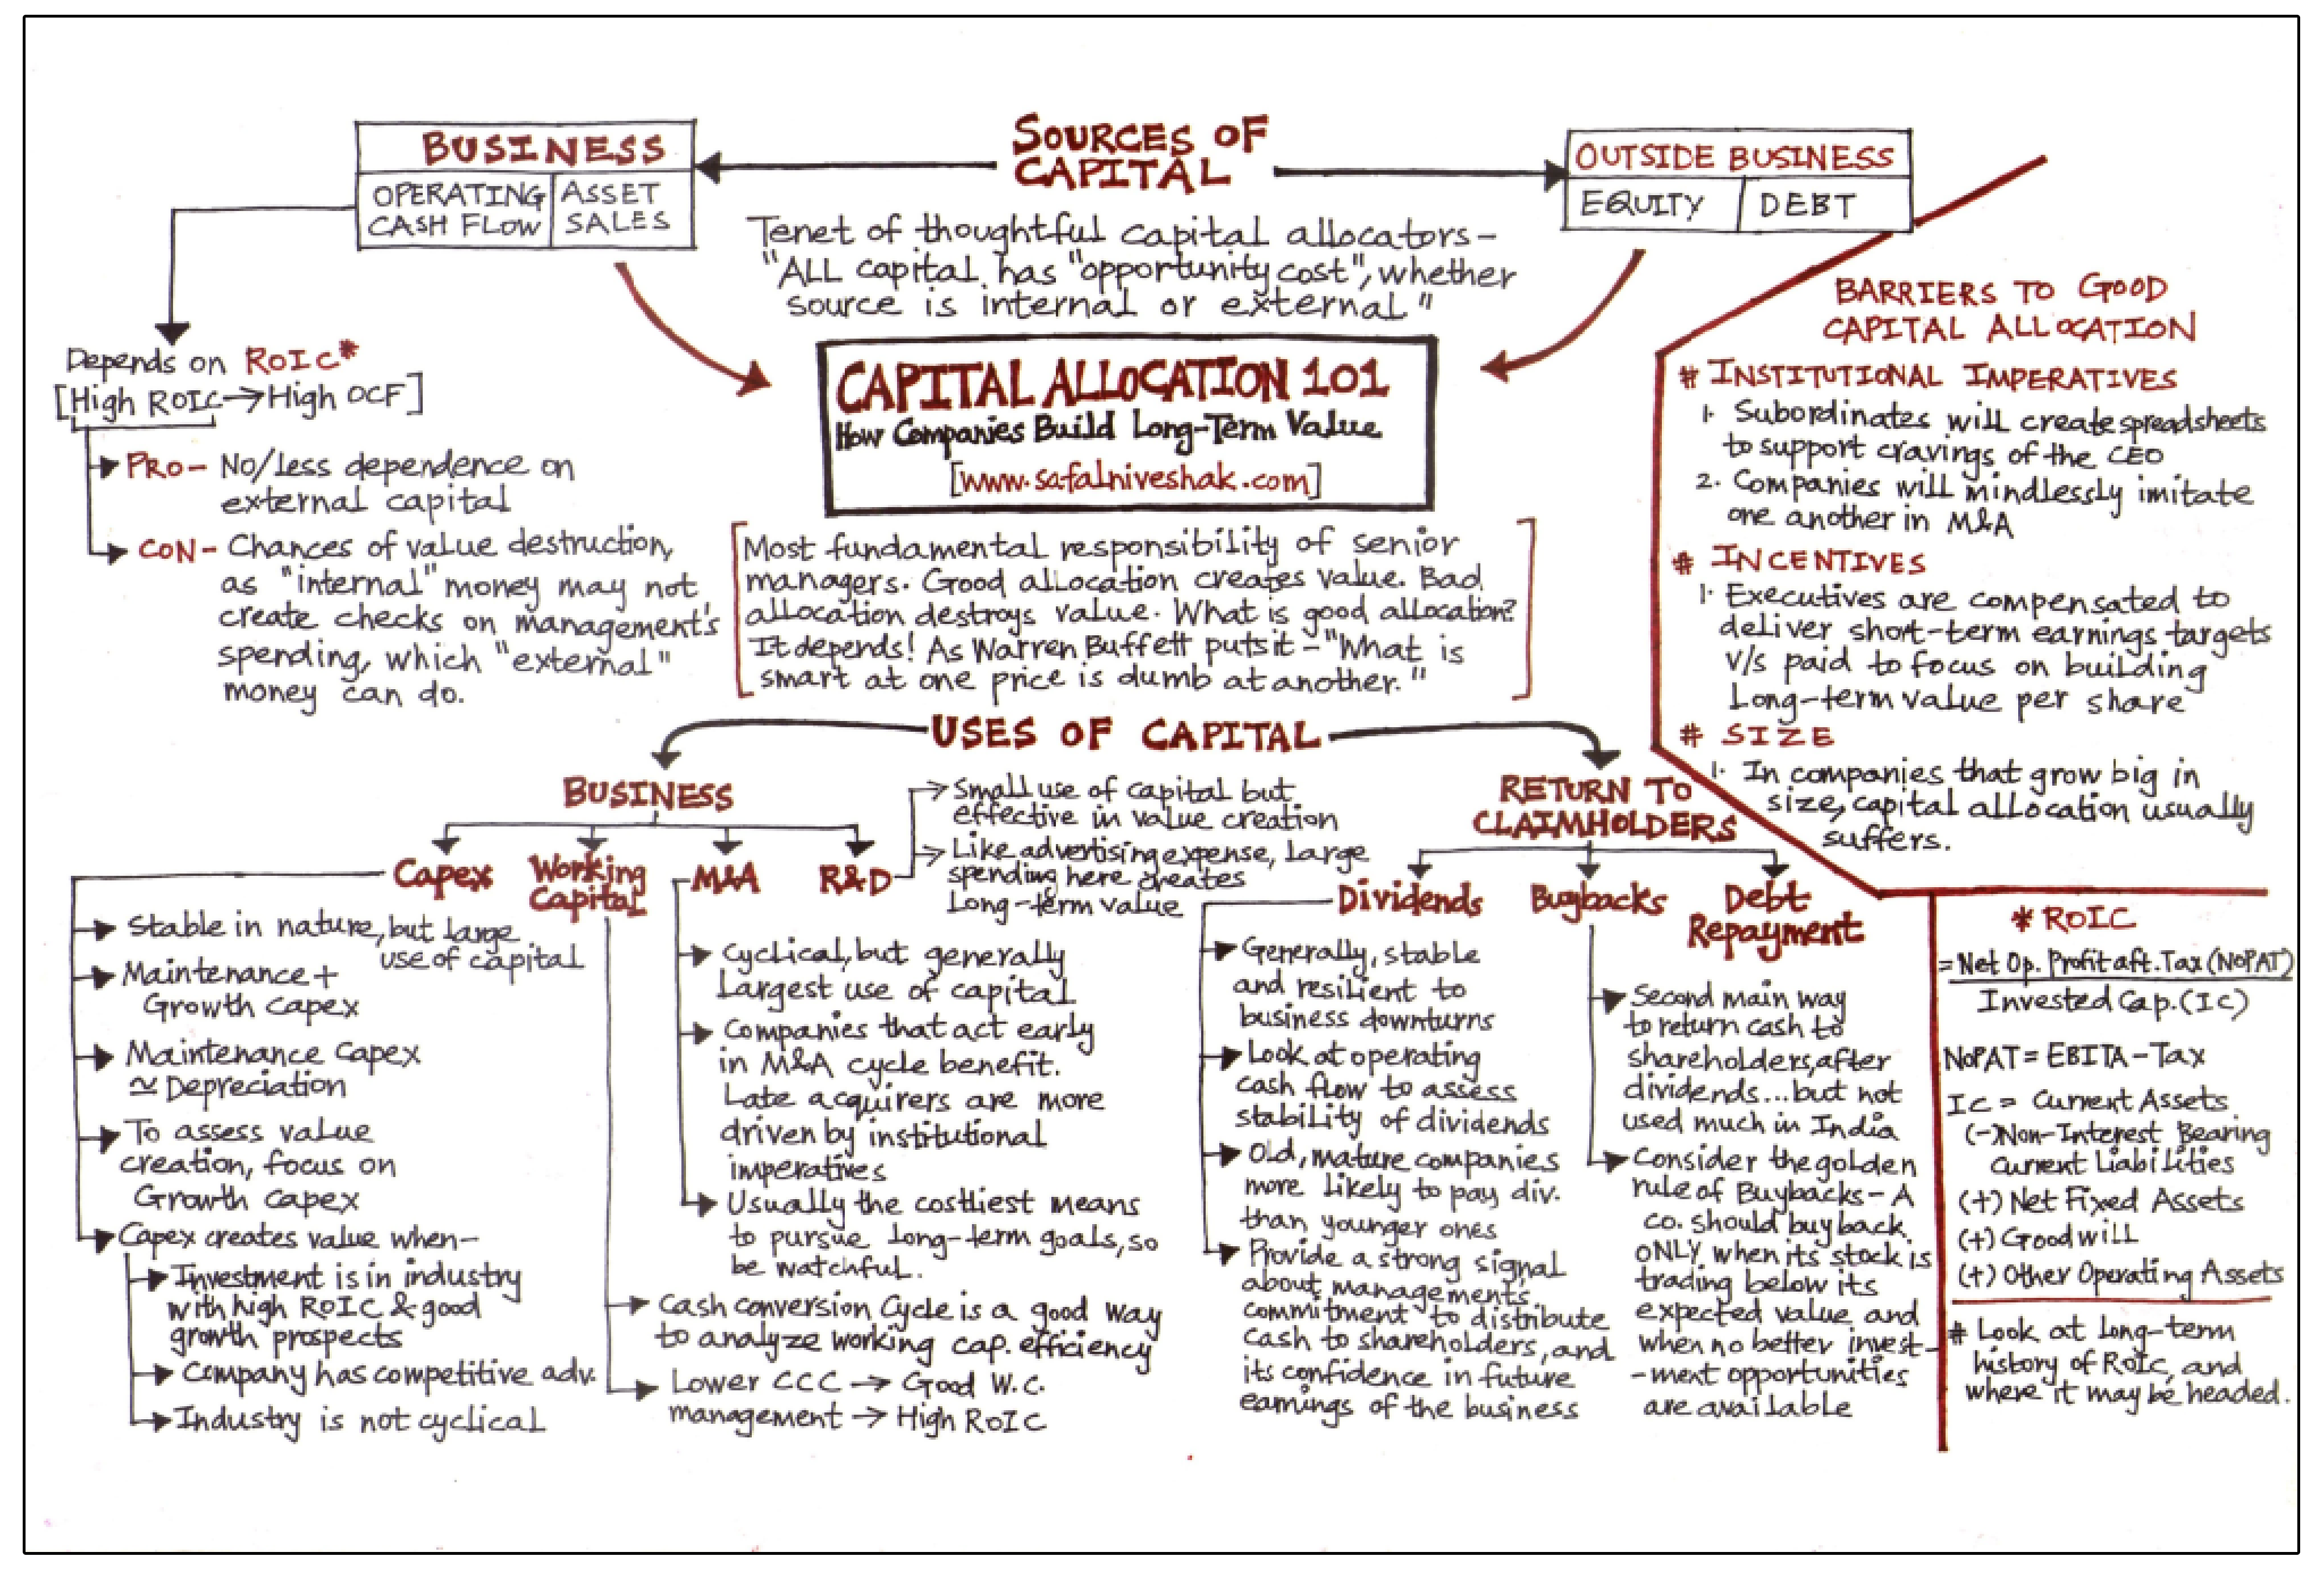
Want to take a deep dive into how management should decide to allocate their capital?
Check out this flowchart:
📈 Why Dividend Growth Begins With Free Cash Flow Growth
Historical studies have consistently shown that companies initiating or growing dividends have delivered strong long-term results.

But investors should be careful not to confuse correlation with causation.
A company cannot sustainably increase its dividend unless it also grows the cash available to support that dividend.
This is one reason dividend-growth companies have historically performed well:
They are also consistently growing free cash flow.
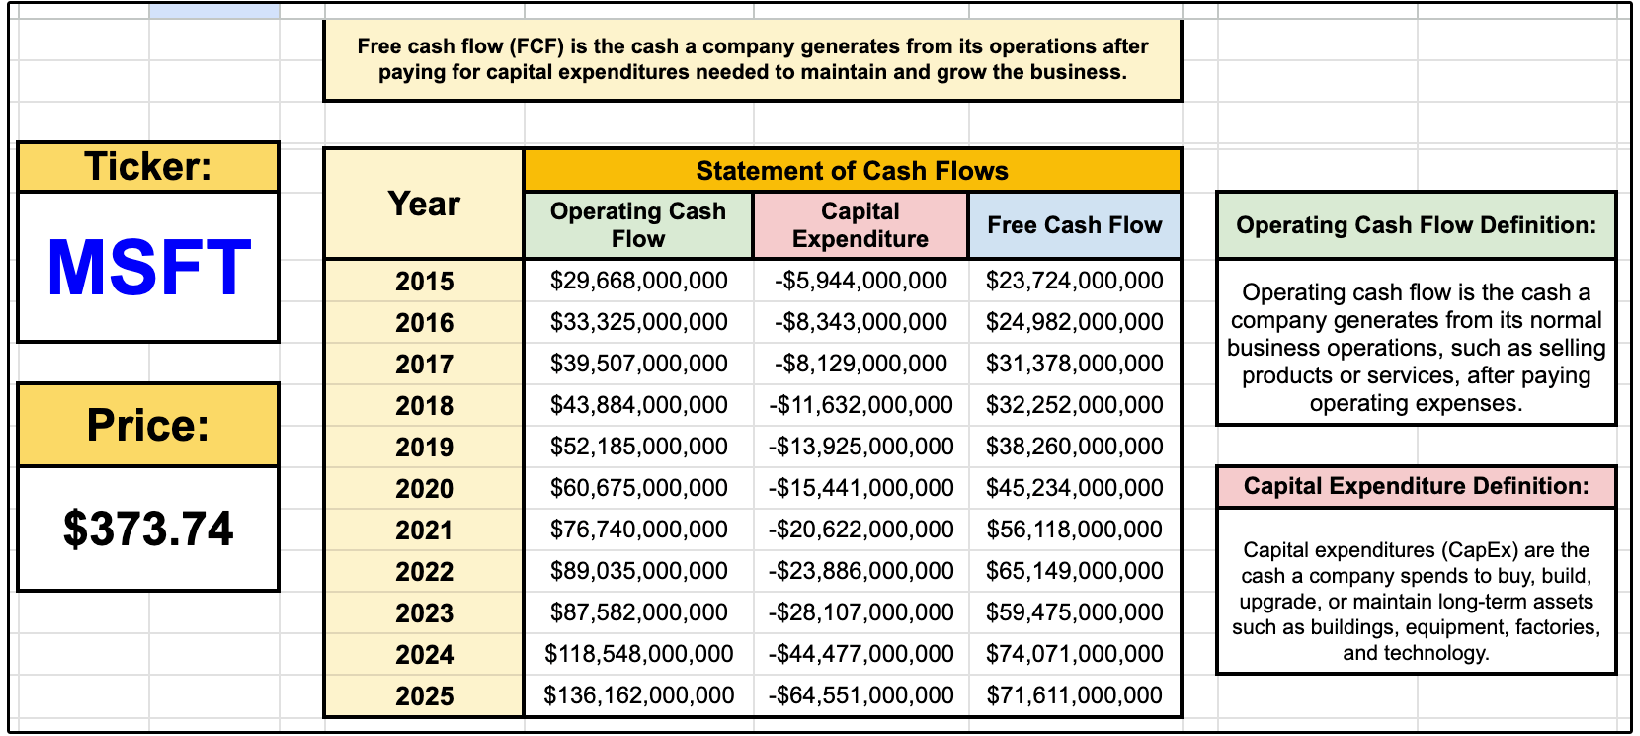
Microsoft is a strong example.
The company has grown its dividend for years, but that dividend growth was not created out of thin air. It was supported by substantial growth in the underlying free cash flow.
The lesson is simple:
Over the long term, dividend growth must be supported by free cash flow growth.
A company can temporarily increase its dividend faster than free cash flow, but doing so will cause the payout ratio to rise.
Zoetis is an example of this.
The 5 year dividend compounded annual growth rate was strong at above 15%, but it wasn’t backed by free cash flow growth-
So naturally, the FCF payout ratio continued to climb higher, which isn’t sustainable.
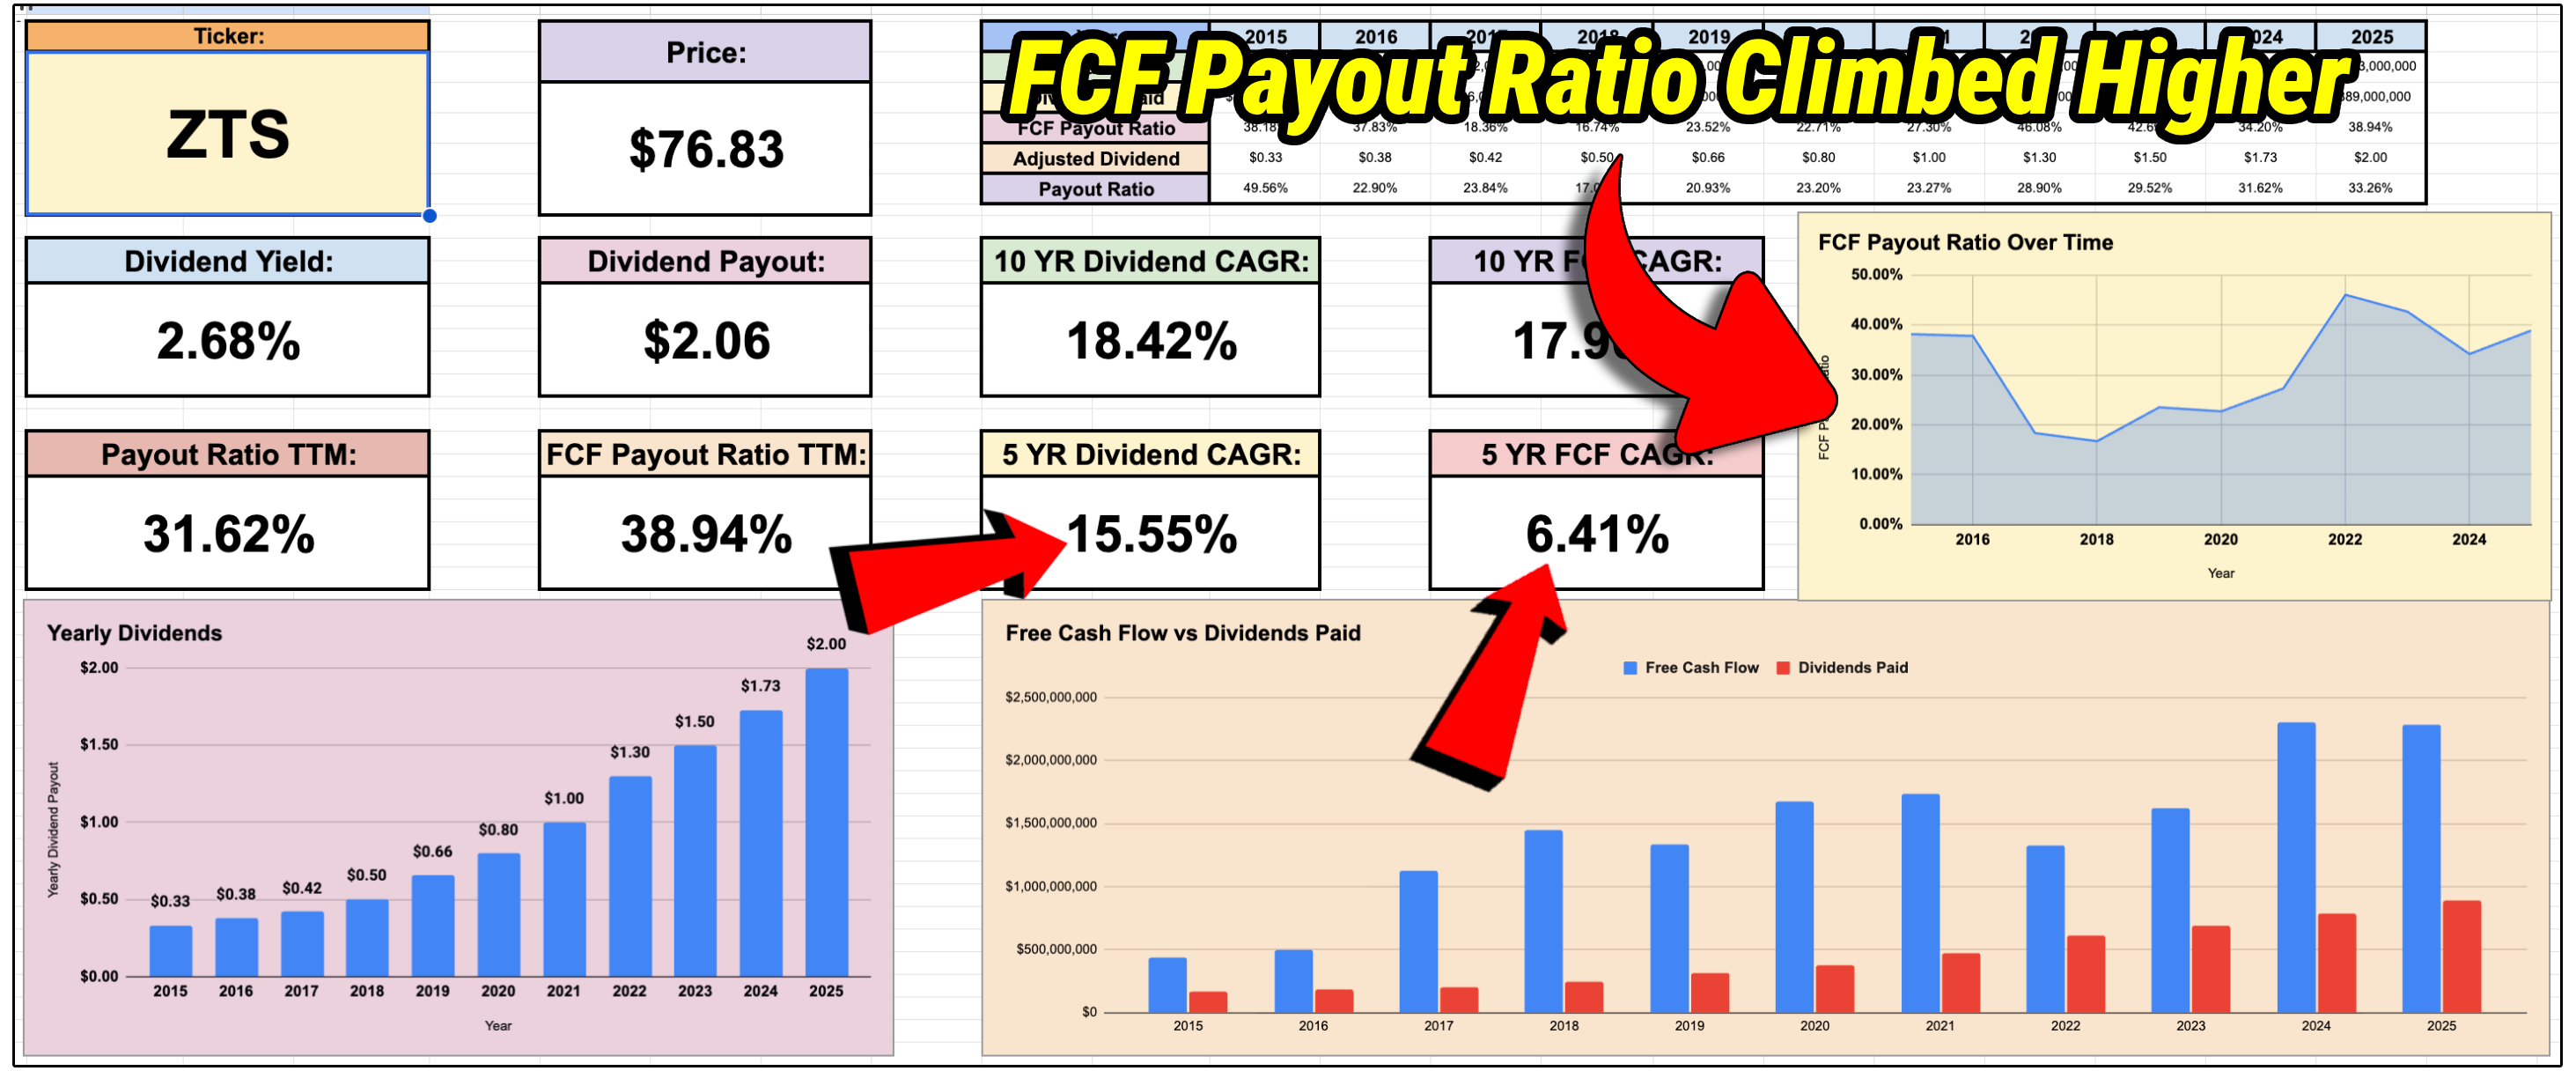
Eventually, management will be forced to slow the dividend growth.
🏗️ Not All Capital Expenditures Are Equal
A sudden increase in capital expenditures can cause free cash flow to decline.
Not all capex is created equal.
In general, there are two types of capital expenditures:
Maintenance capex is spending required simply to keep the business running at its current level. It preserves existing revenue but does not meaningfully increase future earnings power.
Growth capex, on the other hand, is discretionary investment aimed at expanding capacity, unlocking new revenue streams, and increasing long-term cash flow.
Microsoft’s recent infrastructure investments provide a useful example.
Free cash flow declined from 2024 to 2025.
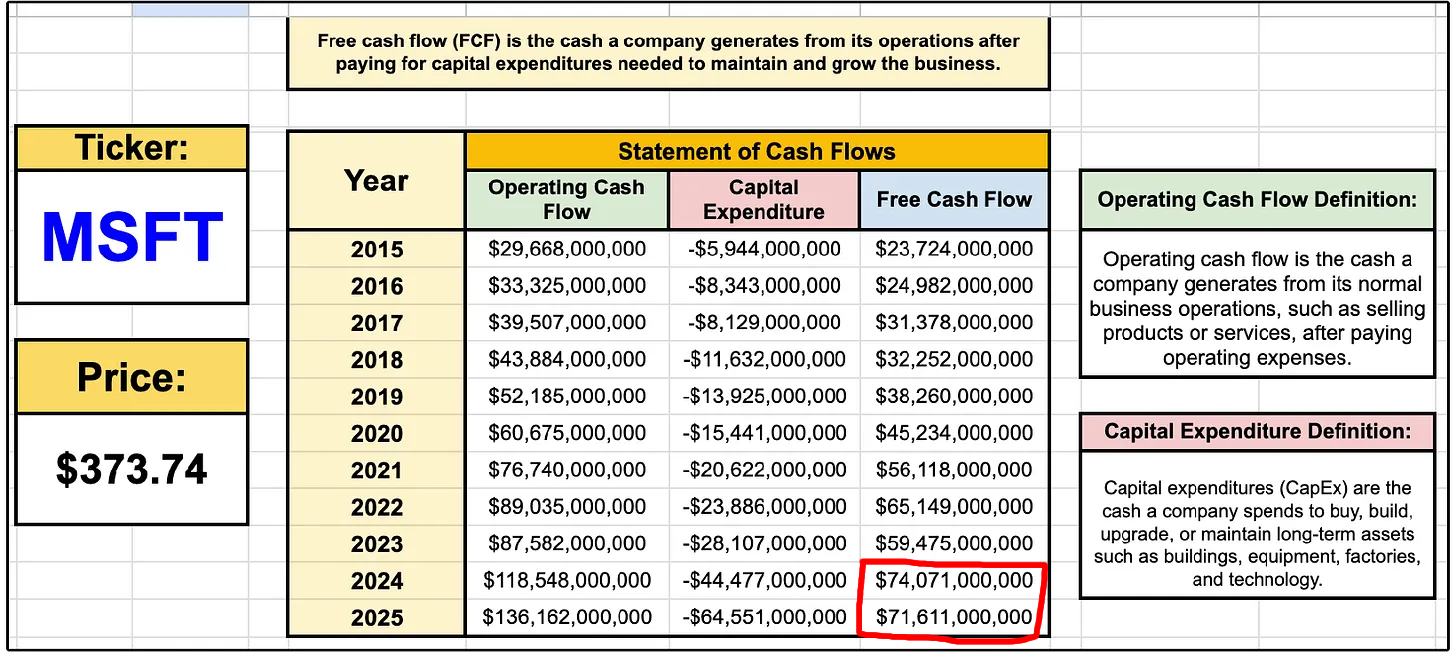
However, we can see this is not due to a decline in operating cash flows, it’s due to a rapid increase in capex spending, specifically, growth capex.
Higher spending on data centers will reduce free cash flow in the short term.
However, much of that spending is designed to support future cloud and artificial intelligence demand.
Therefore, a temporary decline in free cash flow may be acceptable when capital is being invested at attractive rates of return.
The question is not simply:
Did capital expenditures increase?
The better questions are:
Why did they increase?
Is the spending required to maintain current operations?
Is it expected to produce additional revenue?
What return is management likely to earn on the investment?
How long will it take for the investment to generate cash?
⚖️ Why Free Cash Flow Is Better Than Net Income
Earnings are an opinion
Free cash flow is fact.
A company can report strong earnings without generating an equivalent amount of cash.
How is this possible?
Let’s look at a few real life examples over the last decade:
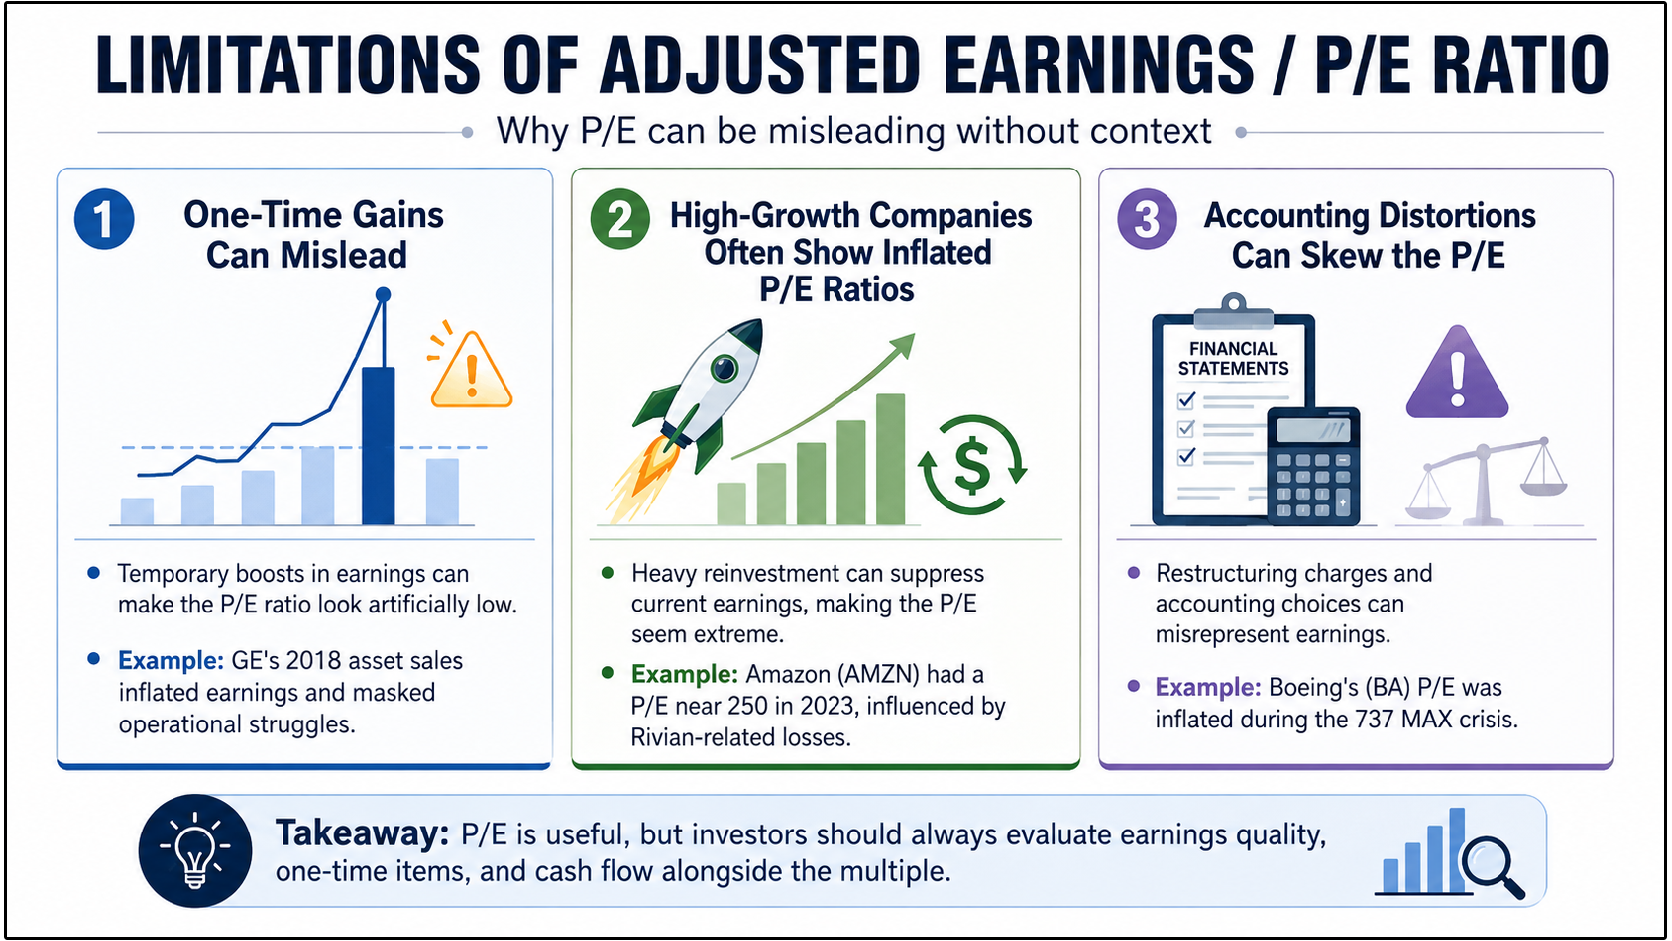
Earnings can account for things like:
Non-cash expenses
Asset sales
Restructuring charges
Depreciation and amortization
Investment gains or losses
One-time tax items
Accounting assumptions
Each of these can lead to earnings being quite misleading, which in turn can make the P/E multiple look misleading.
🧮 Free Cash Flow Per Share
Free cash flow per share is the ultimate measure of intrinsic value.
We believe that long-term growth of free cash flow per share is the ultimate measure to generate value - Haviv Ilan, Texas Instruments CEO
Total free cash flow tells us how much cash the entire company generated.
Free cash flow per share tells us how much of that cash is attributable to each share.
The formula is:
Free Cash Flow Per Share = Free Cash Flow ÷ Diluted Shares Outstanding
Consider a company generating $100 million in free cash flow with 50 million shares outstanding.
Its free cash flow per share would be:
$100 million ÷ 50 million = $2.00 per share
Now imagine the company generates the same $100 million the following year but reduces its share count to 45 million.
Free cash flow per share increases to approximately $2.22 despite total free cash flow remaining unchanged.
Now consider the opposite situation.
The company grows total free cash flow from $100 million to $110 million, but it issues enough stock to increase its share count from 50 million to 60 million.
$110 million ÷ 60 million = $1.83 per share
Free cash flow per share falls to approximately $1.83.
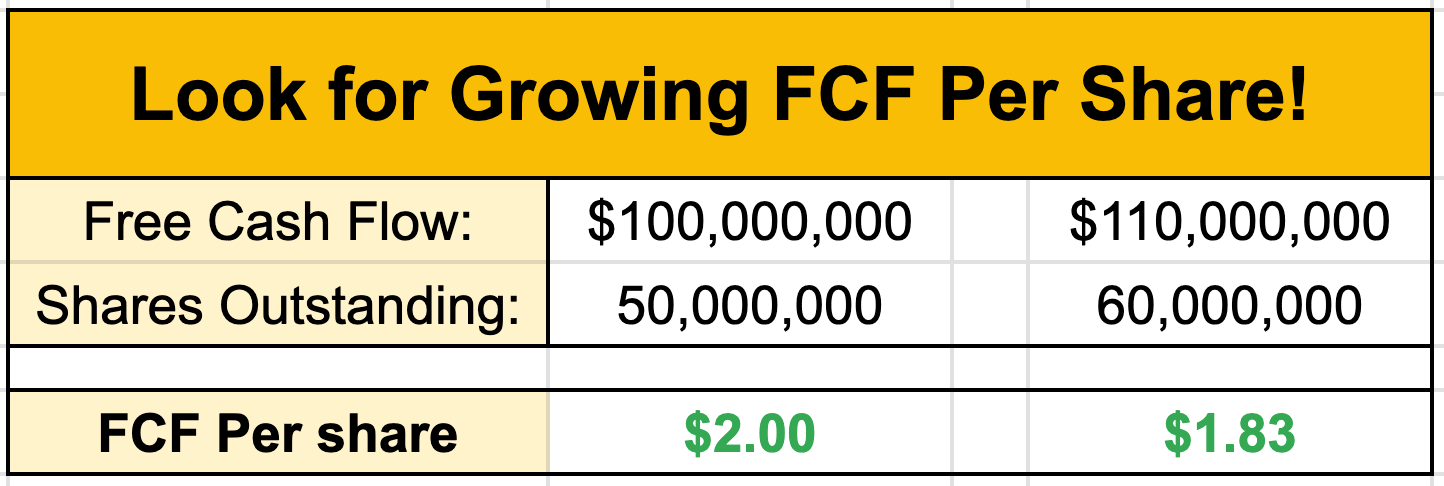
The free cash flow of the company grew, but the value attributable to each share declined.
This is why investors must analyze financial performance on a per-share basis.
A company can report growth while simultaneously diluting existing shareholders.
📊 Free Cash Flow Margin
Free cash flow margin shows how much of a company’s revenue becomes free cash flow.
The formula is:
Free Cash Flow Margin = Free Cash Flow ÷ Revenue
If a company generates $100 in revenue and $30 in free cash flow, its free cash flow margin is 30%.
This is one of the most useful measures of a company’s underlying profitability.
Mastercard is an excellent example of a high-quality, asset-light business.
Its free cash flow margin has expanded substantially over time.
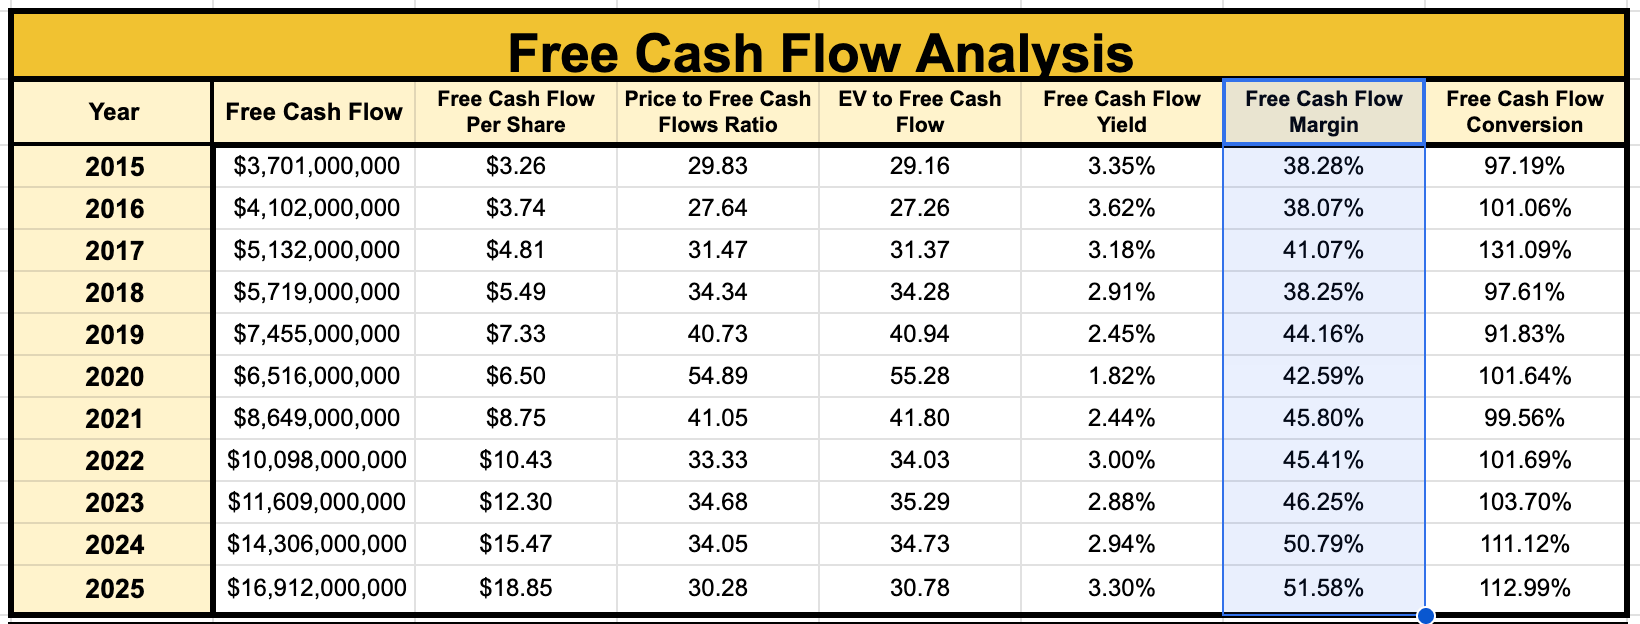
This means that not only has Mastercard increased revenue, but a larger percentage of every revenue dollar has become free cash flow.
A company can grow free cash flow in two primary ways:
Increase revenue
Convert a greater percentage of revenue into cash
The strongest businesses can often do both, and is typically a sign of:
Operating leverage
Pricing power
Greater scale
Improved efficiency
A stronger competitive advantage
On the flip side of this, that means declining margins can indicate the opposite, such as rising costs or lack of pricing power.
Revenue growth looks much less impressive when free cash flow margins are collapsing at the same time.
🔄 Free Cash Flow Conversion
Free cash flow conversion measures how effectively accounting profits become actual cash.
A common formula is:
Free Cash Flow Conversion = Free Cash Flow ÷ Net Income
If a company reports $100 million in net income and generates $90 million in free cash flow, its conversion rate is 90%.
That means every $1 of reported profit generated approximately $0.90 of free cash flow.
A conversion rate above 100% is not automatically suspicious.
Free cash flow can exceed net income because net income includes non-cash expenses such as:
Depreciation
Amortization
Stock-based compensation
Certain restructuring or impairment charges
Mastercard has historically converted a very high percentage of its earnings into free cash flow.
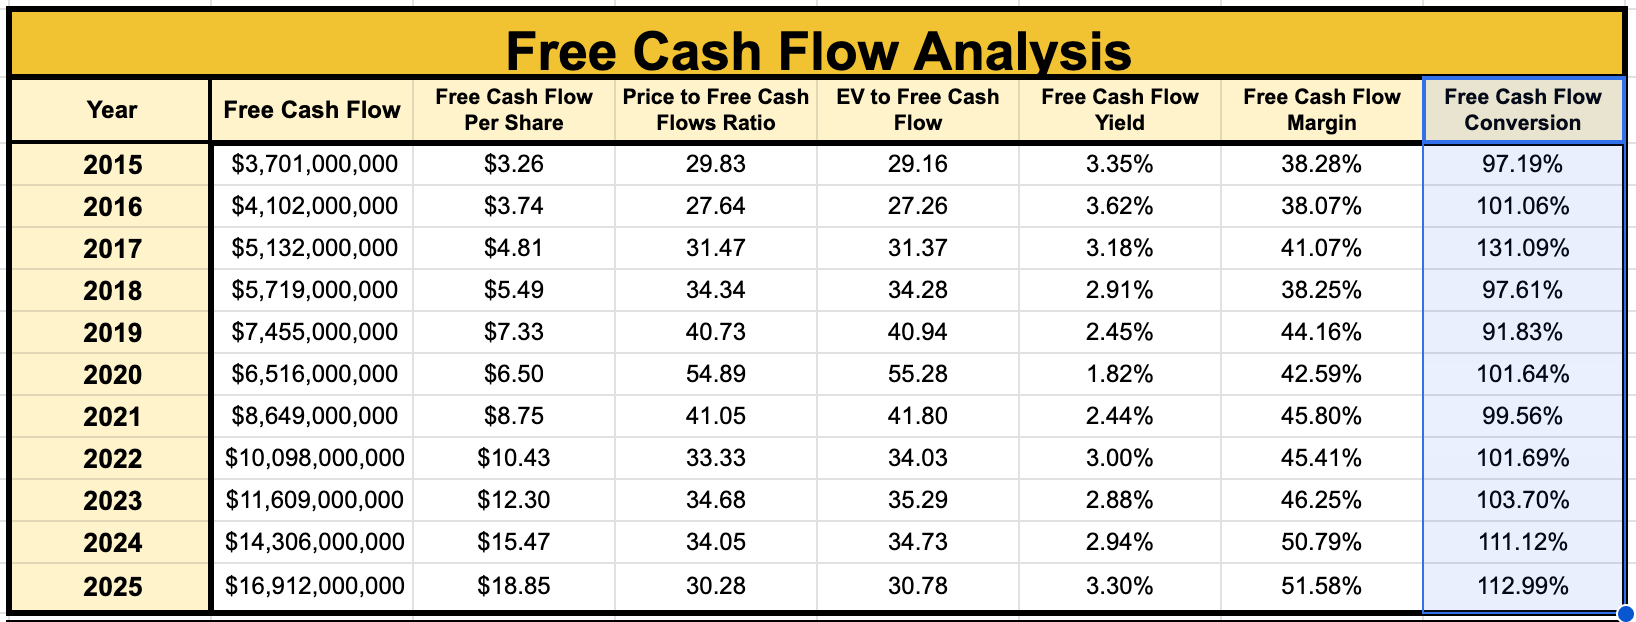
This should also provide investors with greater confidence that reported earnings growth will translate into actual cash generation.
However, consistently weak conversion is typically a red flag, especially if the conversion percentage is declining.
It often times indicates aggressive accounting, rising working-capital requirements, poor-quality earnings, or a business that requires substantial ongoing investment.
💰 Valuing a Stock With Free Cash Flow
A discounted cash flow model estimates the value of a business based on the cash it is expected to generate in the future.
The basic process is:
Project future free cash flow
Estimate a terminal value
Discount those future cash flows back to today
Add cash and cash equivalents
Subtract debt
Divide by diluted shares outstanding
The concept is straightforward:
A business is worth the present value of the cash it will generate for its owners.
The most difficult part is estimating future growth.
To see this actually implemented, skip to the 28 minute mark of this video:
🚫 When Free Cash Flow Is Not the Best Metric
Free cash flow is extremely useful, but it is not appropriate for every industry.
Utilities
Utilities often report weak or negative free cash flow because they continuously invest in infrastructure that expands their regulated rate base.
REITs
Free cash flow and net income can be misleading for REITs because real estate depreciation reduces reported earnings, even when property values and rental cash flows remain healthy.
Bank Stocks
Traditional free cash flow is not particularly useful for banks because lending, deposits, and changes in regulatory capital are part of their core operations rather than ordinary working-capital movements.
Business Development Companies
Free cash flow is not the best measure for BDCs because their business involves continuously originating, purchasing, and selling investments.
Master Limited Partnerships
MLPs typically own capital-intensive energy infrastructure, making traditional free cash flow less useful because large capital expenditures can distort the underlying cash available to investors.
Ultimately, investors must understand the underlying business model before applying the same financial metric to every company.
⚠️ Red Flags to Watch
Here are some of the most important warning signs when analyzing free cash flow.
Dividends growing faster than free cash flow
Total free cash flow rises while free cash flow per share declines
Free cash flow margins deteriorate
Cash flow depends heavily on working-capital changes
Capital expenditures are repeatedly postponed
Stock-based compensation is unusually high
✅ The Bottom Line
Free cash flow is the ultimate metric for long term dividend growth investors-
And understanding it (and what to watch out for) is imperative.
That’s why I created a free guide and checklist for you.
You can get it for free here:
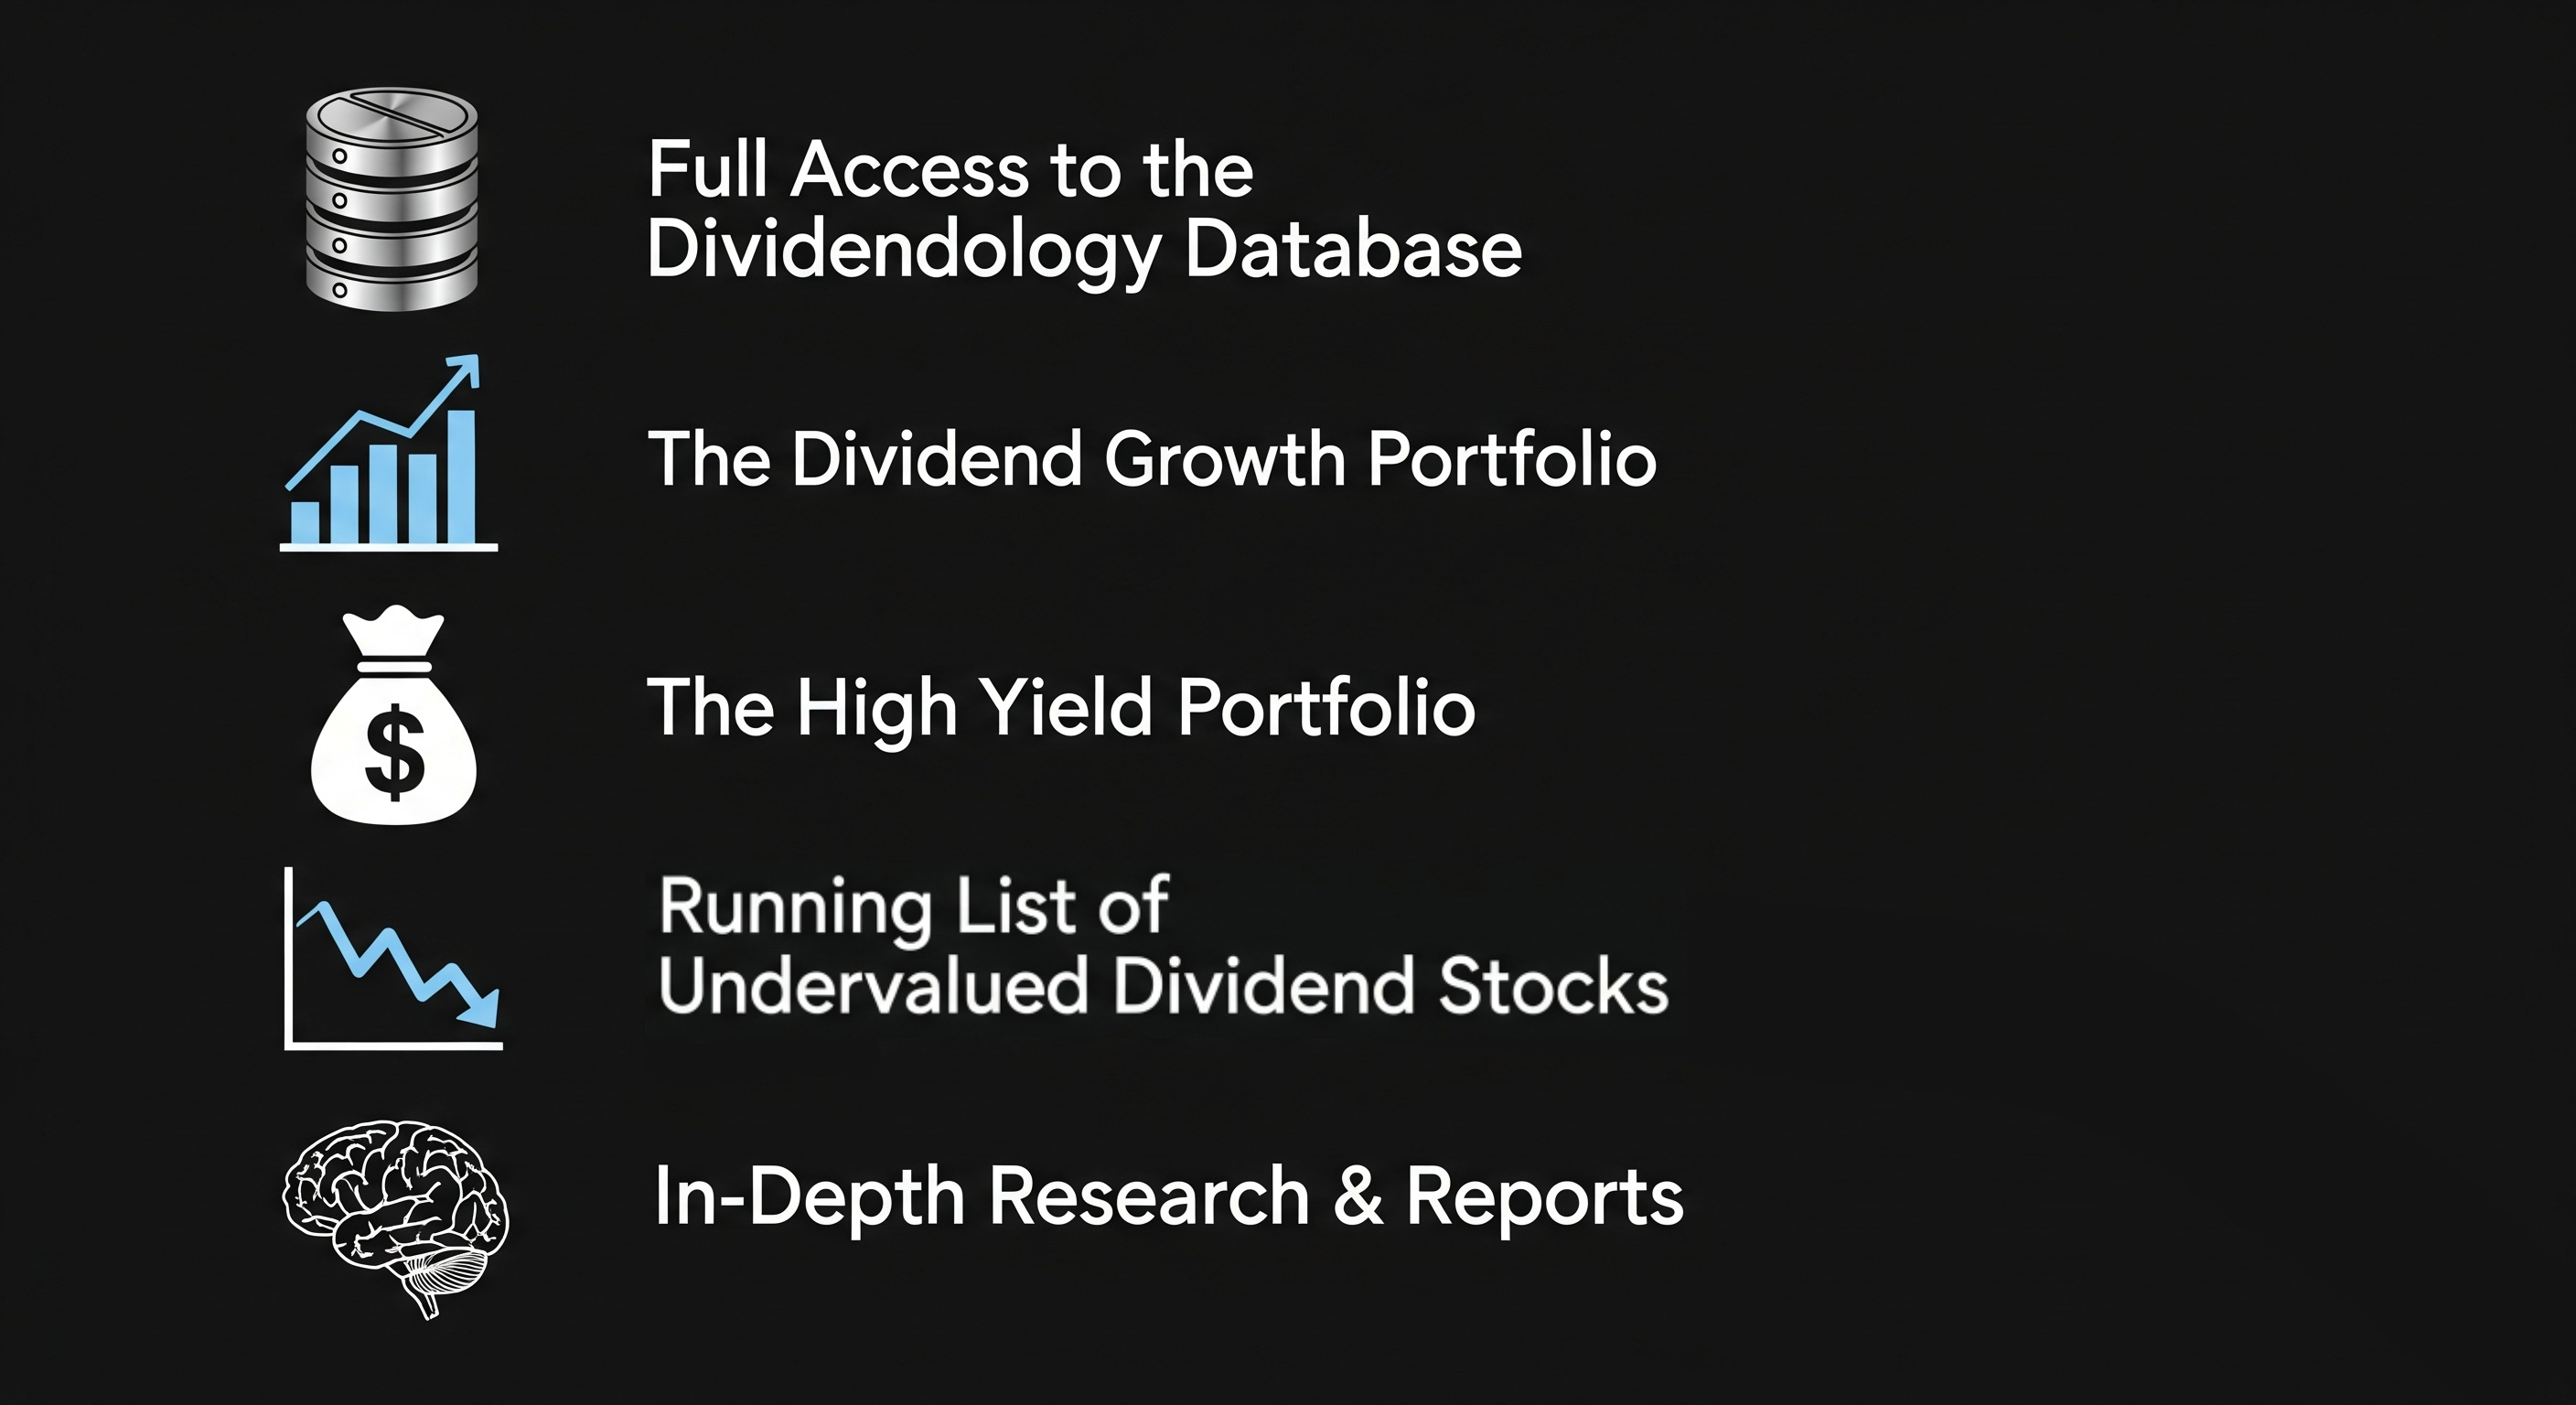
🔓 Want Access to More?
We are currently still in the beginning stages of building out our Dividend Growth and High Yield Portfolio on Dividendology.com.
You can get access to them and everything else mentioned below here:
Check out these resources:
Tickerdata 🚀 (My automated spreadsheets and instant stock data for Google Sheets!)
Interactive Brokers 💰 (My favorite place to buy and sell stocks all around the world!)
Seeking Alpha 🔥 (Research stocks $30 off! + 7 day free trial)
HYSA 📊 (Get Access to the Best High Yield Savings Accounts!)