🚦How to Build a High Yield Portfolio!
Most People are About to Make a Mistake. 💡
Have you ever played the old game minesweeper?
The basic premise is simple-
Some squares are safe to click on, but some squares are hidden mines.
If you go around randomly clicking on squares, you are basically guaranteed to hit a mine, ending your game.
But if you know what to look for, you can strategically avoid the mines.
High yield investing is nearly identical.
Asset classes like REITs, BDCs, MLPs, and Covered Call ETFs can be amazing ‘yield boosters’.
But they can also be very dangerous if you don’t know what to look for.
🚨 Alarming Statistics
As you may know, I’ve been building out the Dividendology Database since the beginning of this year-
And we are officially set to launch it along with our two real money model portfolios on September 8th.
Here are some alarming statistics I’ve found from building out this database:
Out of the 65 Covered Call ETFs in the Dividendology Database, only 26 have grown NAV since inception. (Only 40%!)
Out of the 42 BDCs in the Dividendology Database, only 13 had positive tangible book value per share growth over the past 5 years. (Only 31%!)
Another way of stating this-
There are ‘mines’ everywhere.
Pick the wrong one, and it could blow up in front of you.
This is why we have to learn how to play the game.
🎮 How To Play The Game
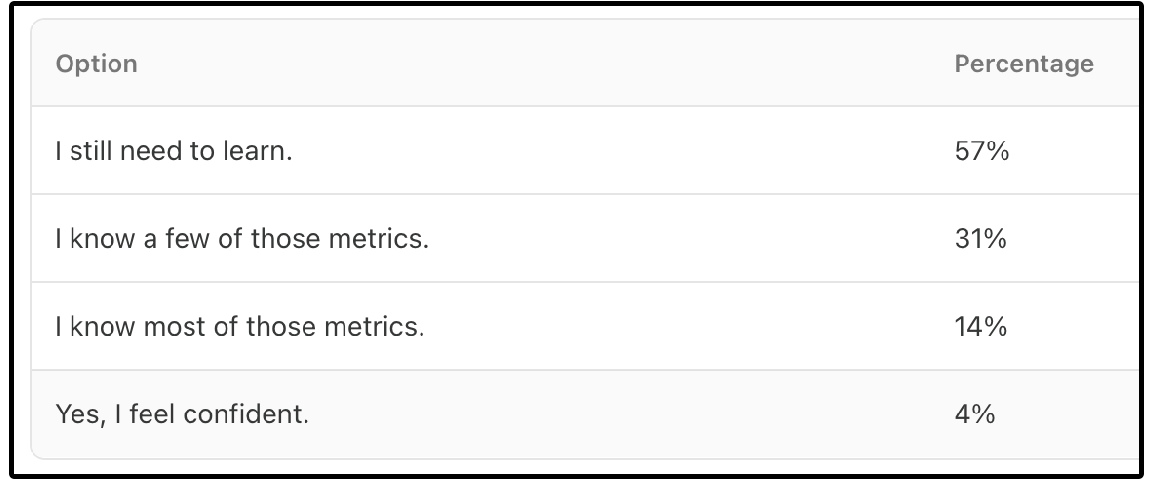
I sent out a poll to around 30,000 of you a couple of weeks ago, and found that 77% of you owned high yield assets like BDCs, REITs, MLPs, and Covered Call ETFs.
However, when I asked how many of you felt confident in analyzing the key metrics for these assets, only 4% of you felt confident.
There is very little education surrounding how to analyze these alternative asset classes.
💰 Business Development Companies (BDCs)
Let’s talk about Business Development Companies, more specifically, how there is abundant misinformation surrounding their dividend yield.
The average dividend yield of the 42 BDCs in the Dividendology Database is currently 12.86%!
As I’ve been building out the Database, I’ve come to notice that nearly every single software lists the incorrect yield for BDCs.
Why is this?
Because BDCs technically have 2 yields:
Base Dividend Yield
Total Dividend Yield
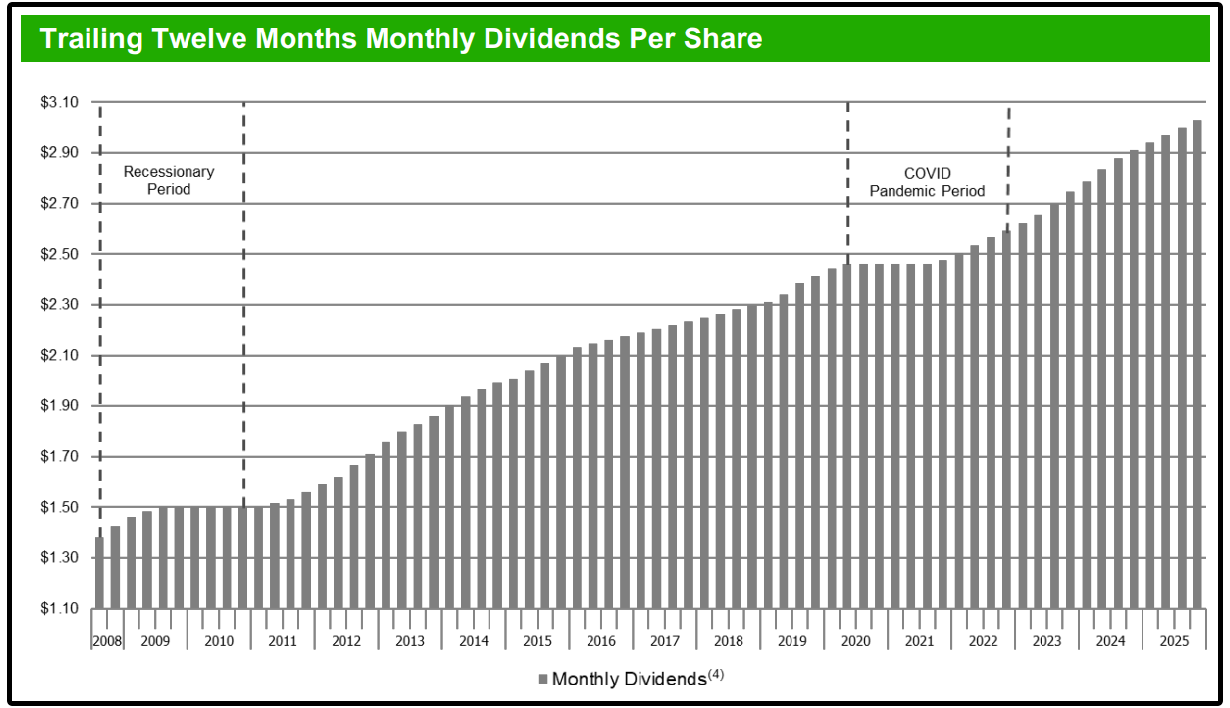
Let’s look at Main Street Capital for example:
Above we can see the base dividends paid out since 2008.
It’s certainly an impressive track record of paying and growing dividends over time-
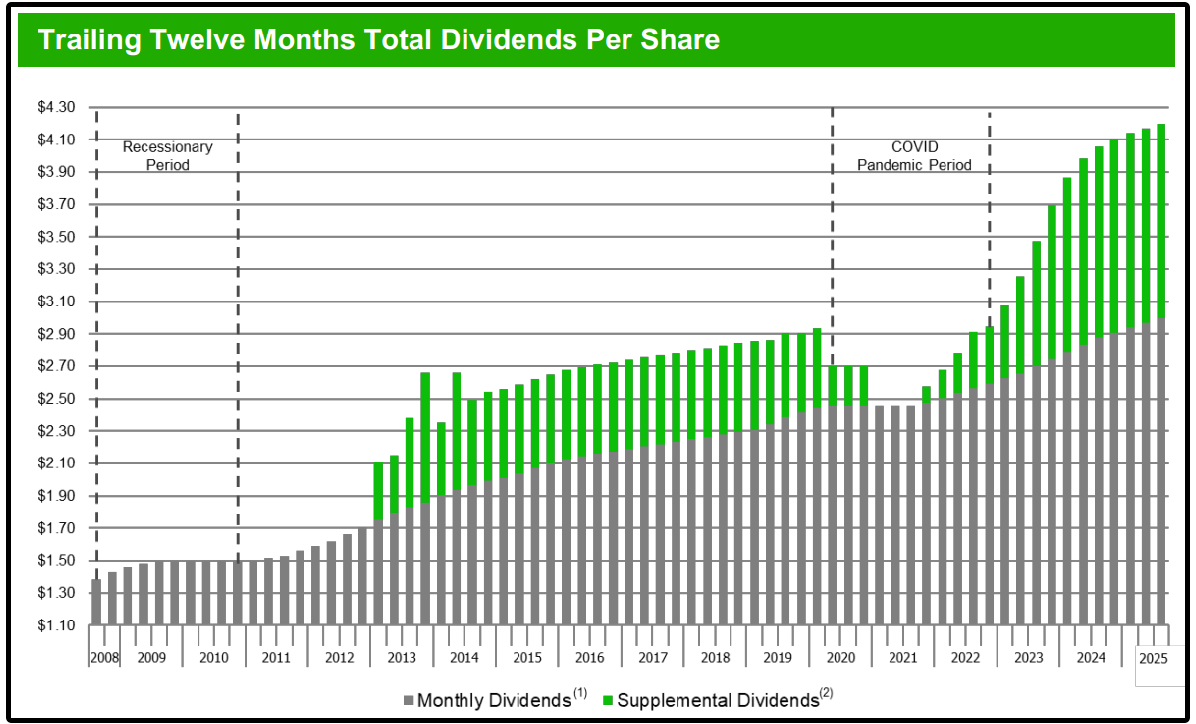
But it doesn’t tell the whole story.
If we look at the total dividends paid out, we can see there have been periods where they have paid out a significant amount of special dividends.
With that being said, this means the yield for Main Street Capital is:
Base Dividend Yield: 4.70%
Total Dividend Yield: 6.60%
In the Dividendology Database, we track both so you can see the full picture.
We are entering a time where it’s becoming incredibly important that we know the difference, because it is likely we are about to see a radical change in the ‘total dividend yield’ for many BDCs.
Why are we about to see a change?
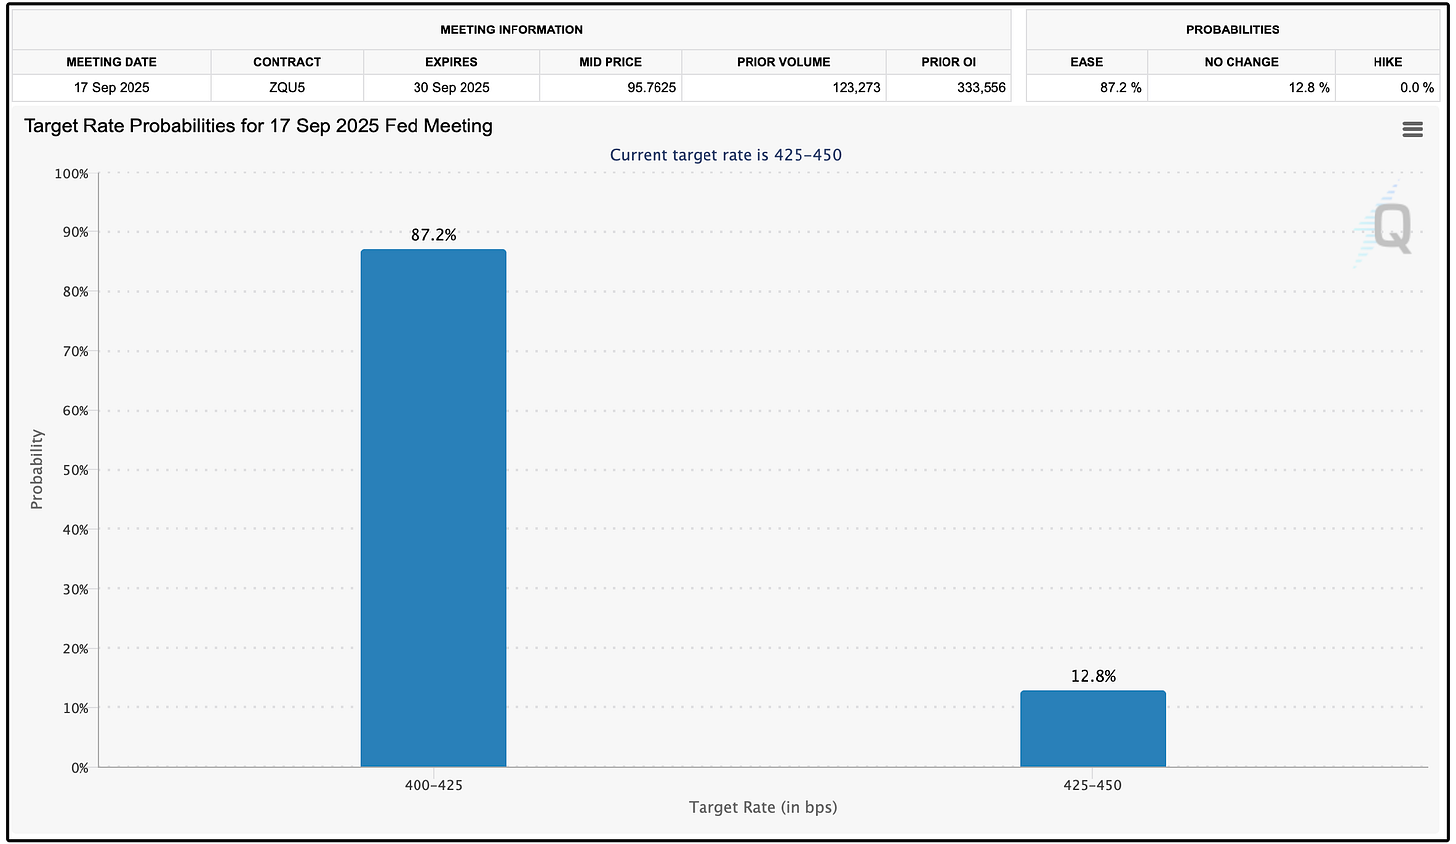
Because Jerome Powell essentially told us last week that the Fed will be lowering rates on September 17th.
There is currently an 87.2% chance that we will see rate cuts next month.
Most BDC loans are floating-rate, which is why dividend payouts have surged over the last two years as interest rates climbed.
But if the Fed lowers rates, the income BDCs collect on those loans will shrink.
That means the special dividend payouts are likely to come down from today’s elevated levels.
This is why we must differentiate between base yield and total yield.
The base yield is the yield we should (hypothetically) be guaranteed to get.
Anything above that is considered “bonus yield” that depends on how much extra income a BDC is generating in the moment.
The base yield is our floor.
The total yield is variable.
Here is why it is more important than ever to know this right now:
I’ve even identified one BDC in the Dividendology Database where the gap between its base yield and total yield is nearly six full percentage points.
Imagine thinking you were buying a stock with a 12% yield, only in reality for the base yield to be 6%.
That kind of spread shows just how much investors can be misled if they only look at the headline number.
A big portion of what looks like an ultra-high yield may actually be driven by temporary special payouts, which is the exact type of income most at risk when rates begin to fall.
📊 BDC Database
I’m still amazed how little data/accurate information there is surrounding these alternative income asset classes like BDCs.
This is exactly why I’ve been building the Dividendology Database over the last 8 months.
Our breakdown of yield for BDCs is just one of the many way the Dividendology Database is designed to go deeper.
For BDCs, we will be providing coverage on 42 BDCs, with in-depth data on:
Yield (Base vs Total)
True Dividend Coverage
Management Structure
TBVPS Growth
Valuation Metrics
Credit Ratings
Among many other key metrics.
And don’t worry if you don’t have an understanding of these metrics, everything will be taught and explained.
Not to mention, we will be using our database to build out our real-money high yield portfolio…
Big News 🎉
I’ve been publicly sharing my portfolio for years.
But there’s a problem.
Not everyone gains as much value in following my portfolio anymore, because it's grown larger, built over many years, and tailored to my specific financial situation.
And over the years, two questions have come up more than almost any others:
“How would you invest right now if you were starting from scratch?”
“What would you buy if you were building a high-yield portfolio today?”
How you invest completely depends on where you are on the dividend pyramid.
I’ll be launching two real-money portfolios on Dividendology.com:
💰 The Dividend Growth Portfolio – Built from $0, showing exactly how I’d begin investing today if I were starting from scratch
🧾 The High-Yield Portfolio – Designed to maximize immediate dividend income (think 8%+ yields) without sacrificing capital
These aren’t mock portfolios.
I’ll be investing real money, tracking every move, every dividend, and every update with full transparency, just like I always have.
And behind the scenes, I’ve been pouring in countless hours (and a lot of capital) into what will soon become the Dividendology Database.
This will be a game-changing platform for income investors.
The full launch is on September 8th!
Stay tuned.
Here’s everything you’ll get as a paid Dividendology member 👇
📊 Full Access to the Dividendology Database
Built with now over $10,000 invested in tools and research, this powerful database tracks dividend stocks and alternative income assets like Covered Call ETFs, REITs, and BDCs.📈 The Dividend Growth Portfolio
A real-money portfolio built from scratch, focused on long-term wealth creation and building a rapidly growing stream of dividend income💸 The High Yield Portfolio
A real-money portfolio, designed to generate massive sustainable income with an average yield of 8%+📉 Running List of Undervalued Dividend Stocks
Updated regularly — stay ahead with a curated list of the most attractively valued dividend opportunities in the market🧠 In-Depth Research & Reports
Deep dives into dividend stocks and income strategies you won’t find on mainstream platforms
The full launch is almost here!
You can sign up to get everything here.
Check out these resources:
Tickerdata 🚀 (My automated spreadsheets and instant stock data for Google Sheets!)
Interactive Brokers 💰 (My favorite place to buy and sell stocks all around the world!)
Seeking Alpha 🔥 (Now currently running their Summer sale ($30 off! + 7day free trial)
The Dividend Report 📊 (Free Newsletter for Straightforward Dividend Stock News)
That’s all for now!
See you next week!
Dividendology 🚀




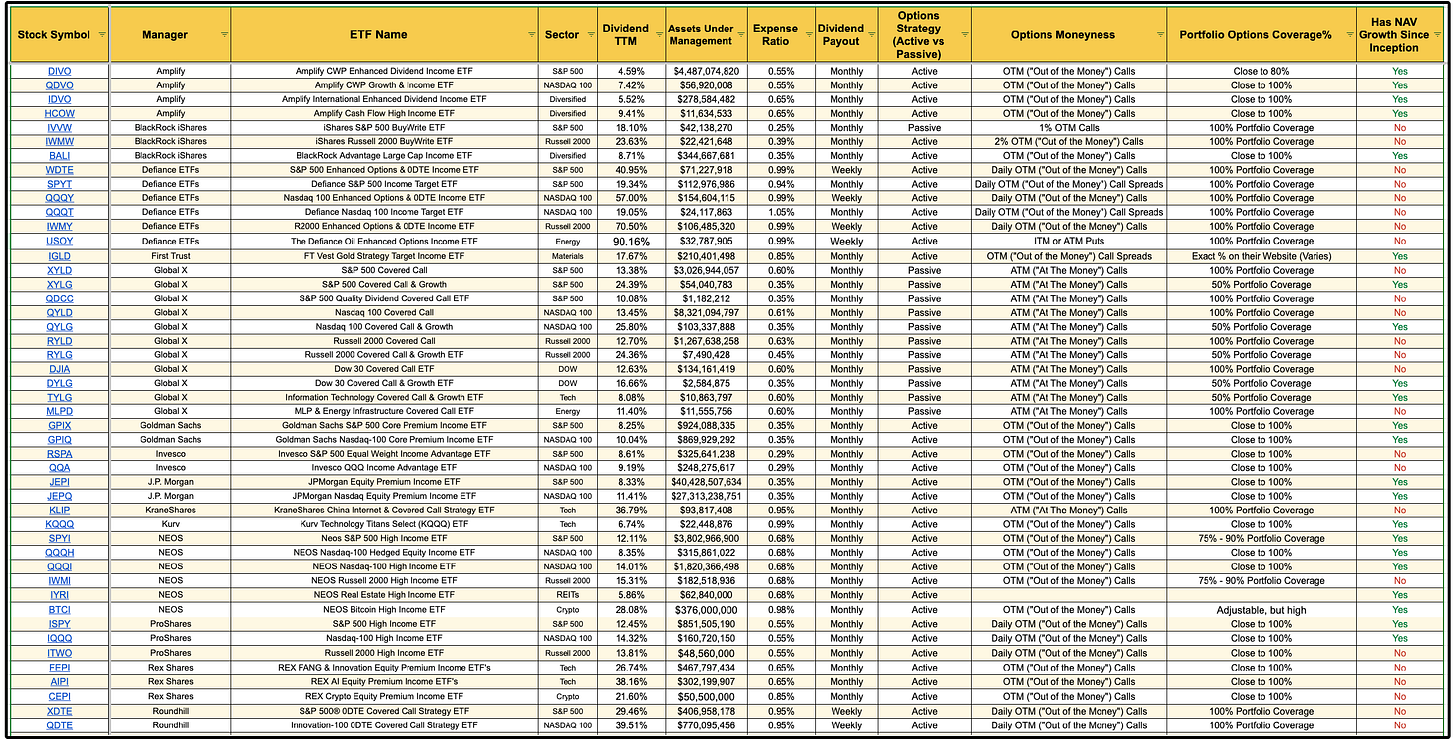
Which of the above Covered calls are in your portfolio?
Thanks