
⚠️ Is It Time To Abandon SCHD in 2026?
Time to Give Up? 🧩

For years, SCHD was touted as the King of Dividend ETFs.
But now?
Many seem to be turning against the fund.
Is it time to abandon SCHD in 2026?
What we’ll find will actually reveal that the market is in uncharted territory.
⚖️ Falling Behind in 2026
It’s no secret SCHD has been underperforming the S&P 500 on a total return basis lately.
SCHD: +1.83% 1 year total return
S&P 500: +12.66% 1 year total return
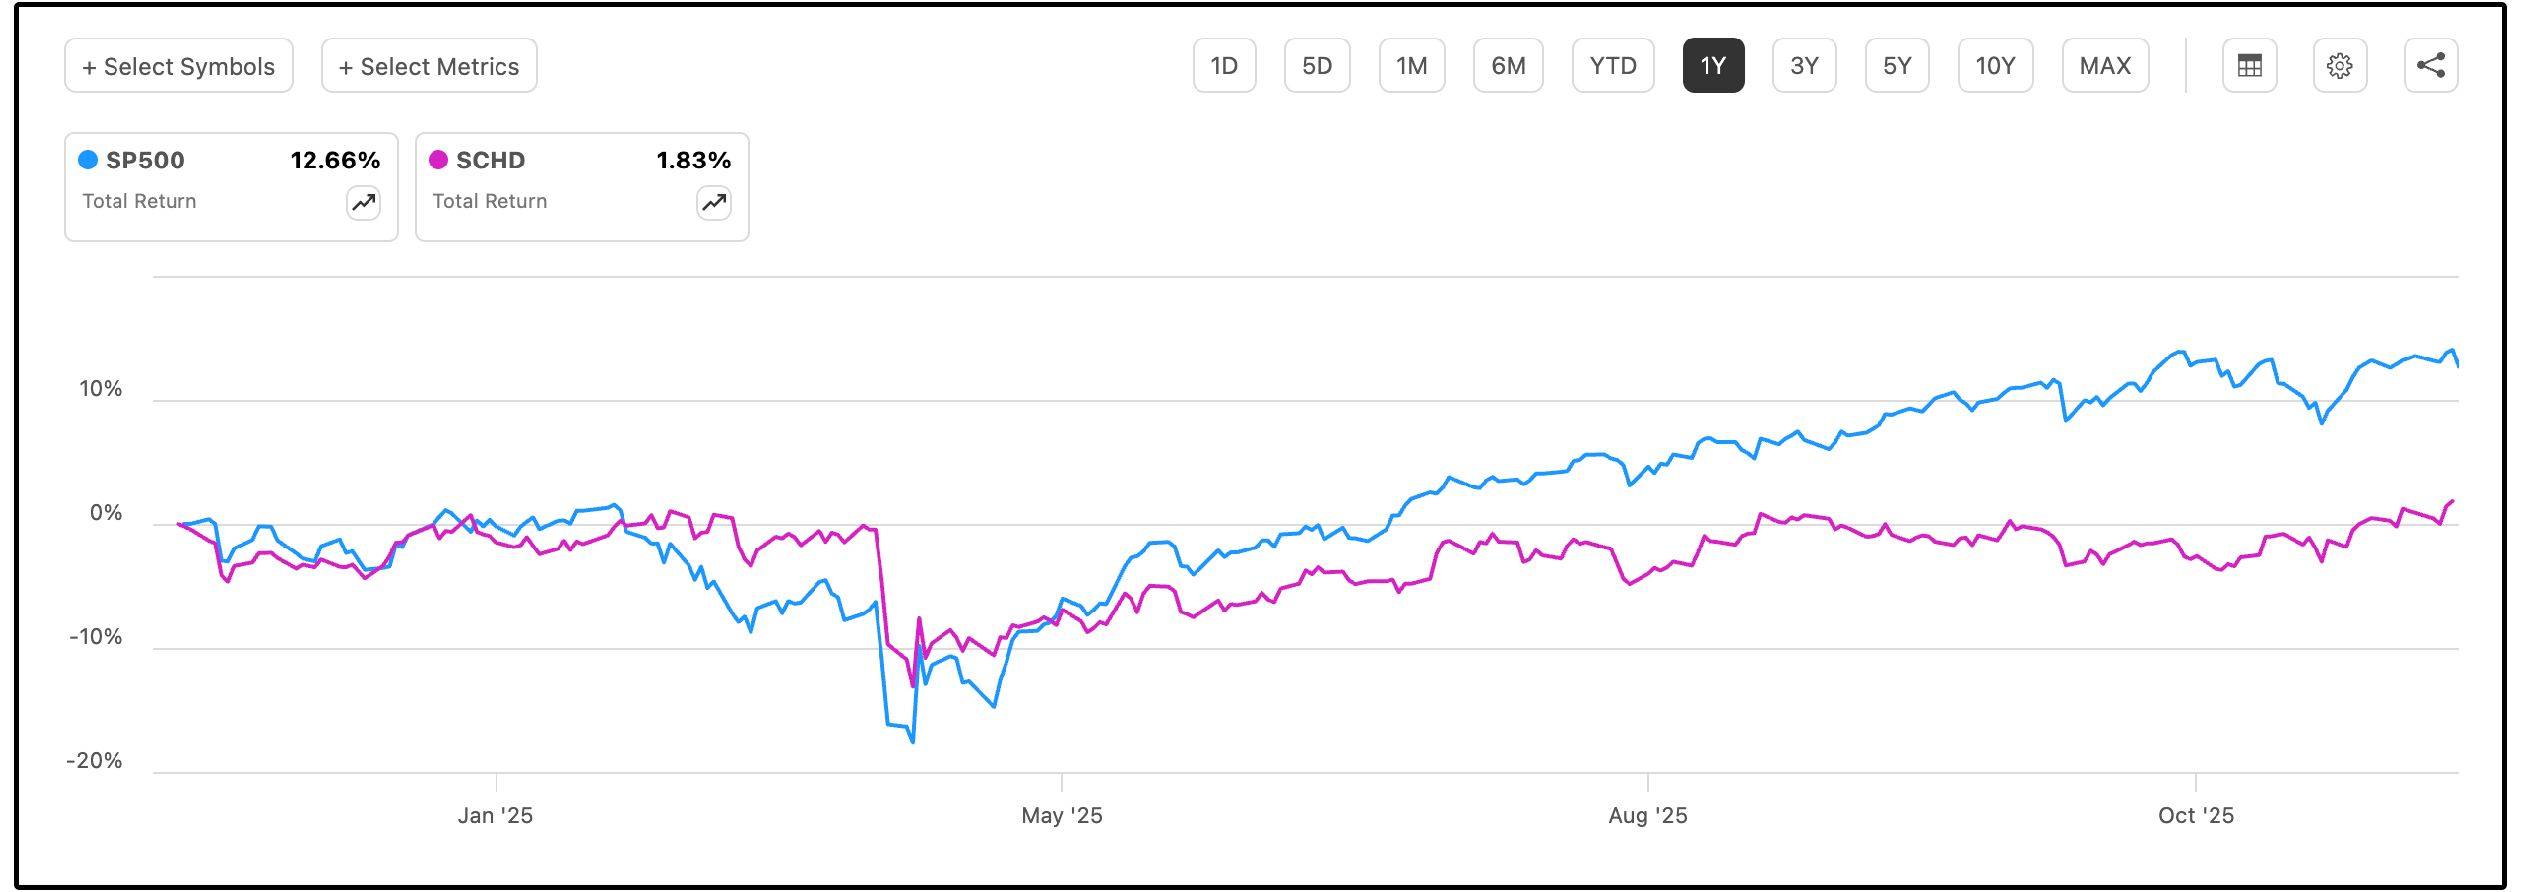
So what’s going on?
The answer is simple: Tech concentration.
The Magnificent 7 have driven the majority of the S&P 500’s returns over the past few years-
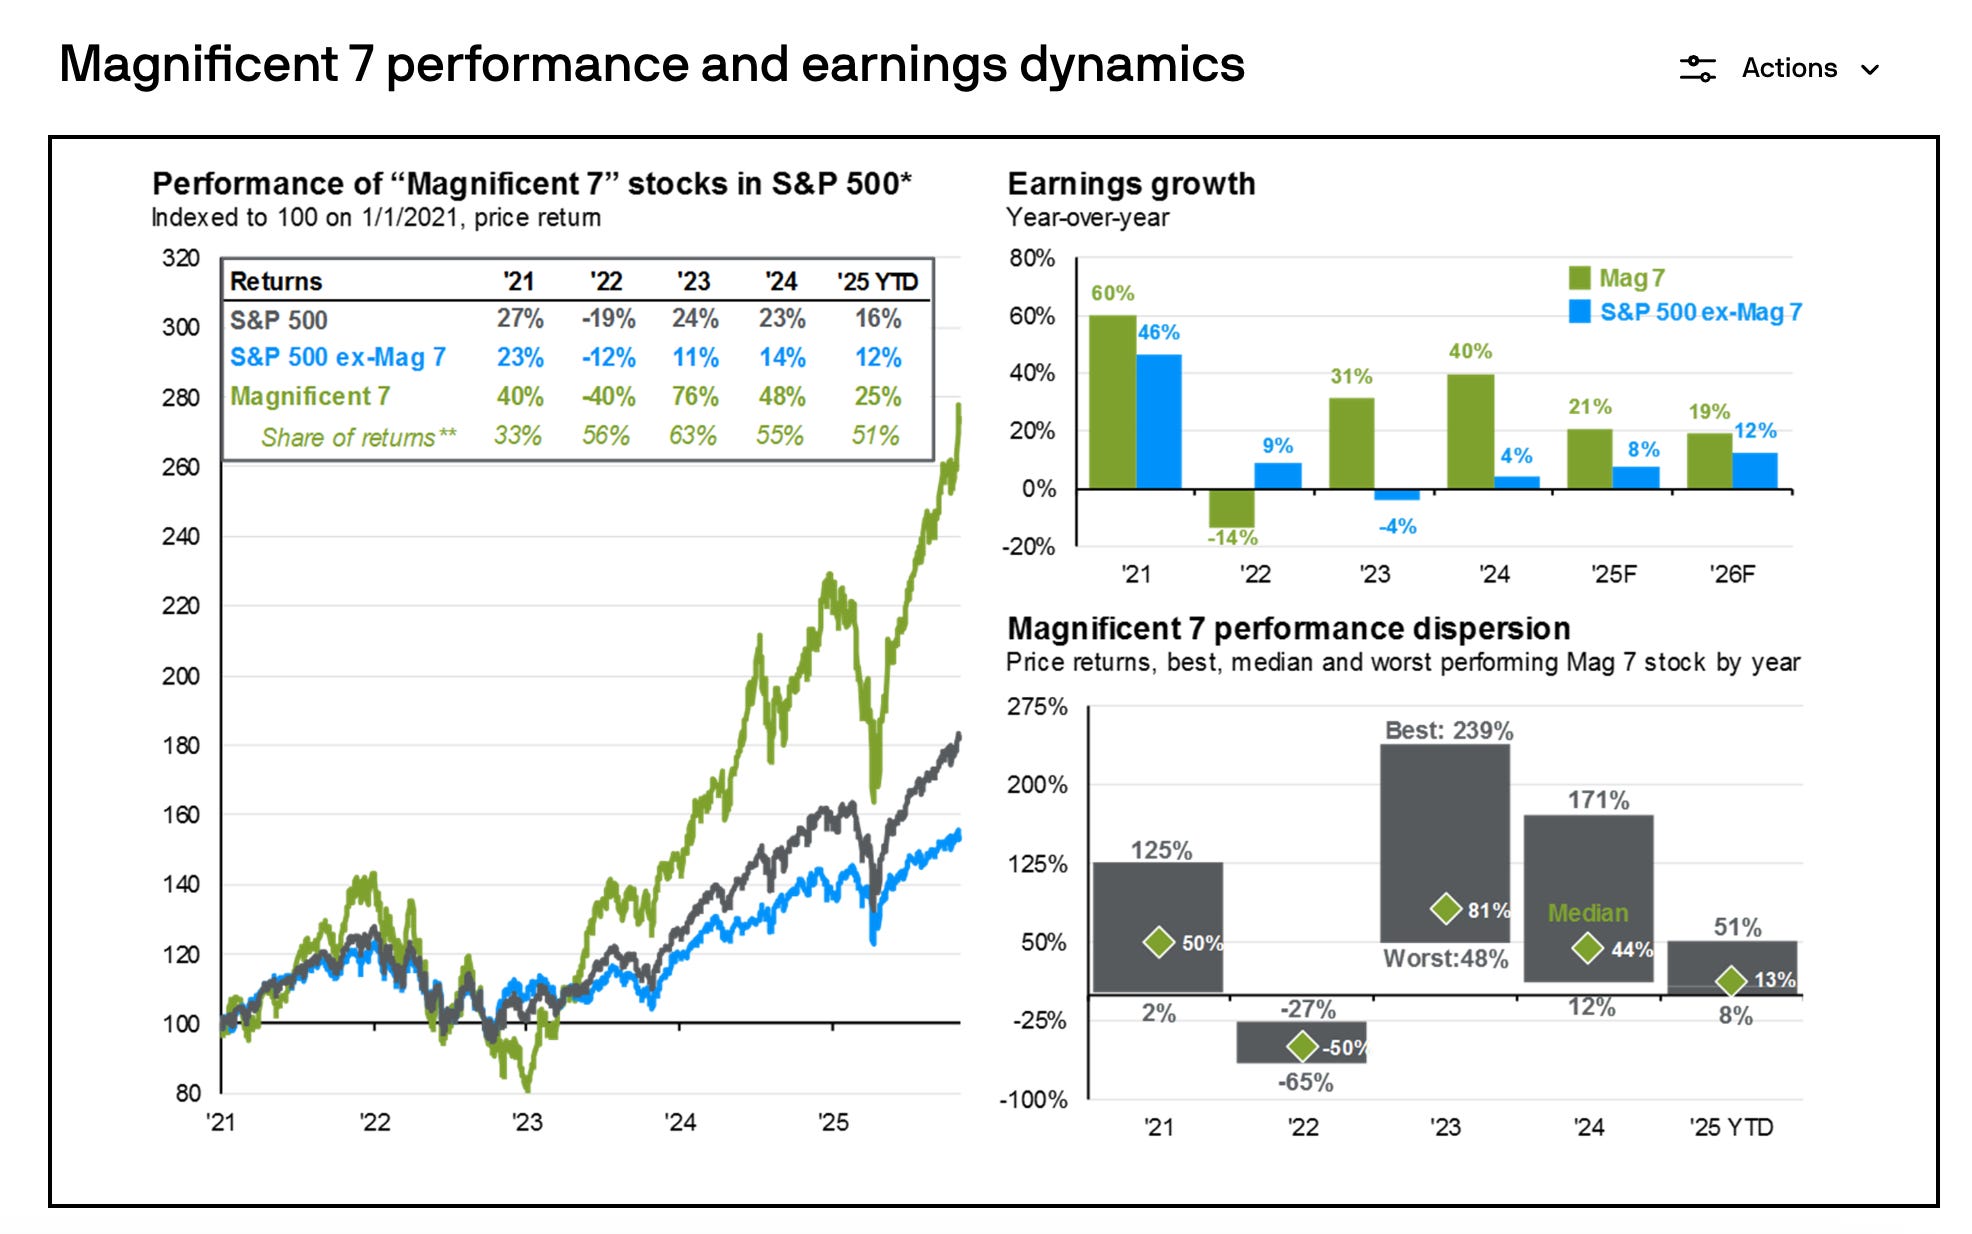
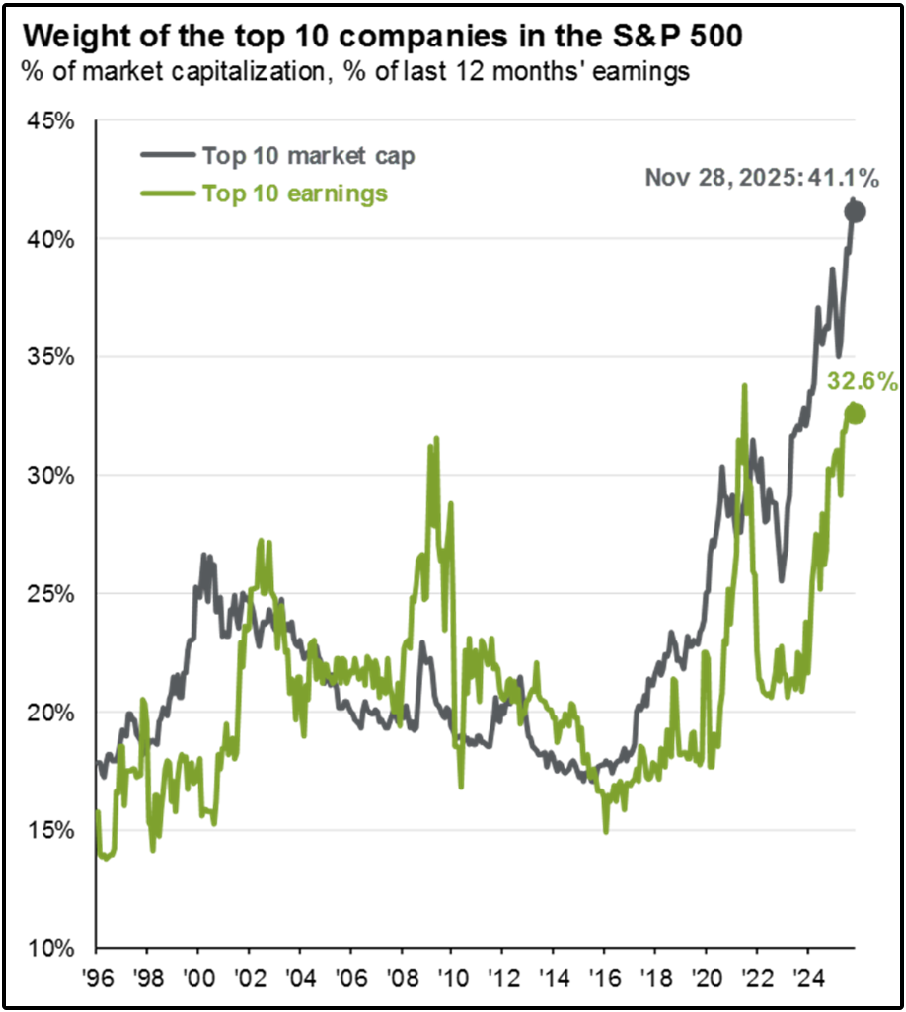
And today, the top 10 stocks now represent over 40% of the index’s total market cap.
SCHD, by design, has very little exposure to high-growth tech-
Which explains the relative underperformance recently.
But this is actually a feature by design for SCHD.
⚙️ Methodology
A common mistake investors make is treating SCHD like an actively managed stock portfolio.
Fund managers don’t select the holdings in SCHD.
When you buy SCHD, you’re buying a rules-based system.
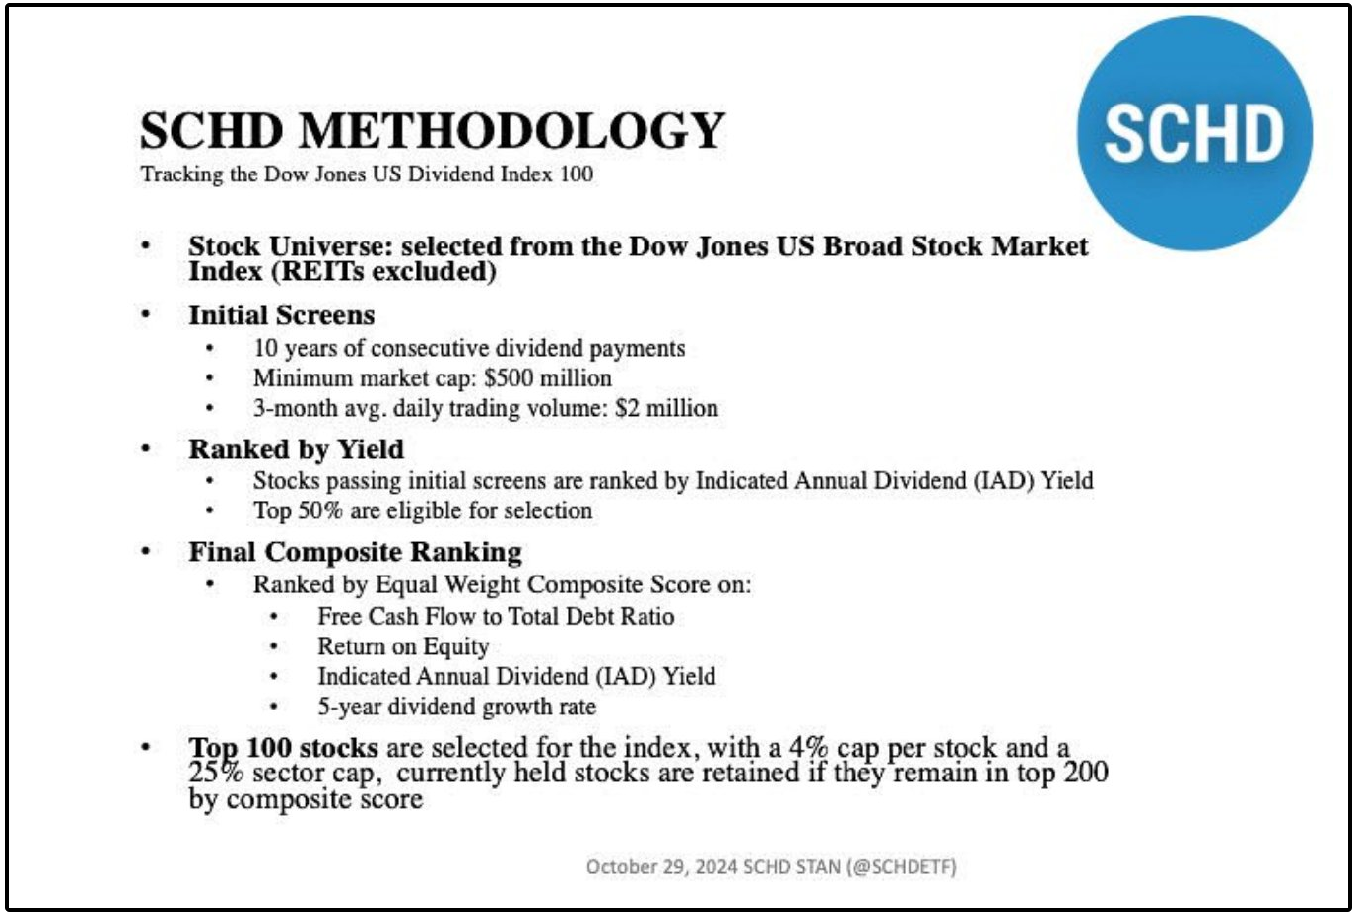
SCHD goes through their annual reconstitution every year in March, which is when this methodology is implemented.
Due to the nature of this methodology, the fund will cycle out stocks that have seen a large run up in their share price (which causes their starting yield to go lower)-
And then replace them with higher yielding stocks.
This is the exact methodology that has allowed them to achieve:
11% annual dividend growth since inception
12% annual dividend growth since 2019
High dividend growth combined with the share price staying stagnant over the last couple of years has led to SCHD’s starting yield climbing to near 4%.
This combination of yield and dividend growth gives them a very attractive ‘Chowder Score’:
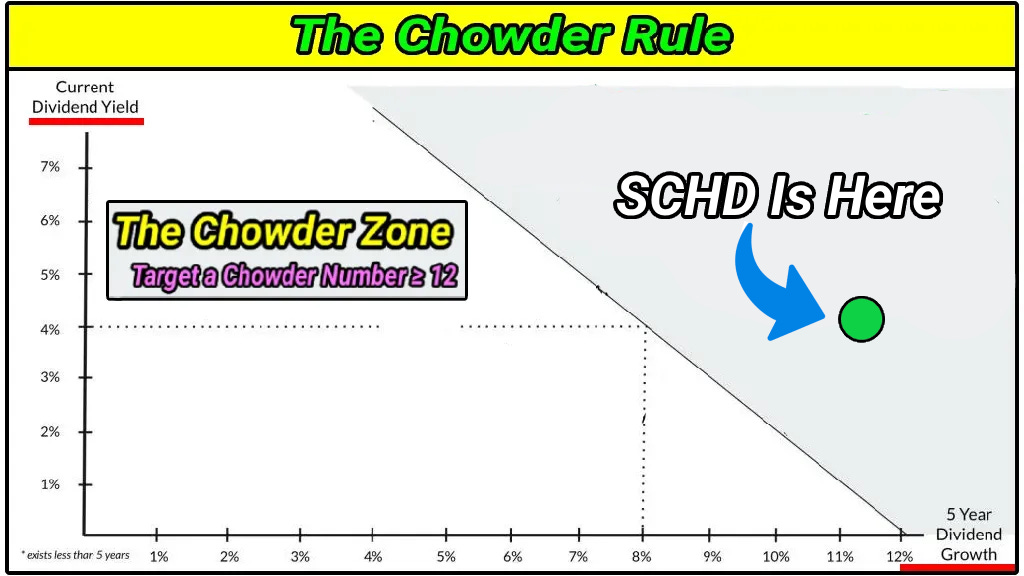
Obviously this is impressive, but it doesn’t make the recent underperformance feel much better.
So… Will the underperformance continue?
🚨 Uncharted Territory (Do Not Miss This!)
We see mentions of how were potentially in an AI bubble often.
Regardless of if that’s true or not, I do know the market is in uncharted territory, and not in a good way.
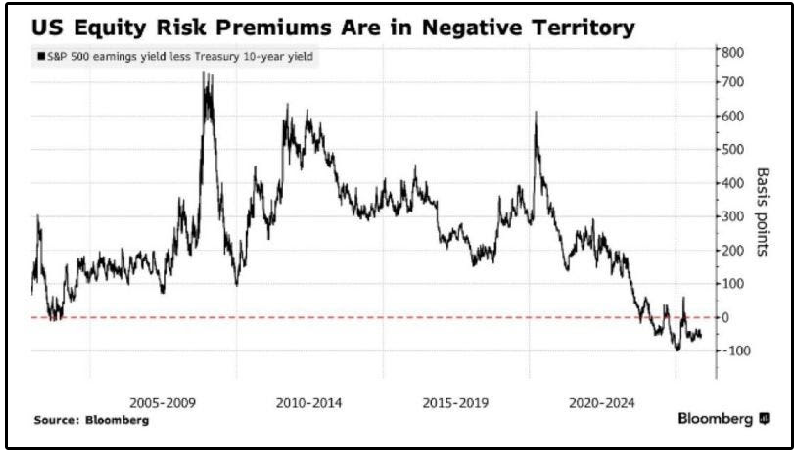
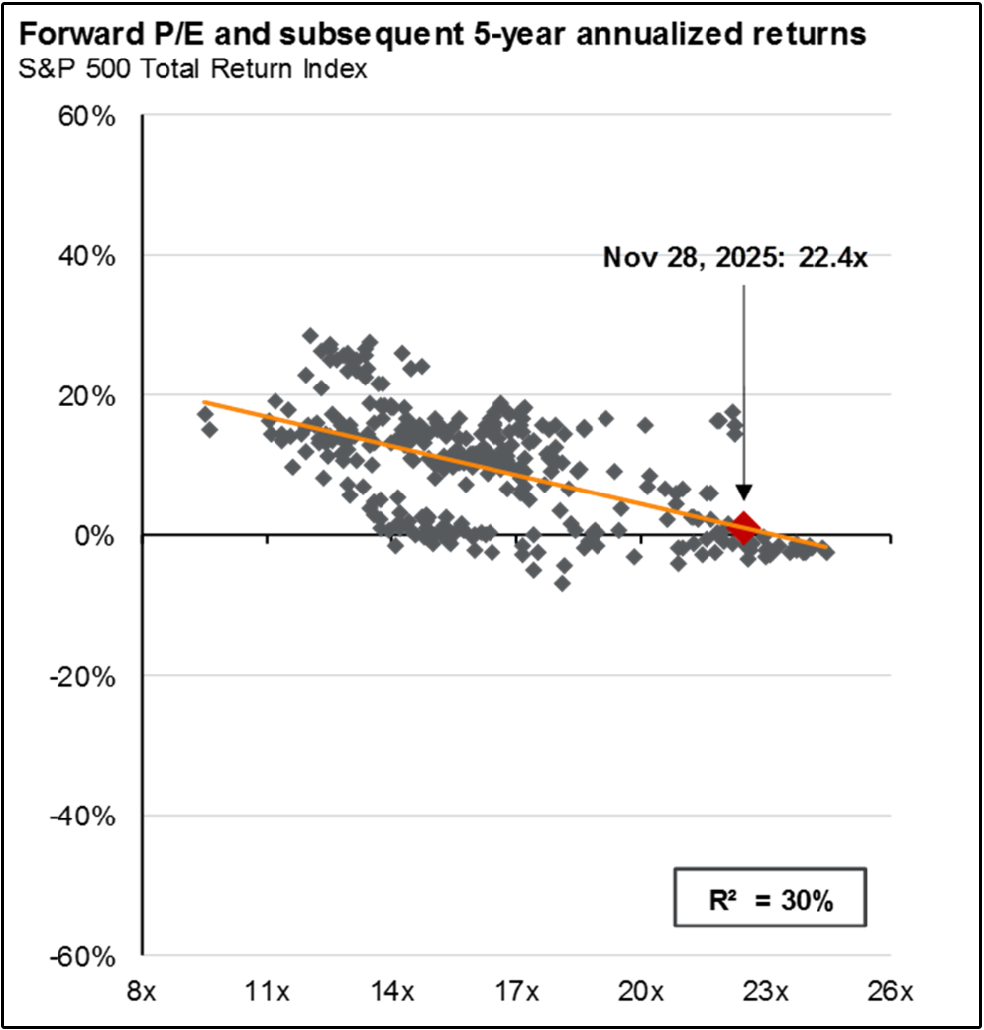
This chart above is the most important chart you will see this week, or maybe even this month.
It shows the U.S. Equity Risk Premium (ERP), more specifically:
S&P 500 earnings yield minus the 10-year Treasury yield
In simple terms, it answers one critical question:
How much extra return are investors being paid to own stocks instead of “risk-free” government bonds?
Right now, according to this chart, the answer is:
Almost nothing or even negative.
The average investor has no idea of just how radical that is.
Let’s make sure we understand exactly what this means.
⚠️ Negative US Equity Risk Premiums
To start, we must understand the earnings yield and 10-year treasury yield.
Earnings Yield = inverse of the P/E ratio
(If the S&P 500 trades at a 20x P/E, the earnings yield is 5%)
10-year Treasury Yield = what you earn lending money to the U.S. government
The equity risk premium is the spread between the two.
Historically:
Stocks usually offer a 3–5% premium over Treasuries
That premium compensates investors for volatility, drawdowns, and uncertainty
So what does it mean if the spread is negative?
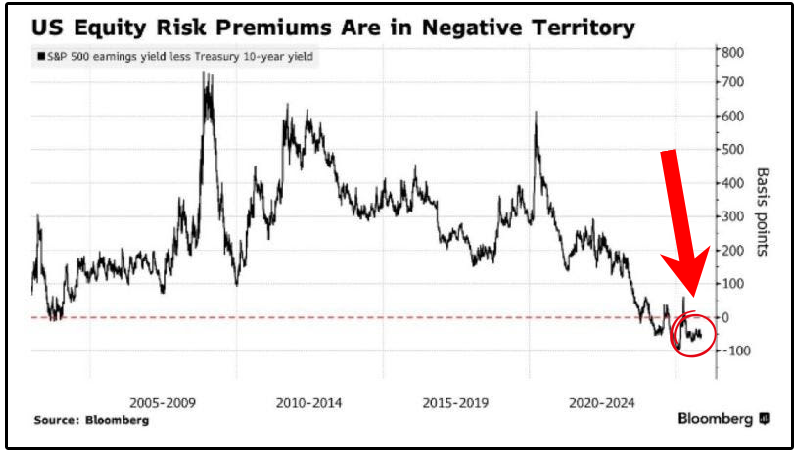
The chart shows the equity risk premium has fallen to zero or below.
That means:
Investors are not being paid extra to take equity risk
Stocks are offering similar or worse yield than Treasuries
Valuations are very stretched relative to interest rates
In other words:
You’re taking more risk… for less reward.
Look at prior periods when the equity risk premium approached zero:
Late 1990s (dot-com bubble)
Mid-2000s (pre-financial crisis)
Brief moments during speculative market surges
When this has happened in the past, forward returns have been non-existent, and even negative in many cases.
🧩 What’s This Mean for SCHD?
SCHD has underperformed during the AI boom and will continue to underperform as long as AI stocks surge.
But investors are extremely short sighted, and nearly all investors suffer from recency bias-
And SCHD’s historical outperformance has always come during a slow growing or downward market.
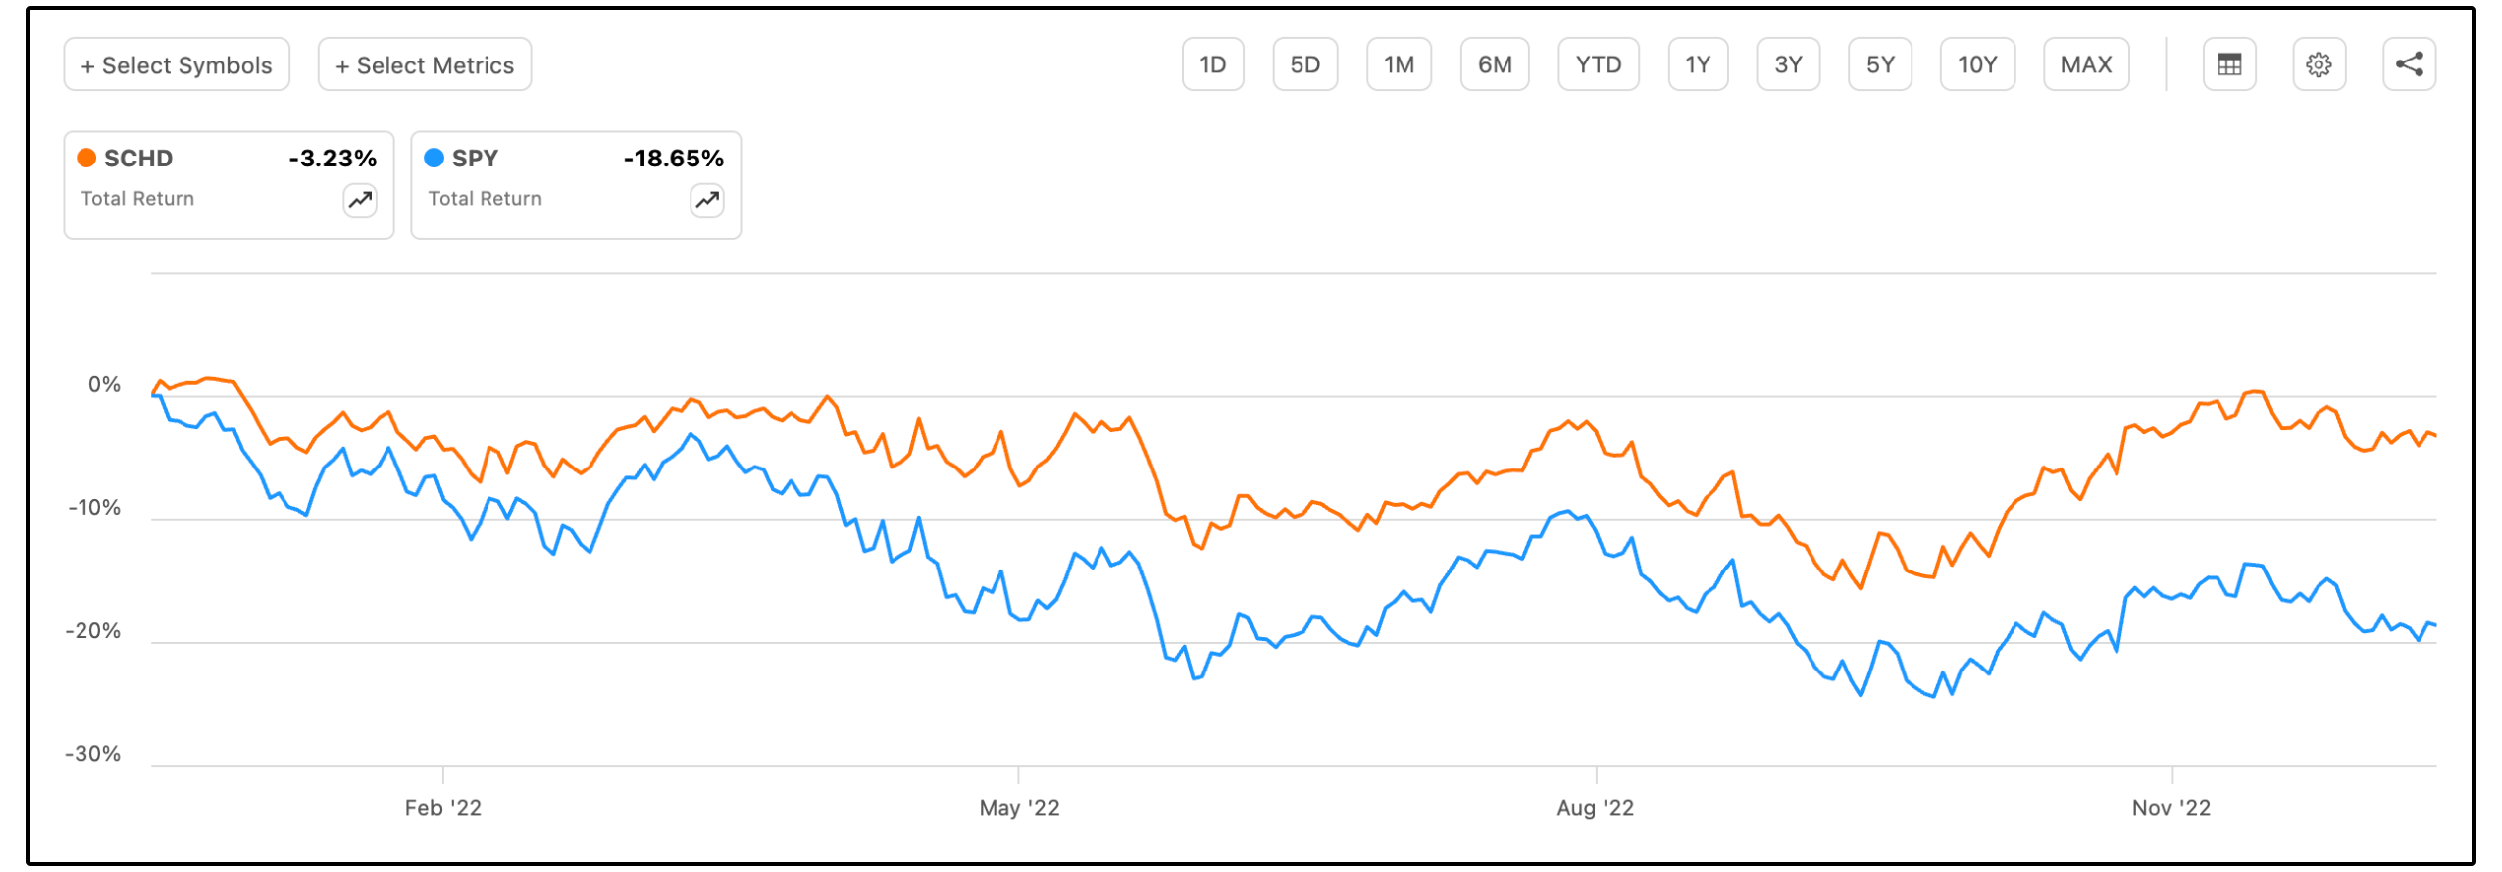
For example, SCHD outperformed by wide margin when the S&P 500 saw a substantial drop in 2022.
But what most still don’t seem to realize?
The longterm outperformance potential of SCHD.
💡What Most Investors Still Don’t Realize
SCHD itself has only existed since 2011.
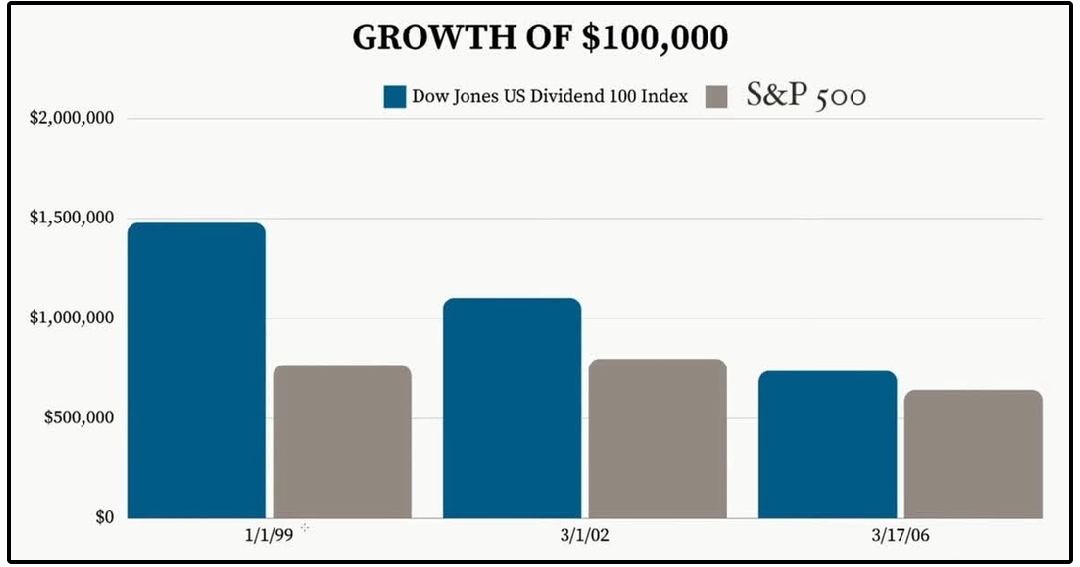
But the index it tracks, the Dow Jones U.S. Dividend 100 Index, has backtested data going back much further.
And this is where things get interesting.
According to historical backtests from sources including S&P Global, Schwab, Yahoo Finance, and Seeking Alpha:
Dow Jones U.S. Dividend 100 Index (1999–2025): ~10.5% annualized total return
S&P 500 (1999-2025): ~8.2% annualized total return
That means over multiple full market cycles, including:
The dot-com bubble
The Global Financial Crisis
The COVID crash
The post-2020 rate shock
A dividend-focused, rules-based strategy quietly outperformed the broad market.
And this outperformance was true over multiple periods of time.
🧭 What You Should Do
This outperformance from the underlying index of SCHD didn’t happen in straight lines.
In fact:
The Dividend 100 Index lagged badly during speculative bull markets
It excelled when valuations normalized or contracted
Right now, valuations are stretched.
So if you want to know what to do with SCHD, you must ask yourself this question:
“Do I think the AI bull market will continue for years to come? Or do I want to hedge for a potential market pullback, while continuing to get reliable, growing income?”
For me, the answer likely lies somewhere in the middle-
But to simply write off SCHD due to a few years of underperformance is a testament as to why retail investors often perform so poorly, especially when it has such a long track record of exceptional performance.
Every investment ever has and will go through periods of underperformance.
SCHD is no different.
Its long-term record wasn’t built by winning every year, but by showing up across cycles.
And in a market where:
Equity risk premiums are near zero
Valuations are elevated
Concentration risk is extreme
The investments that feel the most uncomfortable at market extremes are often the ones that matter most over full cycles.
Next week, we will be adding our 2nd position to our Dividend Growth Portfolio.
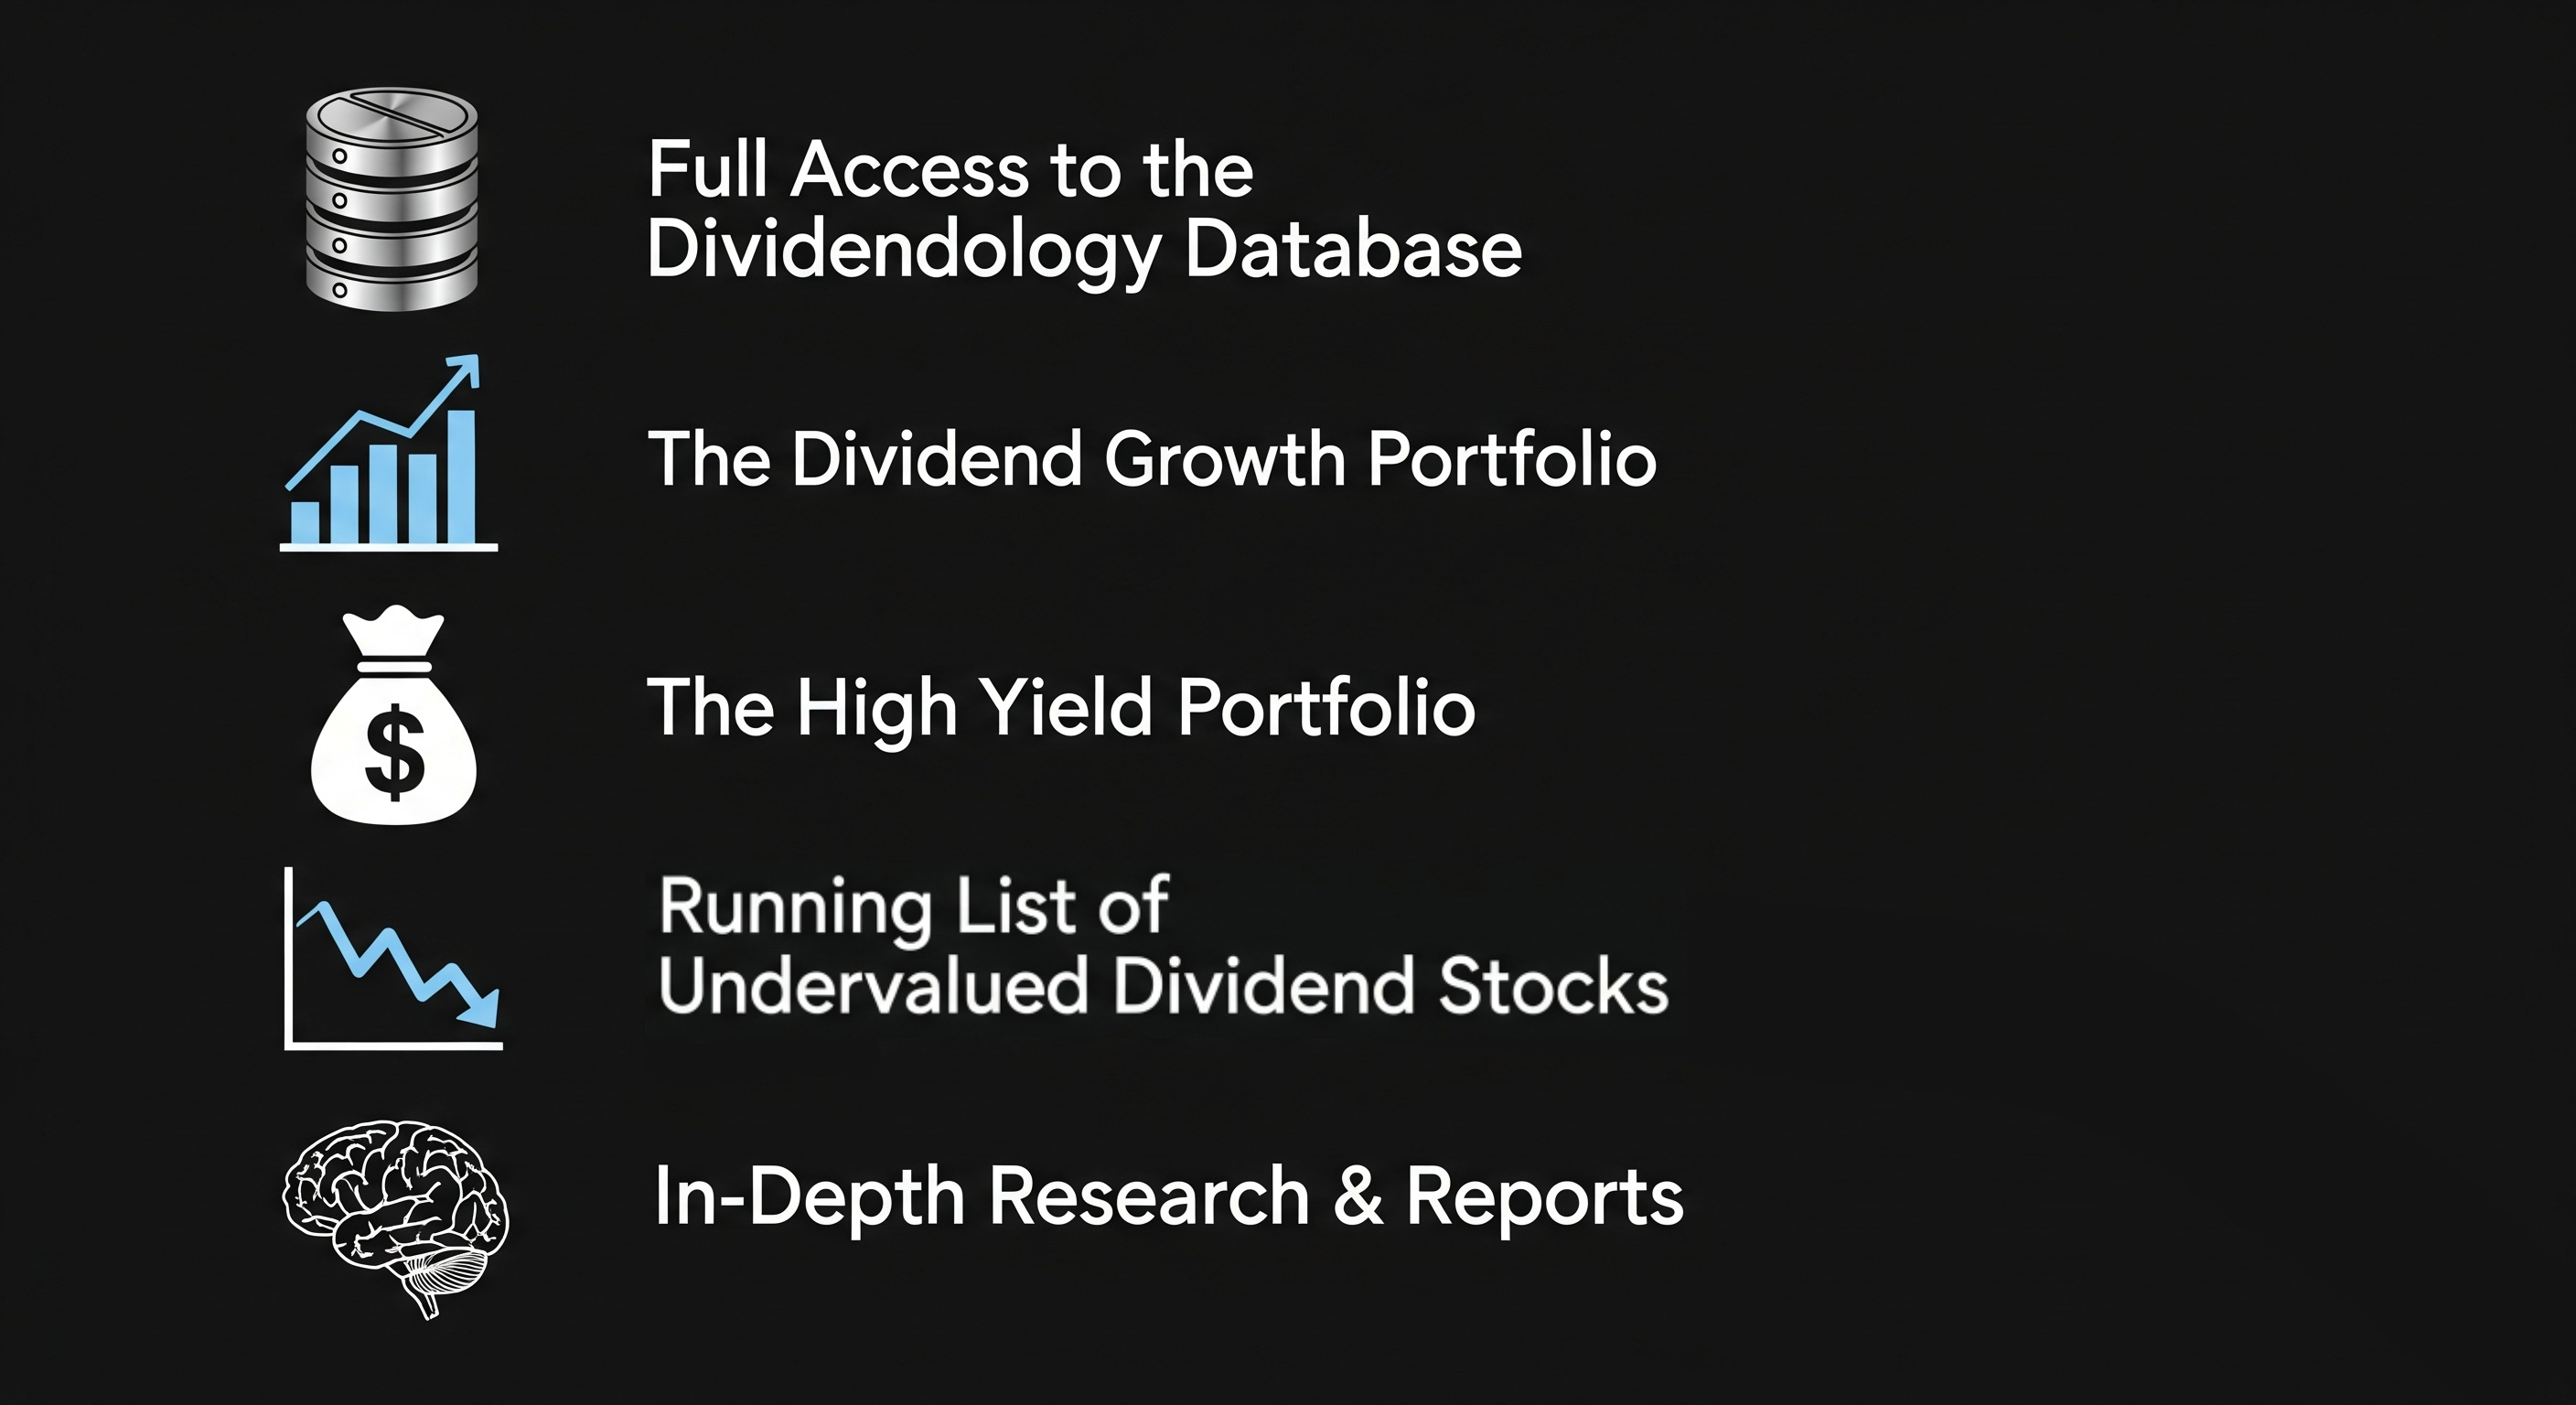
If you’d like to get access to our High yield and Dividend Growth Portfolios, as well as all the features mentioned below, you can do here:
Dividendology will continue to compound the value it provides immensely in 2026.
The best is yet to come!
Dividendology
Check out these resources:
Tickerdata 🚀 (My automated spreadsheets and instant stock data for Google Sheets!)
Interactive Brokers 💰 (My favorite place to buy and sell stocks all around the world!)
Seeking Alpha 🔥 ($30 off! + 7 day free trial)
The Dividend Report 📊 (Free Newsletter for Straightforward Dividend Stock News)
Good framing. SCHD is a rules-based defensive tilt, so it will lag in a tech-led momentum tape and tend to shine when valuations compress. The real decision is whether you want concentration exposure or a cycle hedge plus dividend growth.
Huge SCHD fan here, and great article. I'm curious about this specific line: Dow Jones U.S. Dividend 100 Index (1999–2025): ~10.5% annualized total return. Could you provide the source please that shows this, and possibly what was the dividend growth rate % throughout 1999 - 2010 before SCHD existed ?