

Every month, I compile data on the dividend stocks with the most upside based on Wall Street analysts price targets.
Members will get access to the full list every month, as well as all other Dividendology features.
This month, only 54 stocks made the list.
Let’s dive in.

1. 🗼 American Tower (AMT)
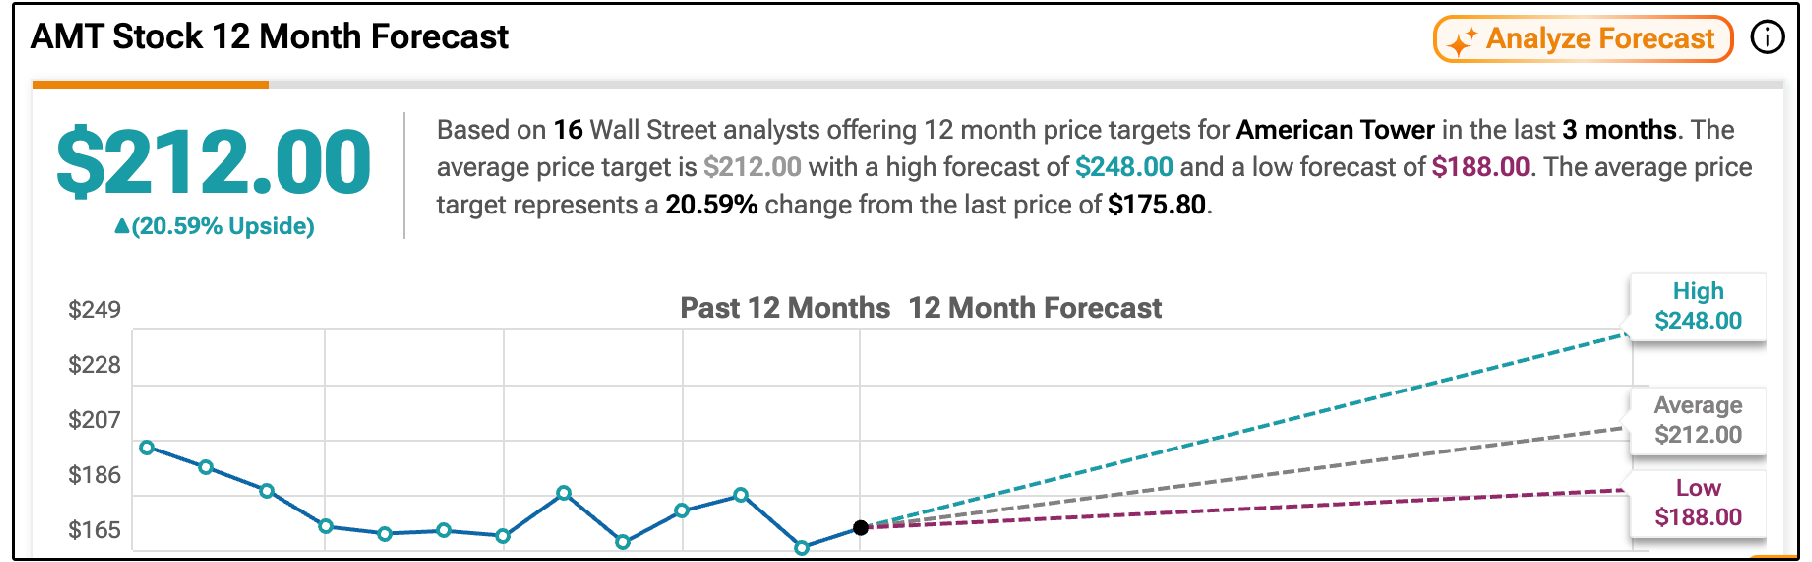
Wall St. Price Target: $212.00 | Upside: 20.59%
American Tower is one of the largest infrastructure REITs in the world, owning approximately 150,000 communications sites across the United States and international markets.

The business model overall is relatively simple.
Wireless carriers such as AT&T, Verizon and T-Mobile lease space on American Tower’s infrastructure to install their communications equipment.
These leases are generally long-term, include contractual rent increases and produce recurring revenue largely independent of consumer spending.
The economics become particularly attractive when multiple carriers occupy the same tower.
Most of the tower’s operating costs are already covered by the first tenant, which is a huge advantage, as this means additional tenants can generate revenue with very little additional expense.
This gives American Tower a scalable business model with high incremental margins.
The primary long term growth driver is the increase in mobile data consumption.
As consumers stream more video and carriers expand their 5G networks, additional equipment must be installed to increase network capacity.
American Tower’s second-quarter results verify this thesis.
Total property revenue increased 6.3% to $2.69 billion, adjusted EBITDA increased 3.2%, and AFFO attributable to shareholders increased 3.8%.
Management also raised its 2026 outlook, with AFFO per share now expected to reach between $11.00 and $11.17.
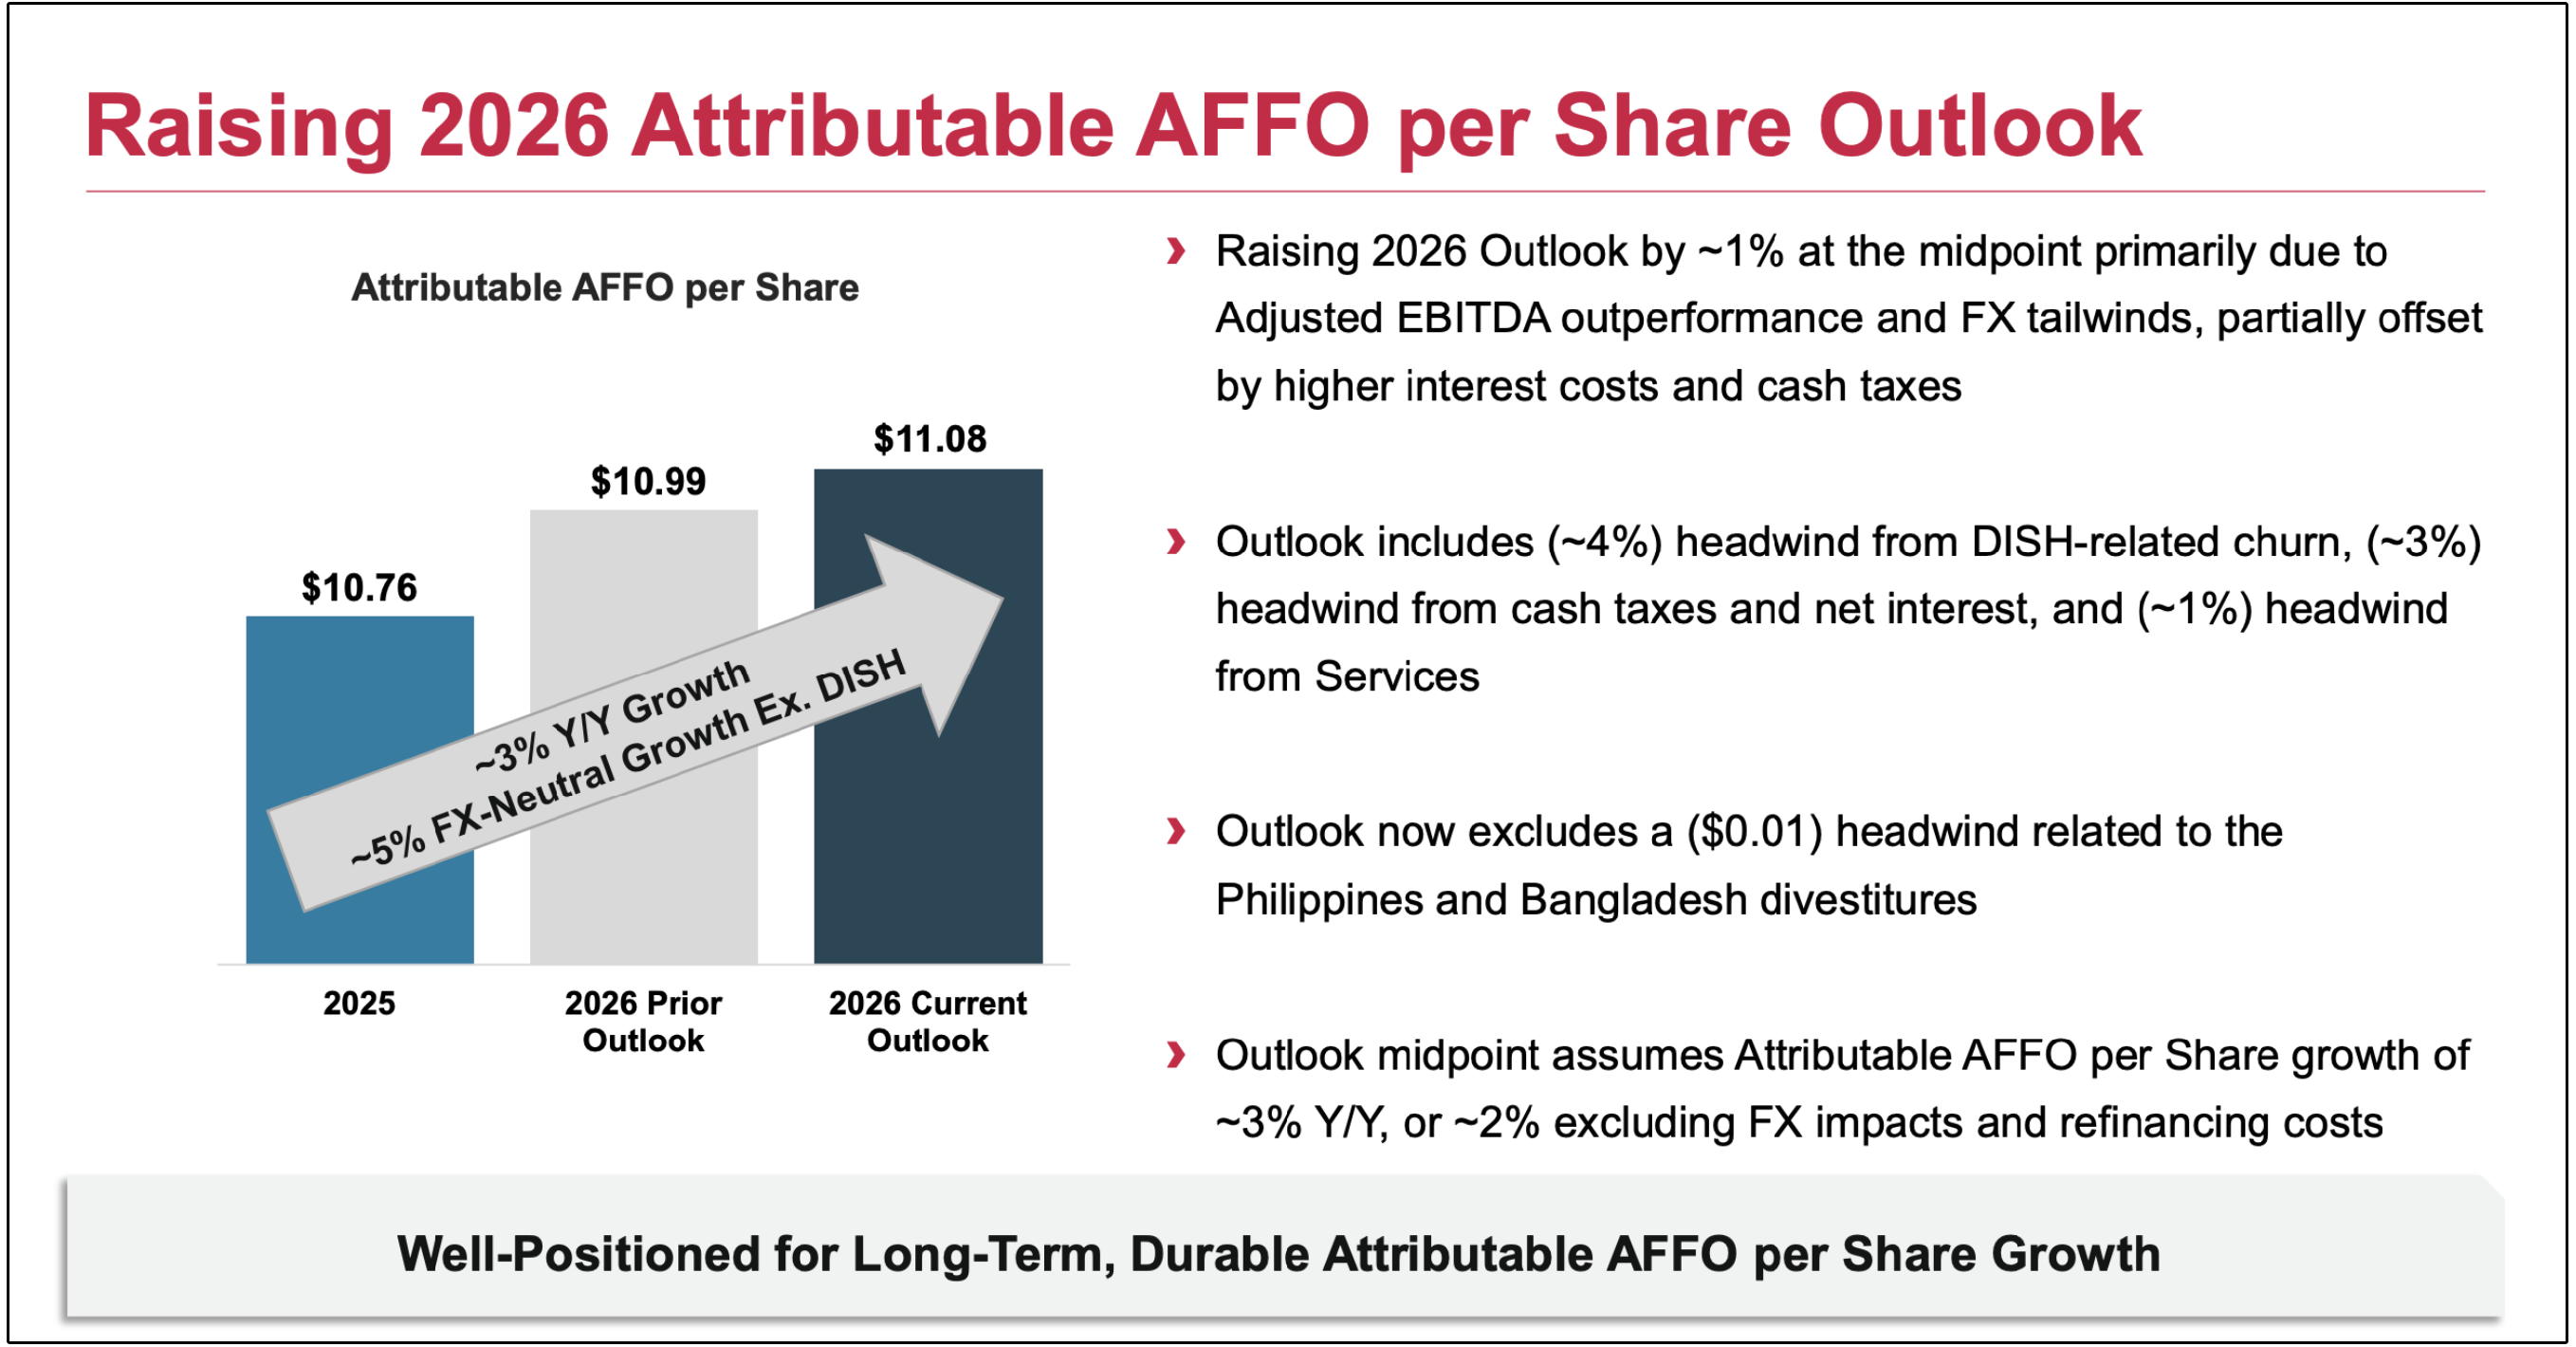
However, AFFO per share grew only approximately 1% after excluding currency movements.
The largest headwind was customer churn from DISH, which reduced organic tenant-billings growth by approximately 1.7 percentage points.
When the effects of DISH churn and higher refinancing costs are excluded, management estimates that AFFO per share grew by more than 5% on a currency-neutral basis.
AFFO per share is projected to grow at roughly 4.7% annually through the year 2030.
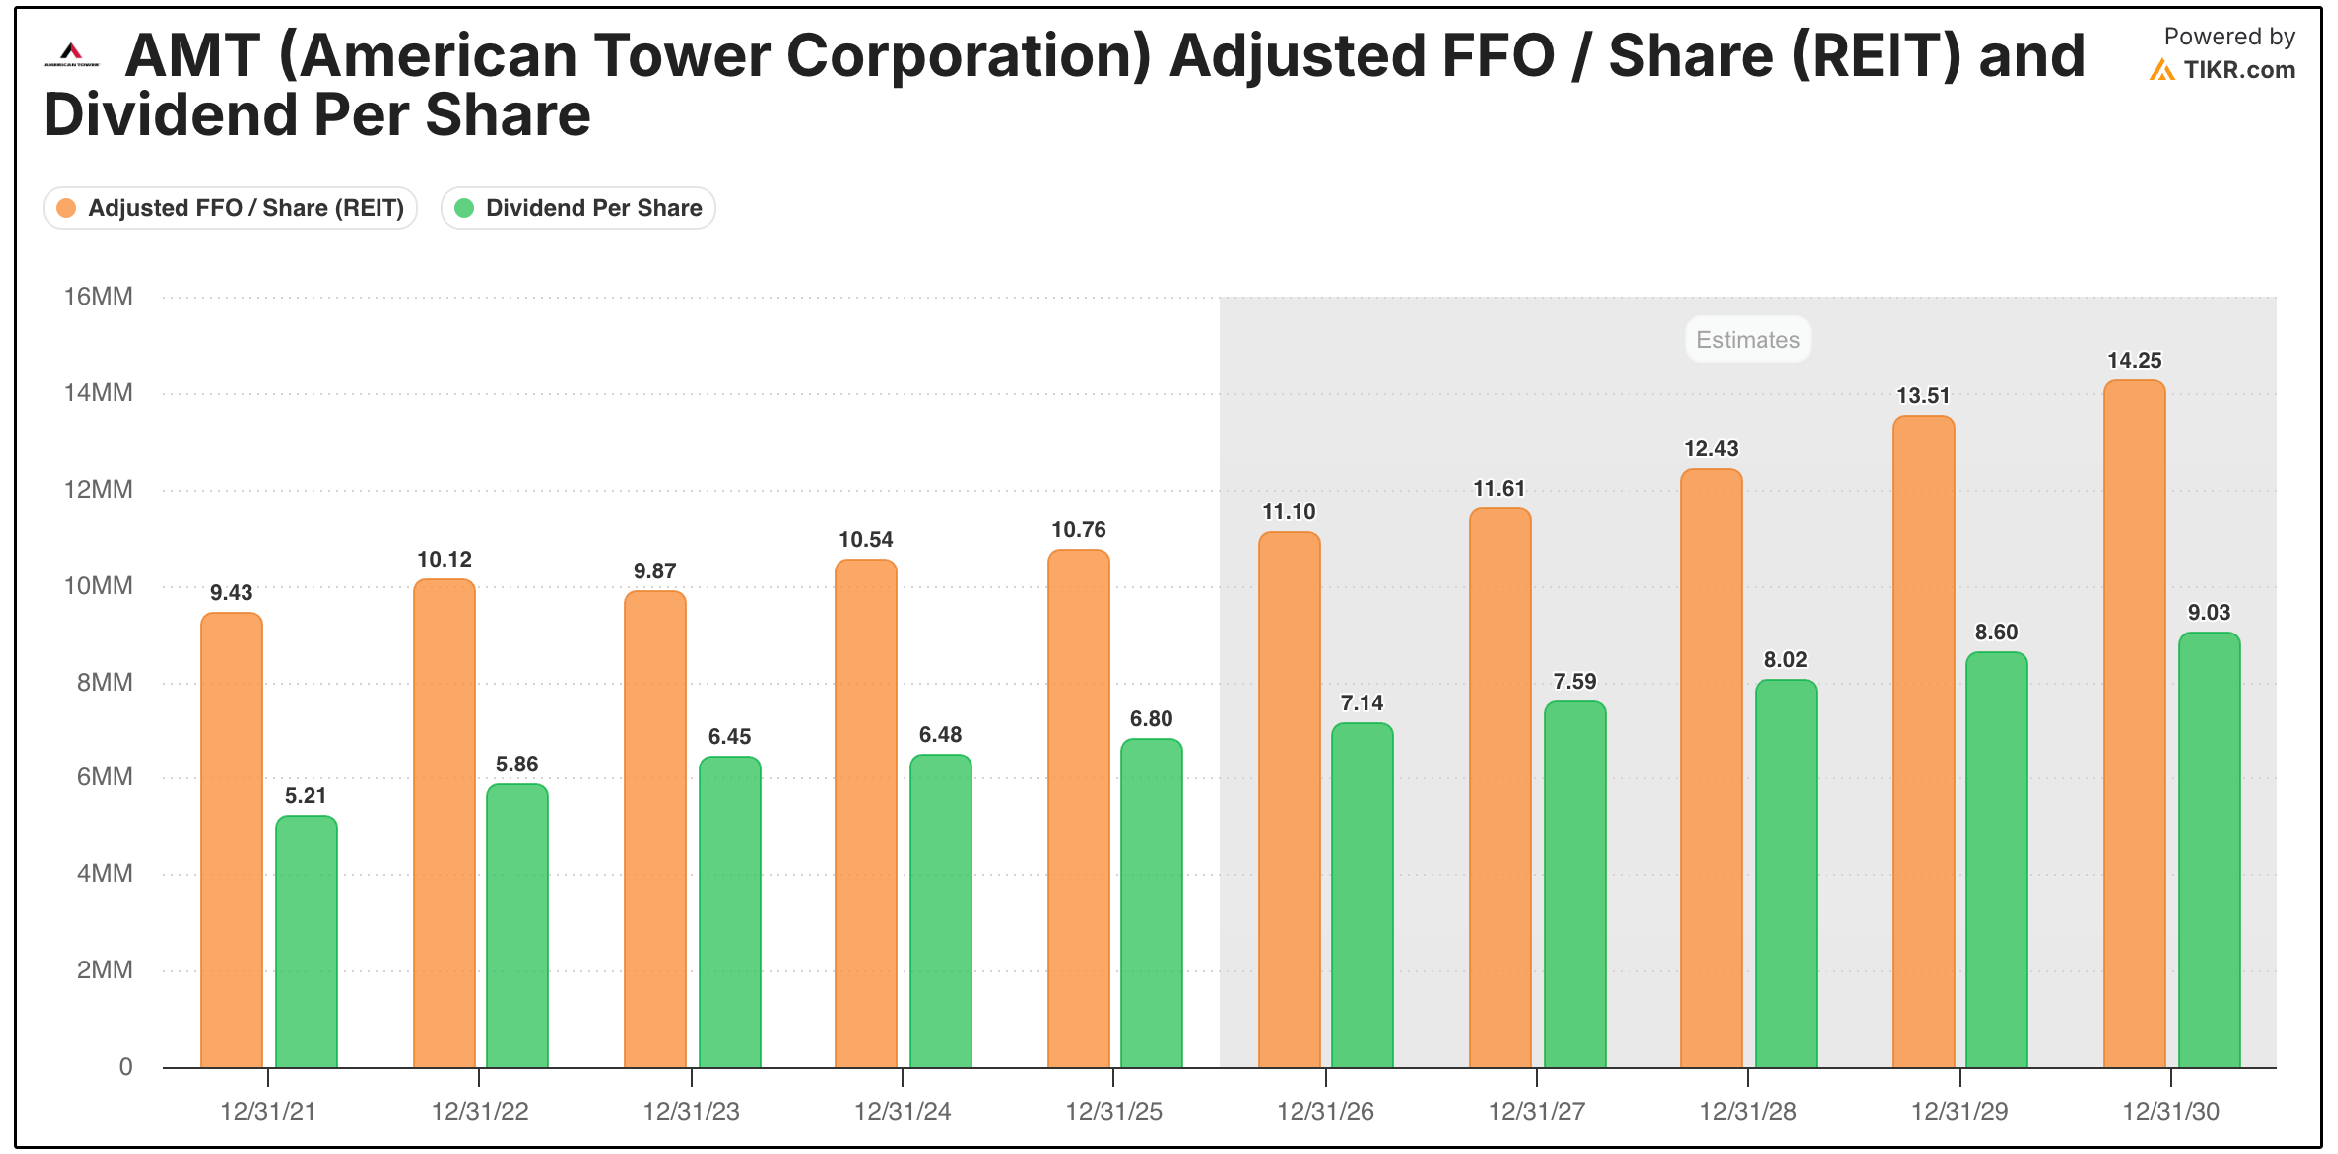
This REIT now yields 4.07%, with very strong dividend coverage with the AFFO payout ratio at just around 65%.
The underlying business is clearly performing better than the headline growth rate indicates.
American Tower also owns CoreSite, a collection of highly interconnected U.S. data centers.
CoreSite’s cash revenue increased approximately 12%, while management raised its full-year data-center growth forecast from 13% to approximately 15%.
CoreSite completed more new leasing during the quarter than it did during all of 2021, with nine of the world’s ten largest AI companies now deployed within its facilities.
This gives American Tower a second growth engine beyond traditional wireless towers.
American Tower trades at a 15.6x AFFO per share multiple, down nearly 50% over the last 5 years.
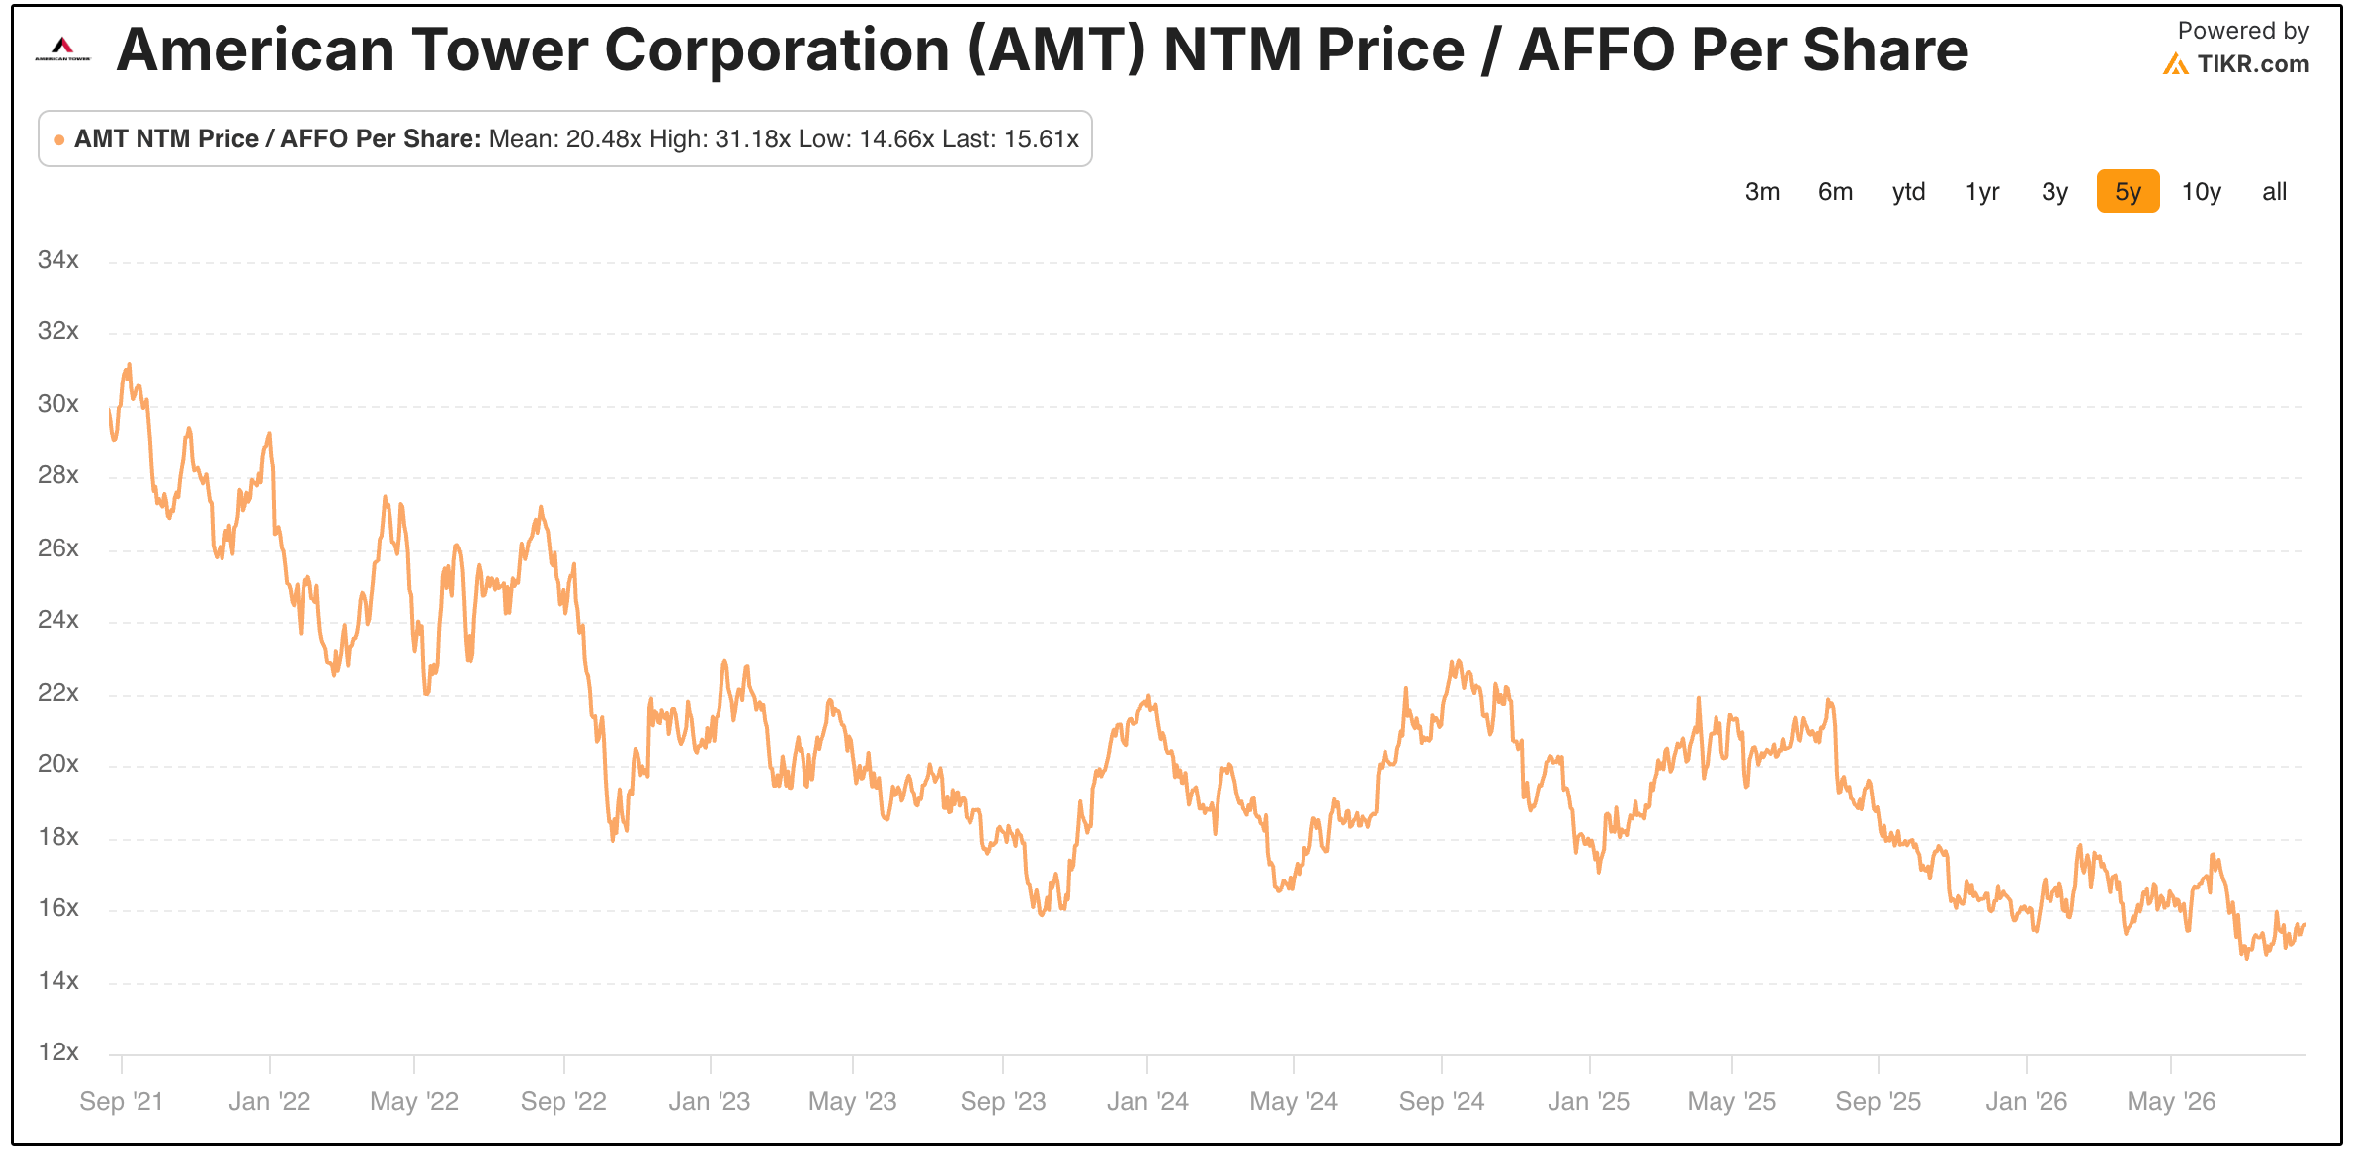
Its annualized $7.16 dividend produces a yield of approximately 4.1% and represents around 65% of projected AFFO, leaving the distribution reasonably well covered.
The primary risk that bears would point out is the balance sheet.
Net leverage remains elevated at 4.9 times, making refinancing costs and long-term interest rates significant for future AFFO growth.
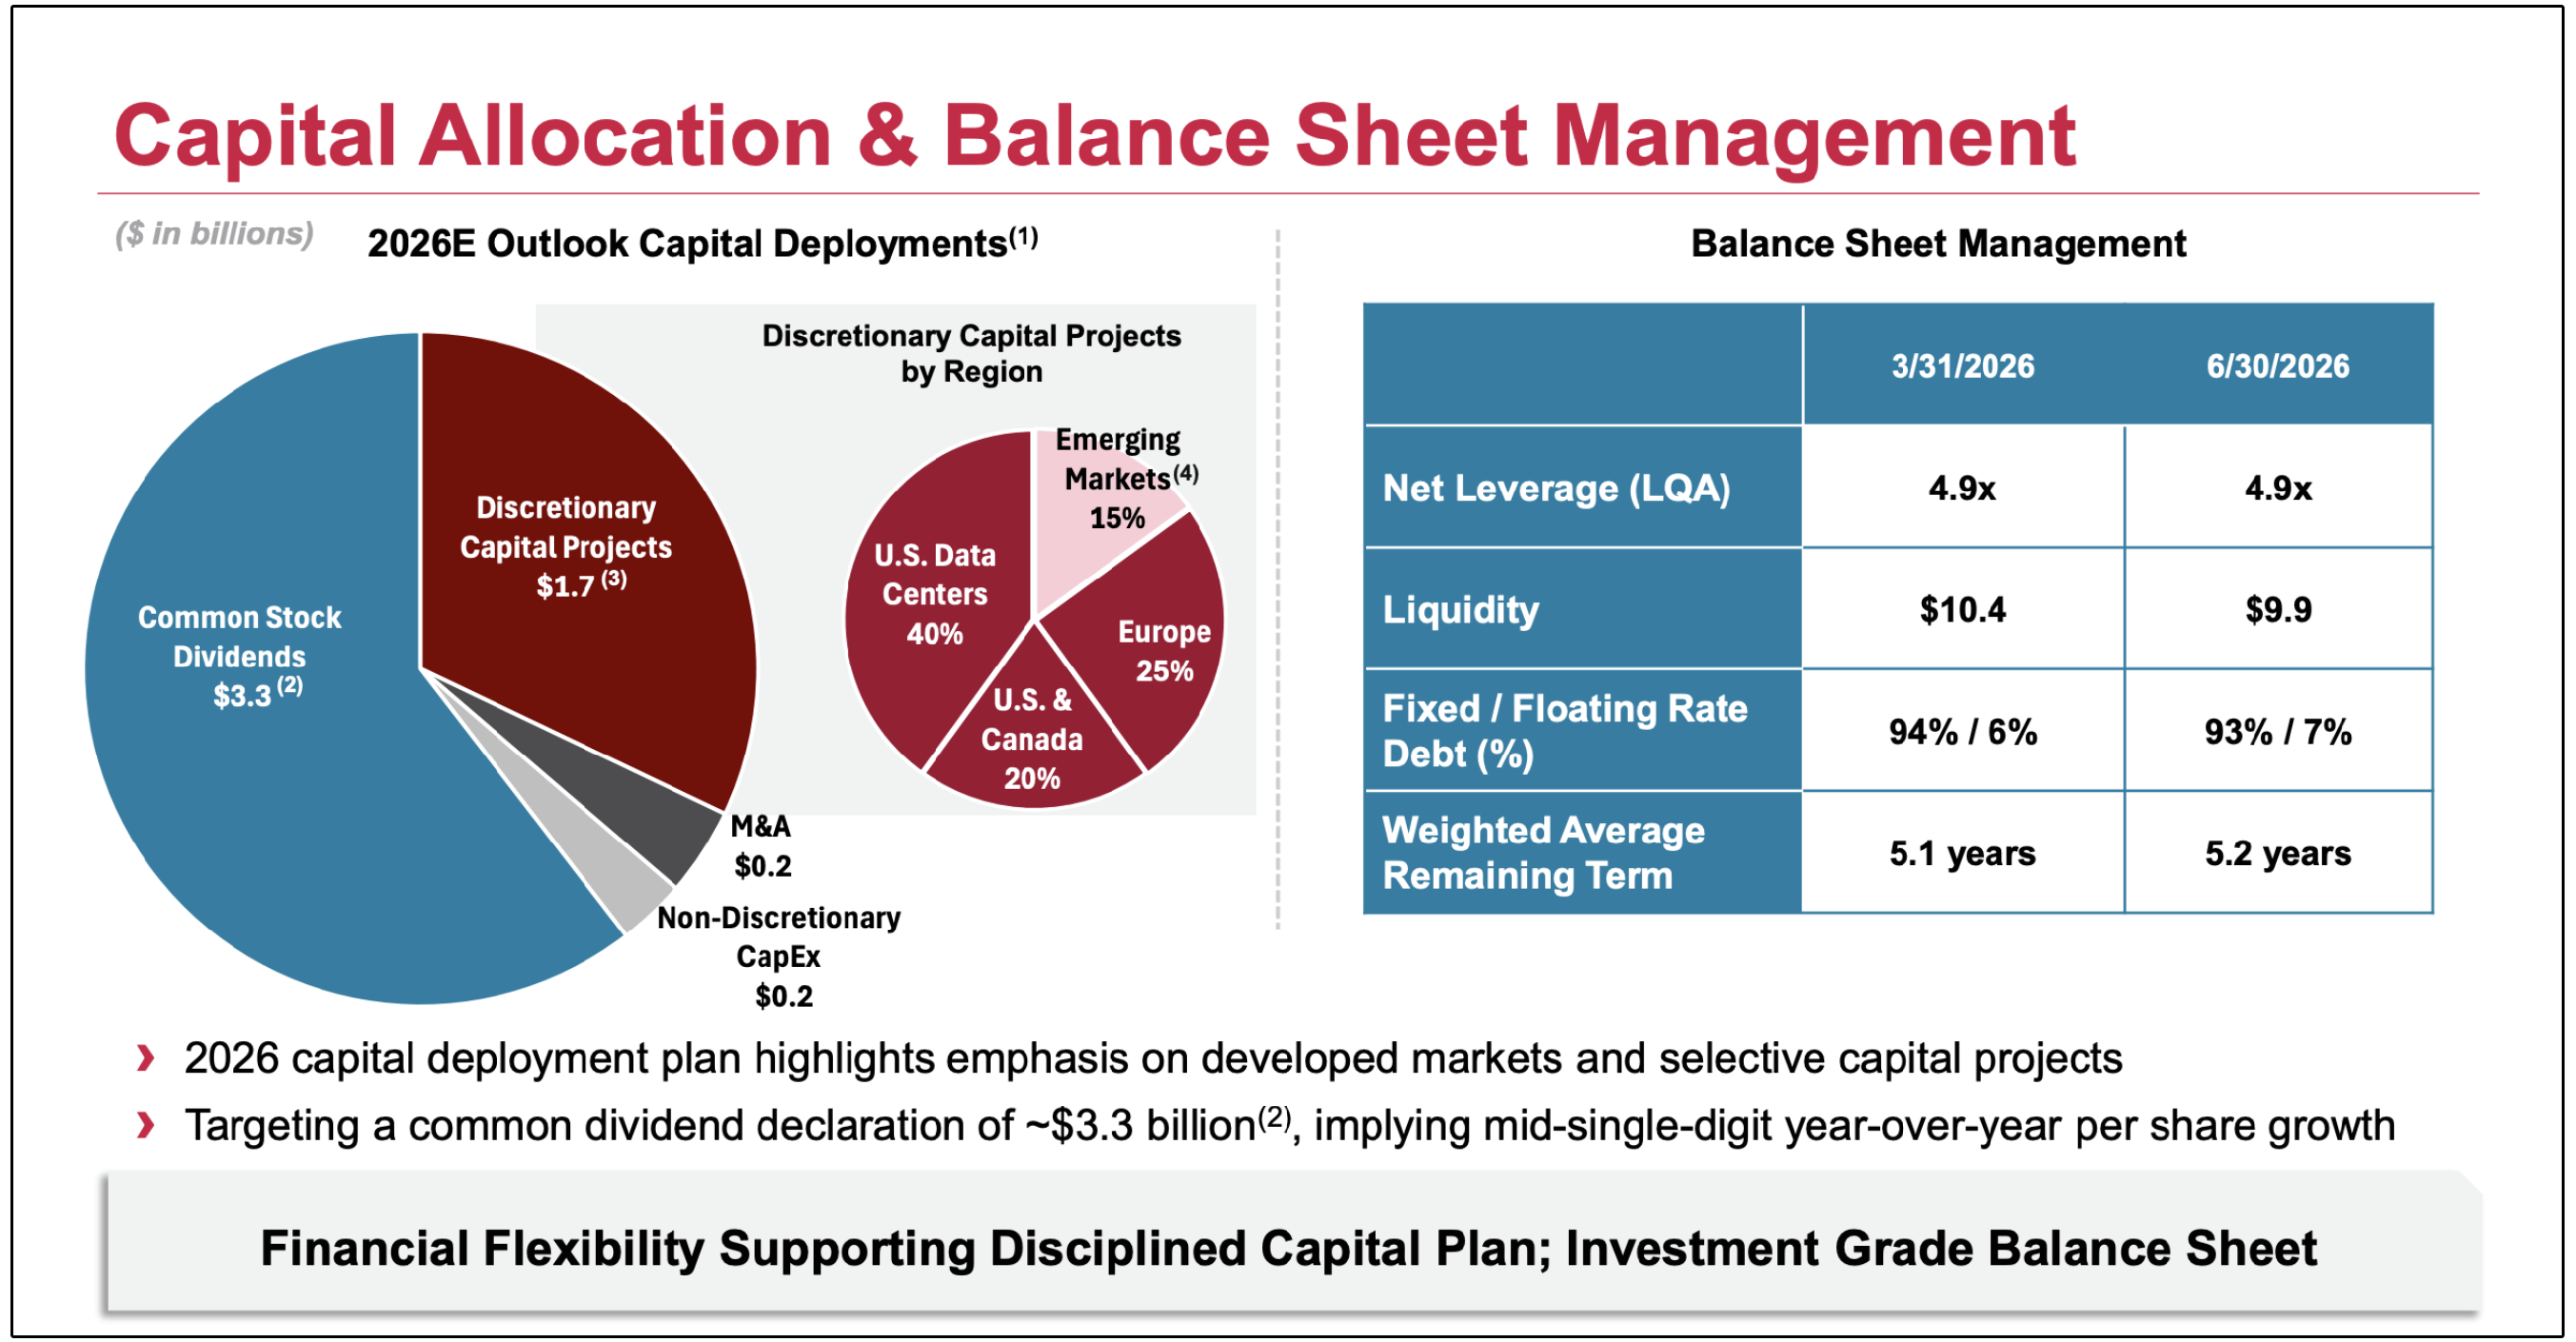
They also have around 7% floating rate debt, which isn’t a large amount, but certainly matters in a high rate environment with rates projected to go higher.
Nevertheless, American Tower combines predictable contractual revenue, a sustainable dividend, continued mobile-data growth and rapidly expanding data-center demand.
Wall Street’s $212 average price target implies approximately 21% upside before including the dividend.
2. 🏦 Barclays (BCS)
Wall St. Price Target: $33.50 | Upside: 24.86%
Barclays is one of the largest banks in the United Kingdom, but its business extends far beyond traditional savings accounts and mortgages.
The company operates a diversified collection of businesses that includes:
UK consumer banking
Corporate lending
Wealth management
Credit cards
Major global investment banking
This diversification allows Barclays to generate revenue from interest on loans, banking fees, credit-card balances, investment-banking activity and financial-market trading.
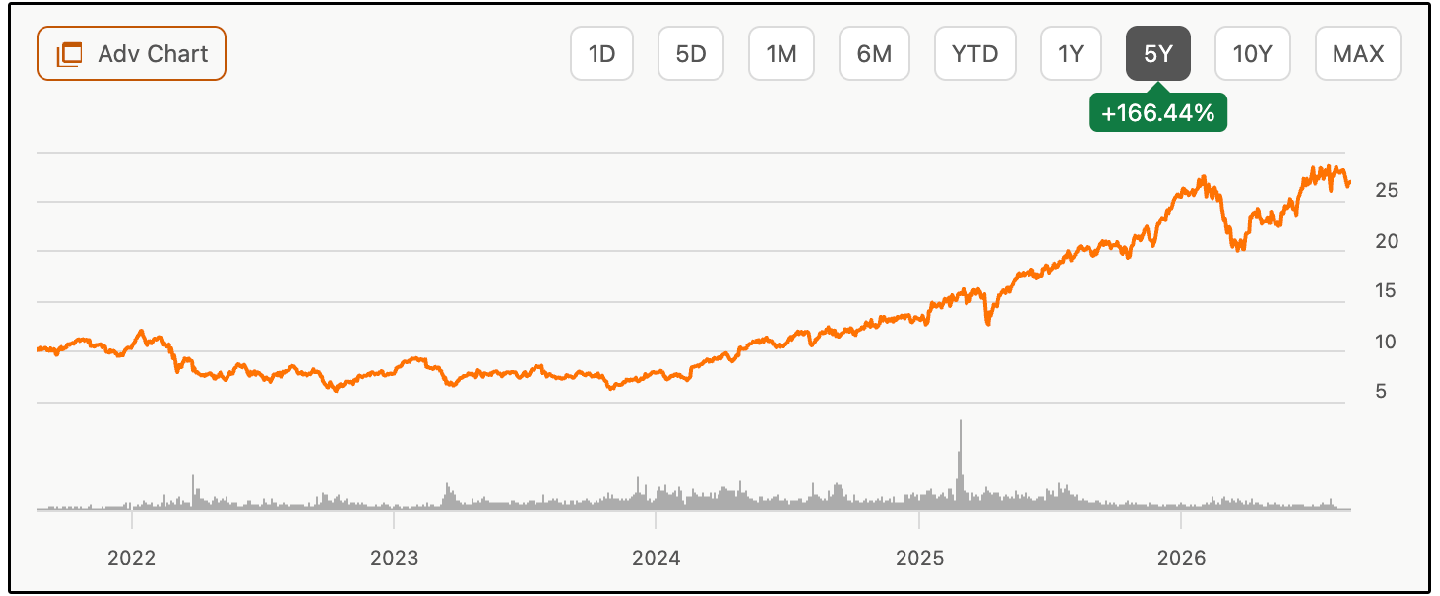
Barclays has been one of the strongest-performing European banks over the last several years as profitability and capital returns have improved.
The company’s recently released their first-half results.
Total income increased 11% to £16.5 billion, while pre-tax profit increased 17% to £6.1 billion.
Earnings per share increased 24% to 30.7 pence, and return on tangible equity reached 14.8%.
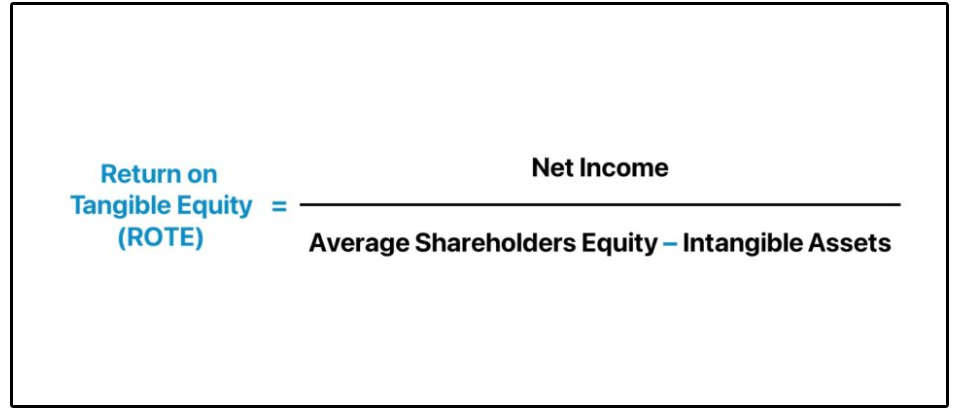
Return on tangible equity, or RoTE, is one of the most important measurements of a bank’s performance.
It compares the profits available to common shareholders with the bank’s tangible common equity, excluding goodwill and other intangible assets.
Banks require substantial equity capital to support their loans and absorb potential losses.
RoTE therefore measures how efficiently management converts that capital into profits.
If a bank consistently earns a RoTE above its cost of equity, it is creating shareholder value and can generally justify trading above tangible book value.
A bank earning less than its cost of equity will often trade below tangible book value because it is failing to generate an adequate return on shareholders’ capital.
Higher RoTE also gives a bank more capacity to grow tangible book value, pay dividends and repurchase shares while maintaining its required capital ratios.
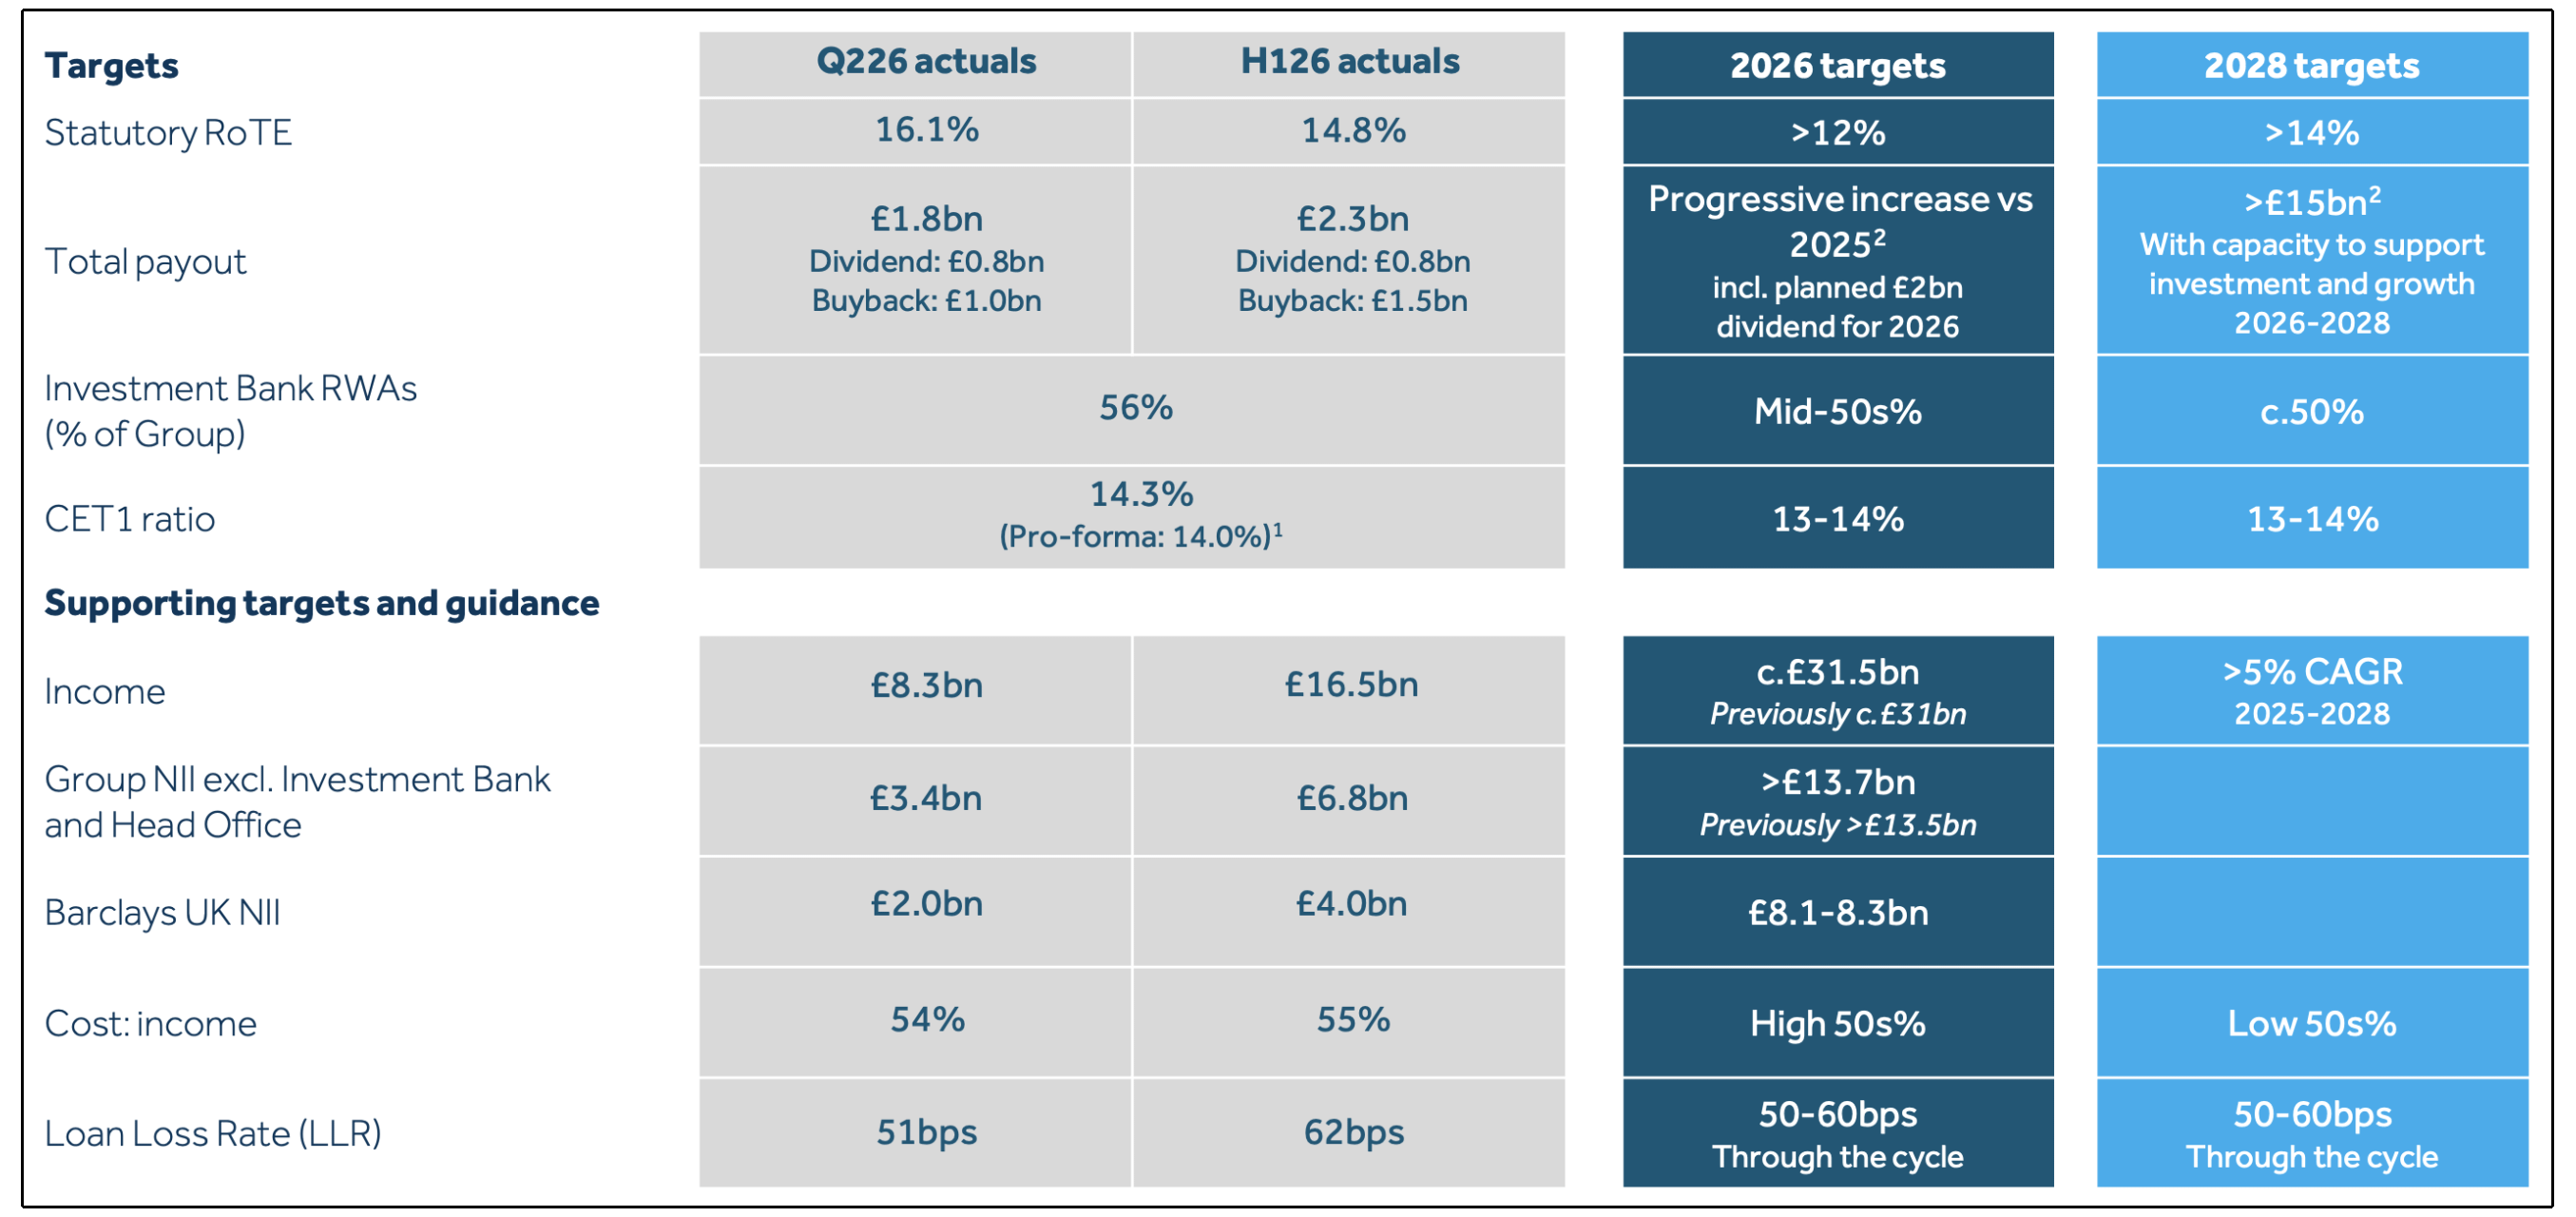
Barclays’ Common Equity Tier 1 ratio ended the quarter at 14.3%, near the top of management’s 13%–14% target range.
That excess capital is increasingly being returned to shareholders.
Barclays announced £2.3 billion of first-half capital returns, 61% more than a year earlier.
This included a new £1 billion repurchase program and approximately £800 million of dividends.
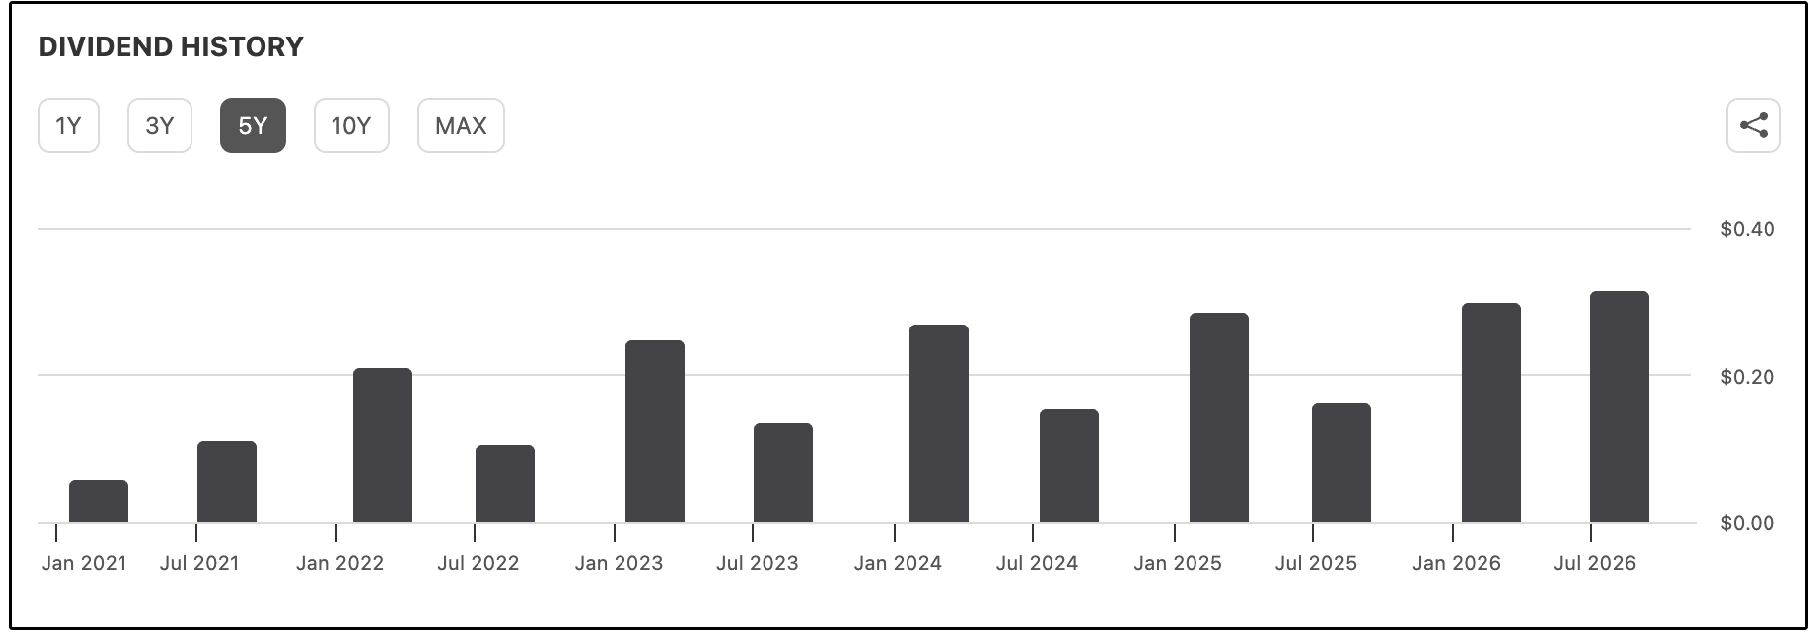
BCS currently yields 2.27% while boasting a three year dividend growth rate of 16.99%!
Keep in mind, like most European dividend stocks, the payouts can fluctuate, and they also payout semi-annually, not quarterly.
Management intends to return more than £15 billion between 2026 and 2028.
This means Barclays’ 2.27% dividend yield significantly understates its total shareholder yield because the company currently returns substantially more capital through buybacks.
However, operating expenses increased 7% during the second quarter, while structural cost actions are expected to reach approximately £600 million during 2026.
Higher investment-banking compensation, competitive pressure on UK deposits and rising credit provisions could also constrain future returns.
At approximately $27 per ADR, Barclays trades at roughly 10 times earnings and 1.2 times tangible book value.
For comparison, NatWest, Lloyds and HSBC trade at a median of approximately 1.72 times tangible book value, but they also generate a higher median RoTE of roughly 19%.
Applying an 18% discount to the peer multiple, reflecting Barclays’ lower RoTE, higher costs and more volatile investment-banking earnings, produces a justified valuation of approximately 1.4 times tangible book value.
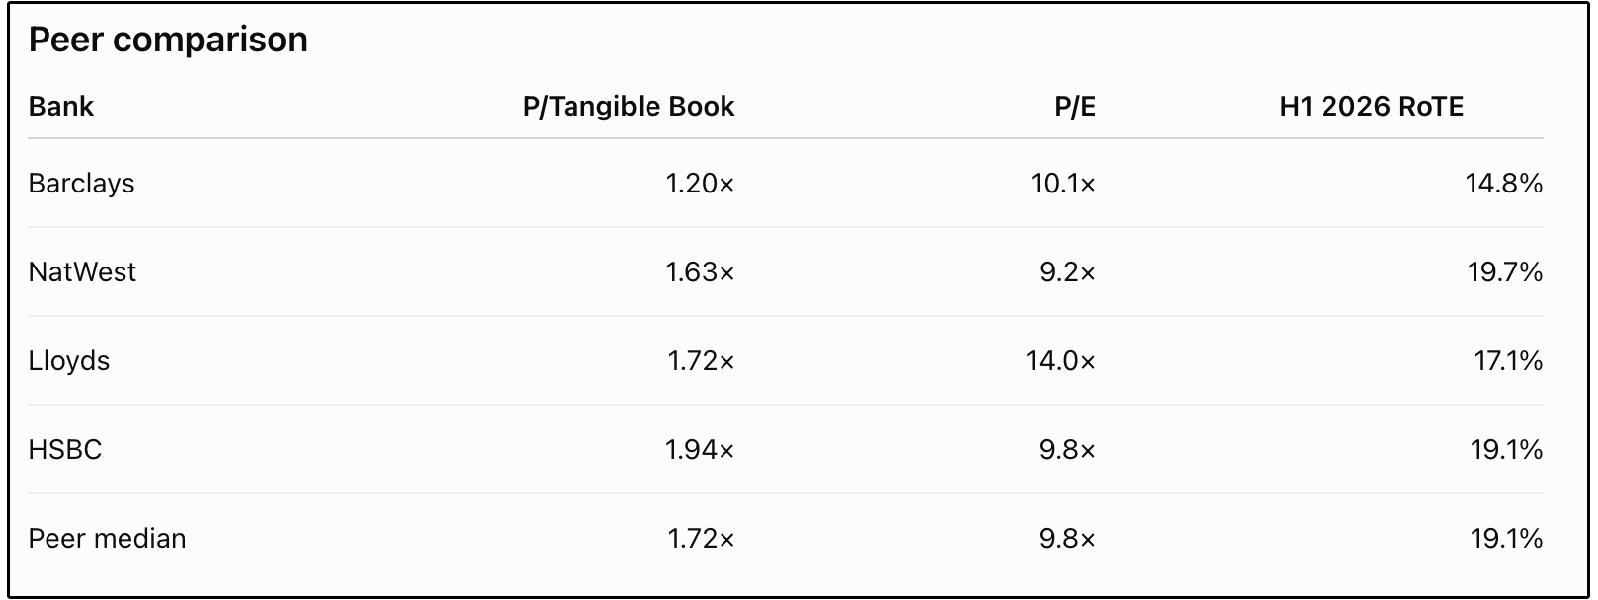
That implies a fair value of approximately $31.50 per ADR, representing nearly 17% upside.
A more optimistic 1.5-times multiple produces a value of $33.75, closely matching Wall Street’s target.
Barclays appears undervalued, but reaching Wall Street’s target requires the bank to sustain a 15%–16% RoTE after unusually favorable investment-banking conditions normalize.
3. 🔎 Alphabet (GOOG)
Wall St. Price Target: $430.70 | Upside: 26.03%
Alphabet owns one of the most dominant collections of digital businesses in the world.
This was a company that was left for dead in Q2 of 2025, trading at a P/E of roughly 17x, but has since gone on to return well over 100%.
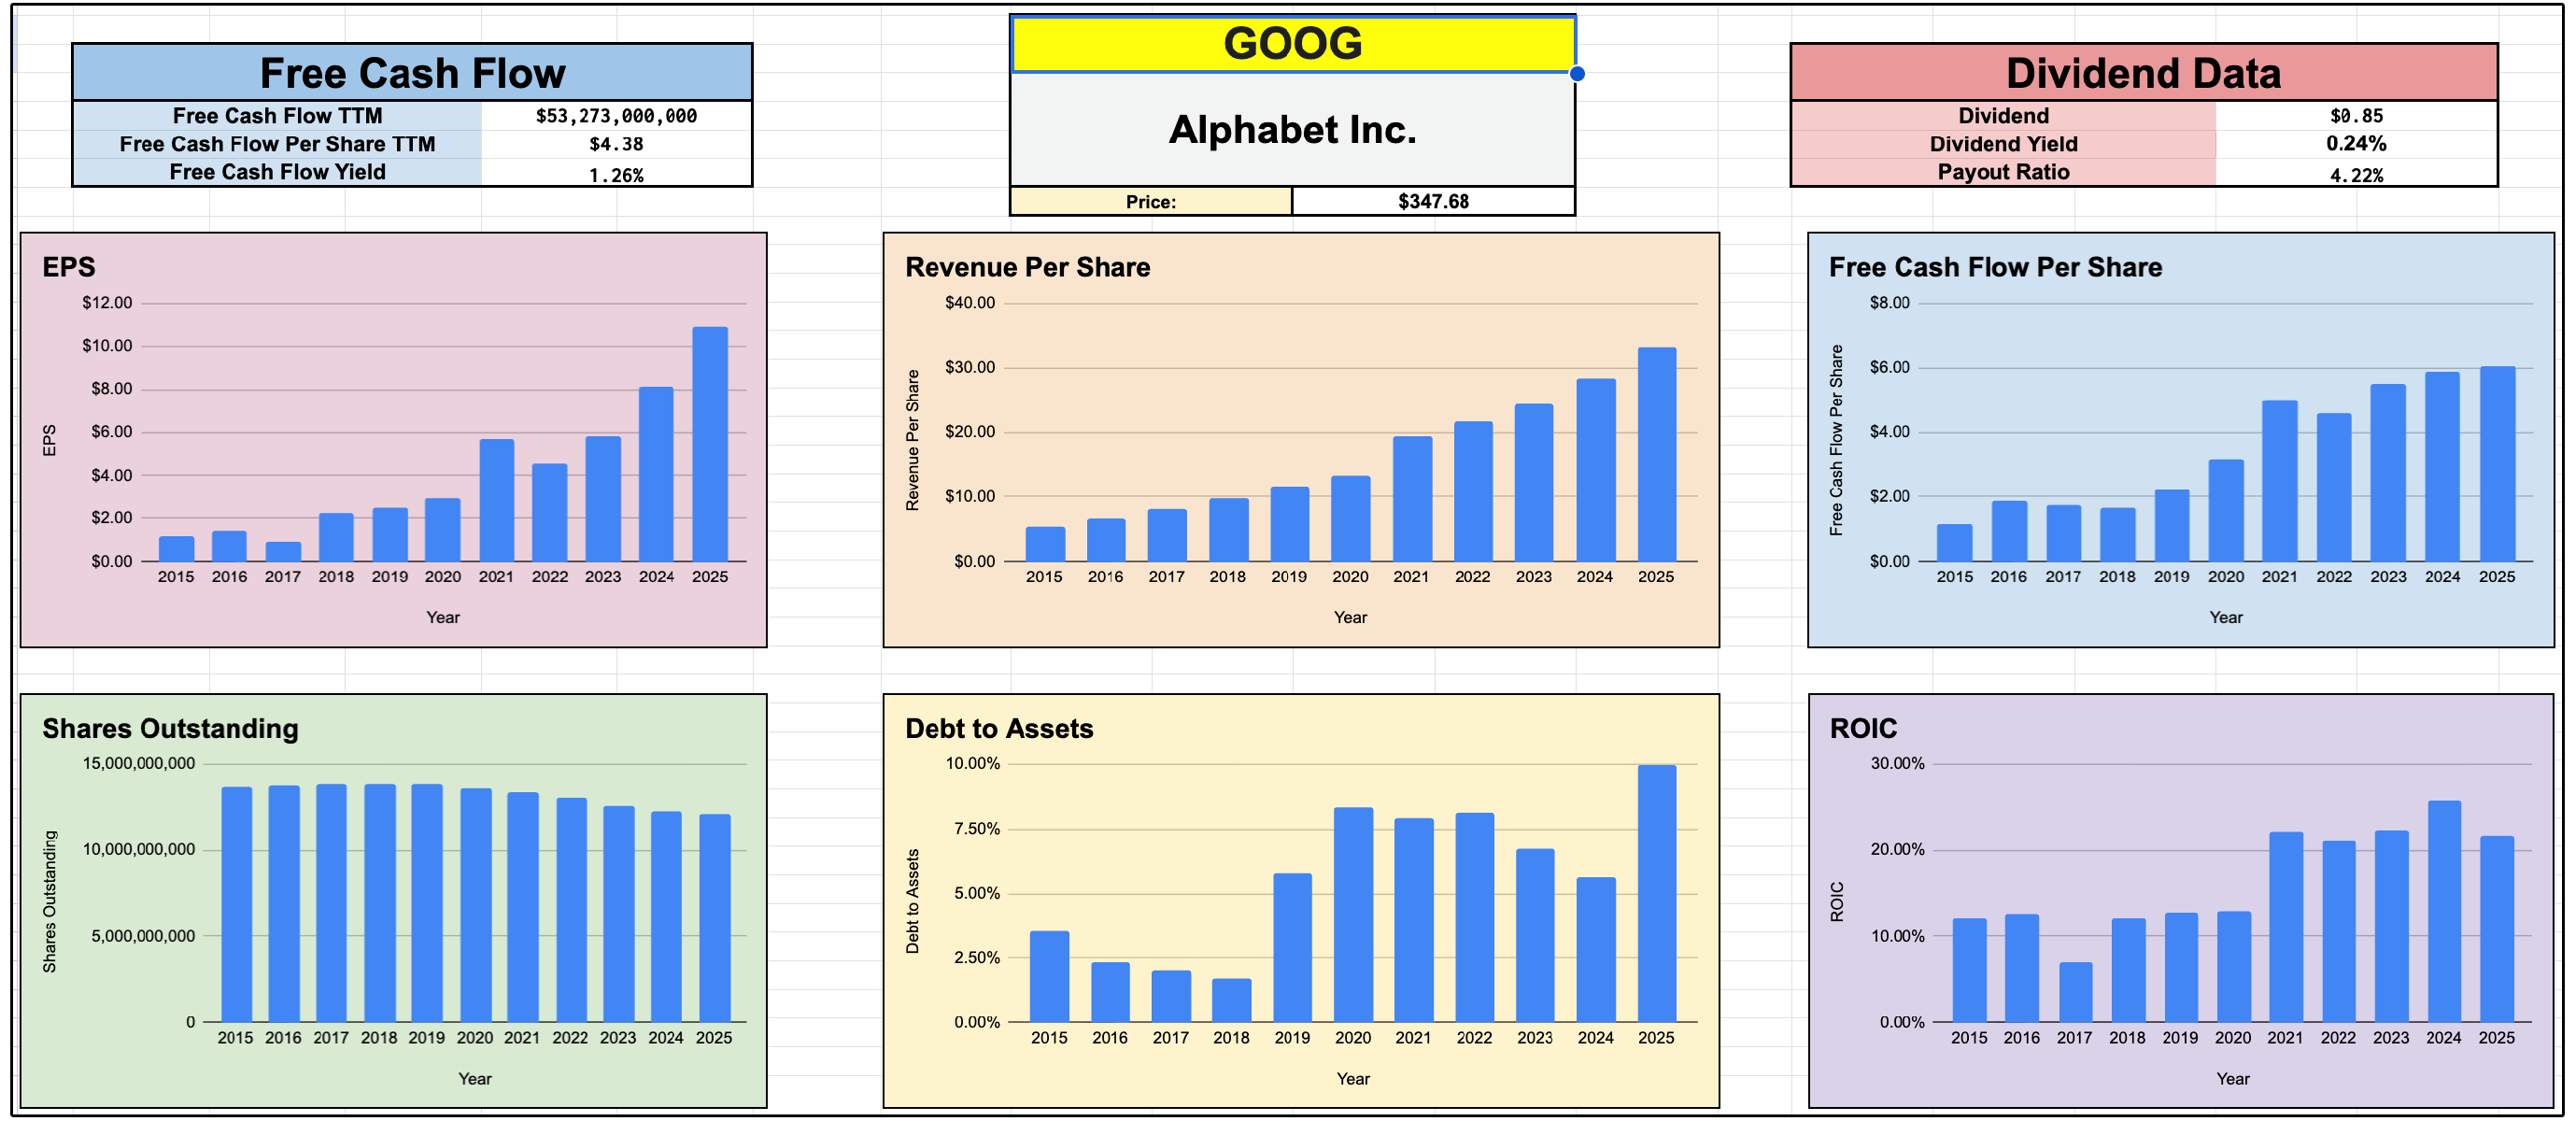
This was of course due to rapid expansion of the valuation multiple, as the market realized Google was a clear AI beneficiary.
Now the company is seeking to benefit from a different source of return:
Rapid EPS growth.
Google Search remains its primary profit engine, but the company also owns YouTube, Android, Chrome, Google Cloud, Waymo and a rapidly expanding portfolio of artificial-intelligence products.
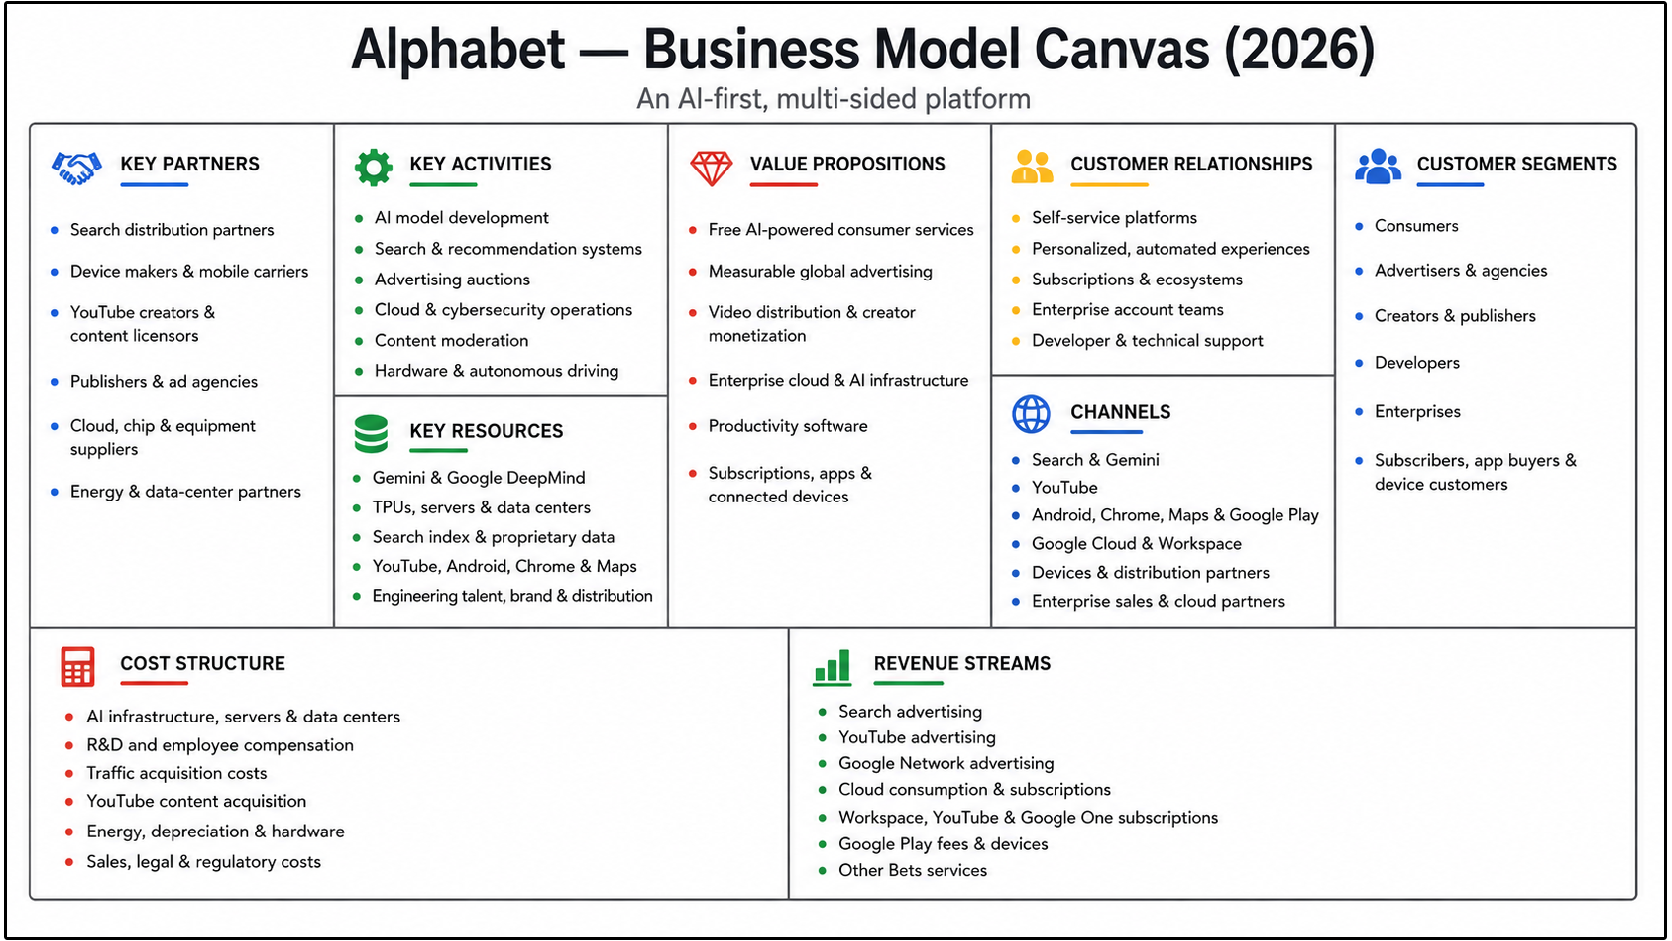
This gives Alphabet several ways to monetize the continued growth of digital advertising, cloud computing and artificial intelligence.
Revenue increased 24% to $119.8 billion in the recent quarter, which is incredible when you consider the fact this is already a company with a $4T+ market cap.
Google Search revenue grew 17% to $63.3 billion, YouTube advertising increased 13% to $11.1 billion, and subscriptions, platforms and devices revenue increased 15% to $12.9 billion.
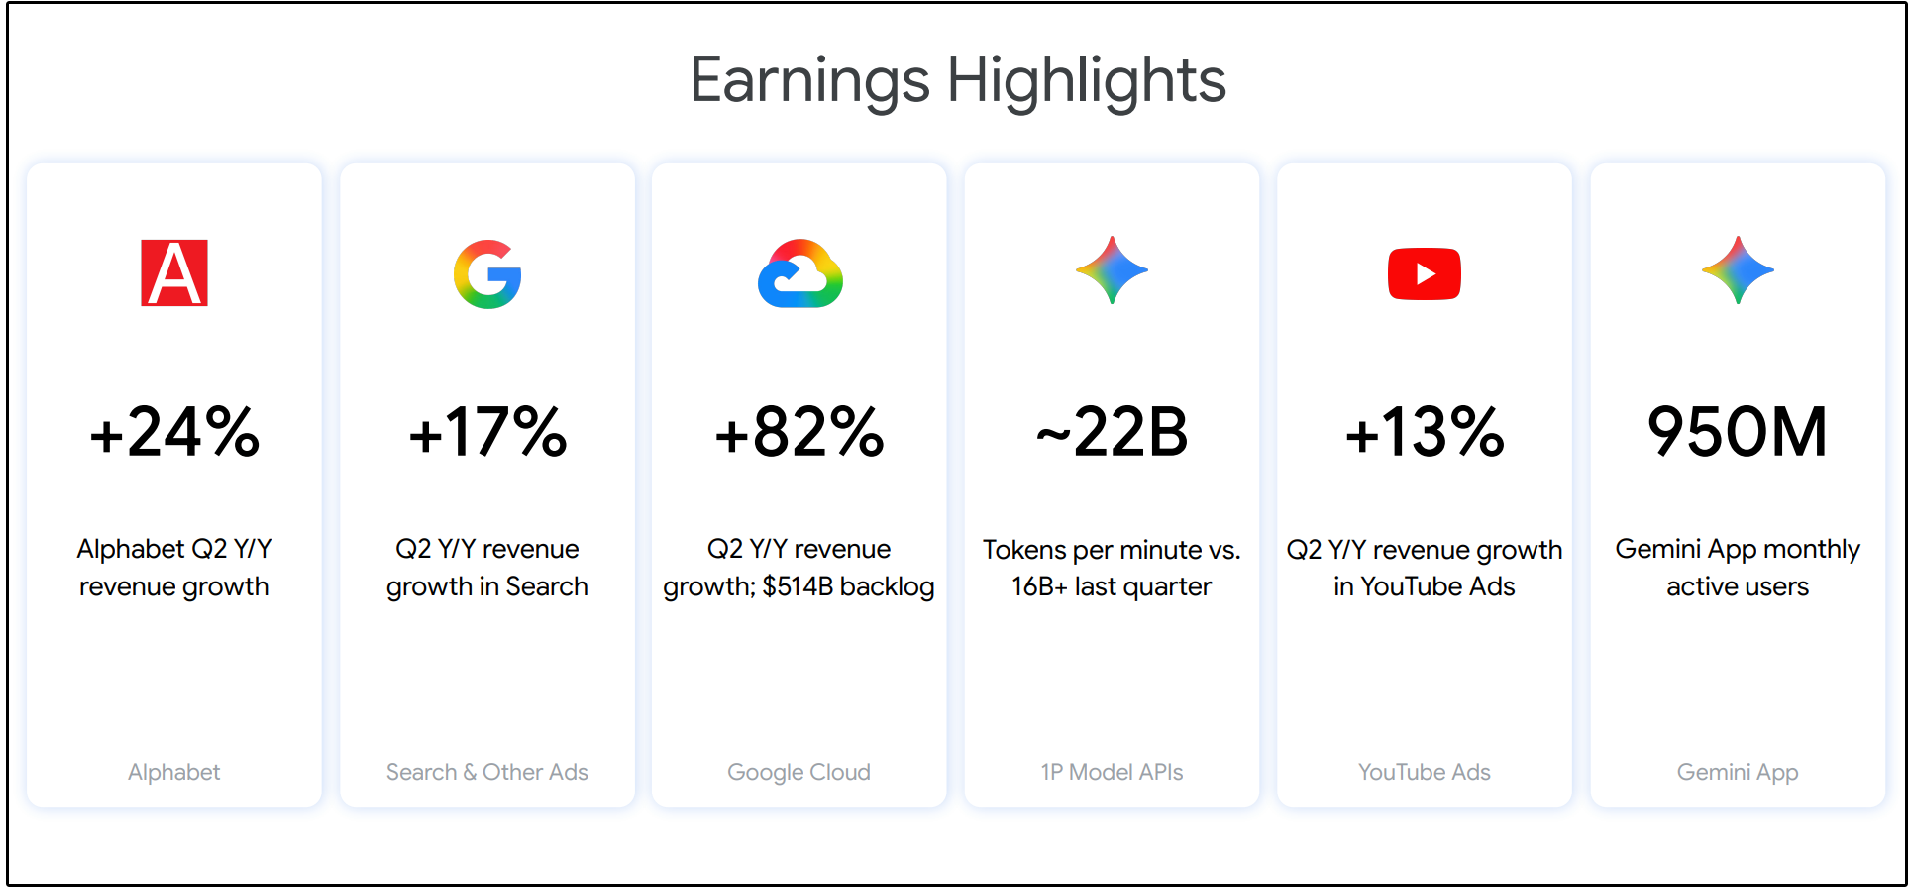
Google Cloud was easily the most impressive part of the quarter.
Cloud revenue increased 82% to $24.8 billion, accelerating from 63% growth during the previous quarter.
Operating income nearly tripled to $8.8 billion, while the segment’s operating margin expanded from 20.7% to 35.6%.
Google Cloud’s backlog also reached $514 billion, increasing by more than $50 billion during the quarter.
Management expects slightly more than half of this backlog to convert into revenue over the next two years.
Alphabet also recorded its first external sales of its custom Tensor Processing Unit systems.
This could be a huge development, as it has the ability to transform Google’s proprietary chips from an internal cost advantage into an additional source of revenue.
The company reported GAAP earnings of $9.11 per share, but this figure is extremely misleading.
Approximately $98 billion of Alphabet’s quarterly earnings came from gains on private investments such as SpaceX and Anthropic.
These gains are not recurring operating earnings and could reverse if the value of those investments declines.
Despite the exceptional operating growth, Alphabet shares sold off because of the amount being spent to build its AI infrastructure.
Capital expenditures reached $44.9 billion during the quarter, exceeding $39.1 billion of operating cash flow.
As a result, Alphabet generated negative free cash flow of $5.9 billion, which is its first negative quarter since becoming a public company.

Management also raised its 2026 capital-spending guidance to between $195 billion and $205 billion, with spending expected to remain elevated afterward.
This in no way represents immediate financial distress.
Alphabet still ended the quarter with approximately $130 billion of net cash, including leases.
The obvious concern is whether future AI and Cloud profits will produce acceptable returns on the enormous amount of capital being invested.
From a valuation perspective, Google looks incredibly cheap at first glance.

Paying 17x earnings for Google would be an incredible deal (as we saw last year).
Unfortunately, the much lower reported P/E of approximately 17 times is distorted by the unrealized investment gains that significantly increased GAAP earnings without increasing operating cash flow.
Google actually trades at roughly 25.6 times next-12-month normalized earnings.
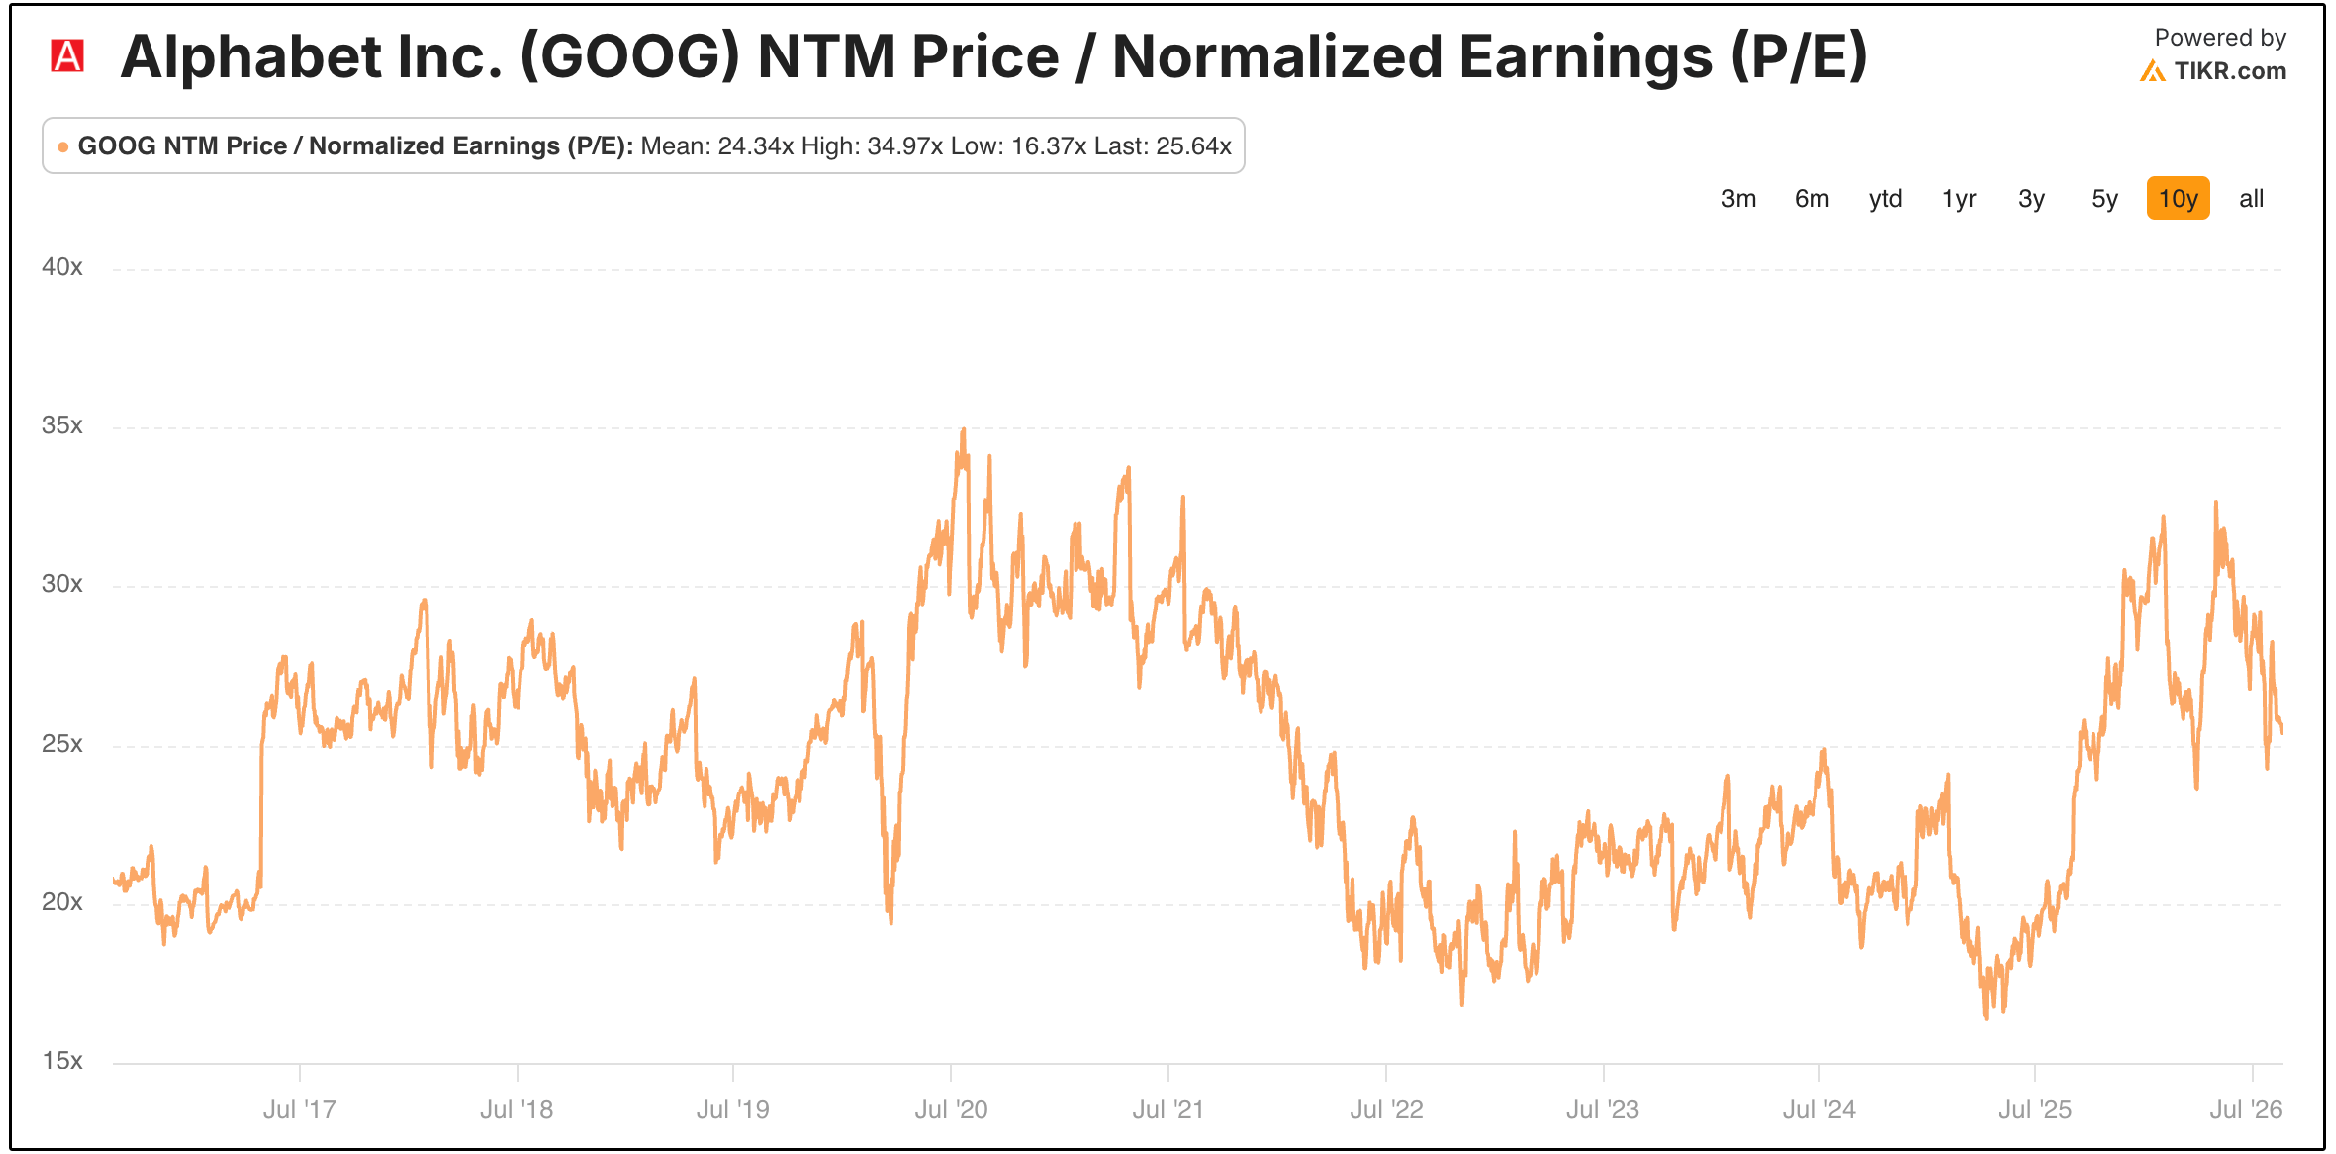
However, even at that valuation, Google is still trading roughly in line with its historic valuation multiple.
Wall Street’s projected 26% upside depends on Cloud remaining exceptionally strong, Search successfully adapting to generative AI and capital expenditures eventually normalizing.
Google’s future returns entirely depend on whether its historic AI investment produces equally historic cash flows.
Now, let’s dive into the full list of dividend stocks with the most upside according to Wall Street.