

Every month, I compile data on the dividend stocks with the most upside based on Wall Street analysts price targets.
Members will get access to the full list every month, as well as all other Dividendology features.
We have a record 154 stocks on the list this month after the market pull back.
Let’s dive in.

🎉 But first…
On November 23rd (this Monday!)-
Dividendology is getting a major addition to the Dividendology Database.
Over the last year, we’ve built out:
The Covered Call ETF Database
The BDC Database
The REIT Database
Each database provides in depth information on these asset classes traditional investing softwares don’t provide.
Now, we’re adding a Midstream/MLP database this Monday!
This is one of the most exciting features we’ve launched in a long time.
Dividendology will continue to expand it’s coverage and research into Dividend Growth and High Yield Opportunities.
To celebrate, we’ll be having what I call ‘Dividend Week’!
Stay tuned!!
Now, let’s dive into Wall Street’s list of most upside dividend stocks.
1. 🛢️ DT Midstream (DTM)
Wall St. Price Target: $148.67 | Upside: 34.05%
DT Midstream is now down over 26% in the last six months.
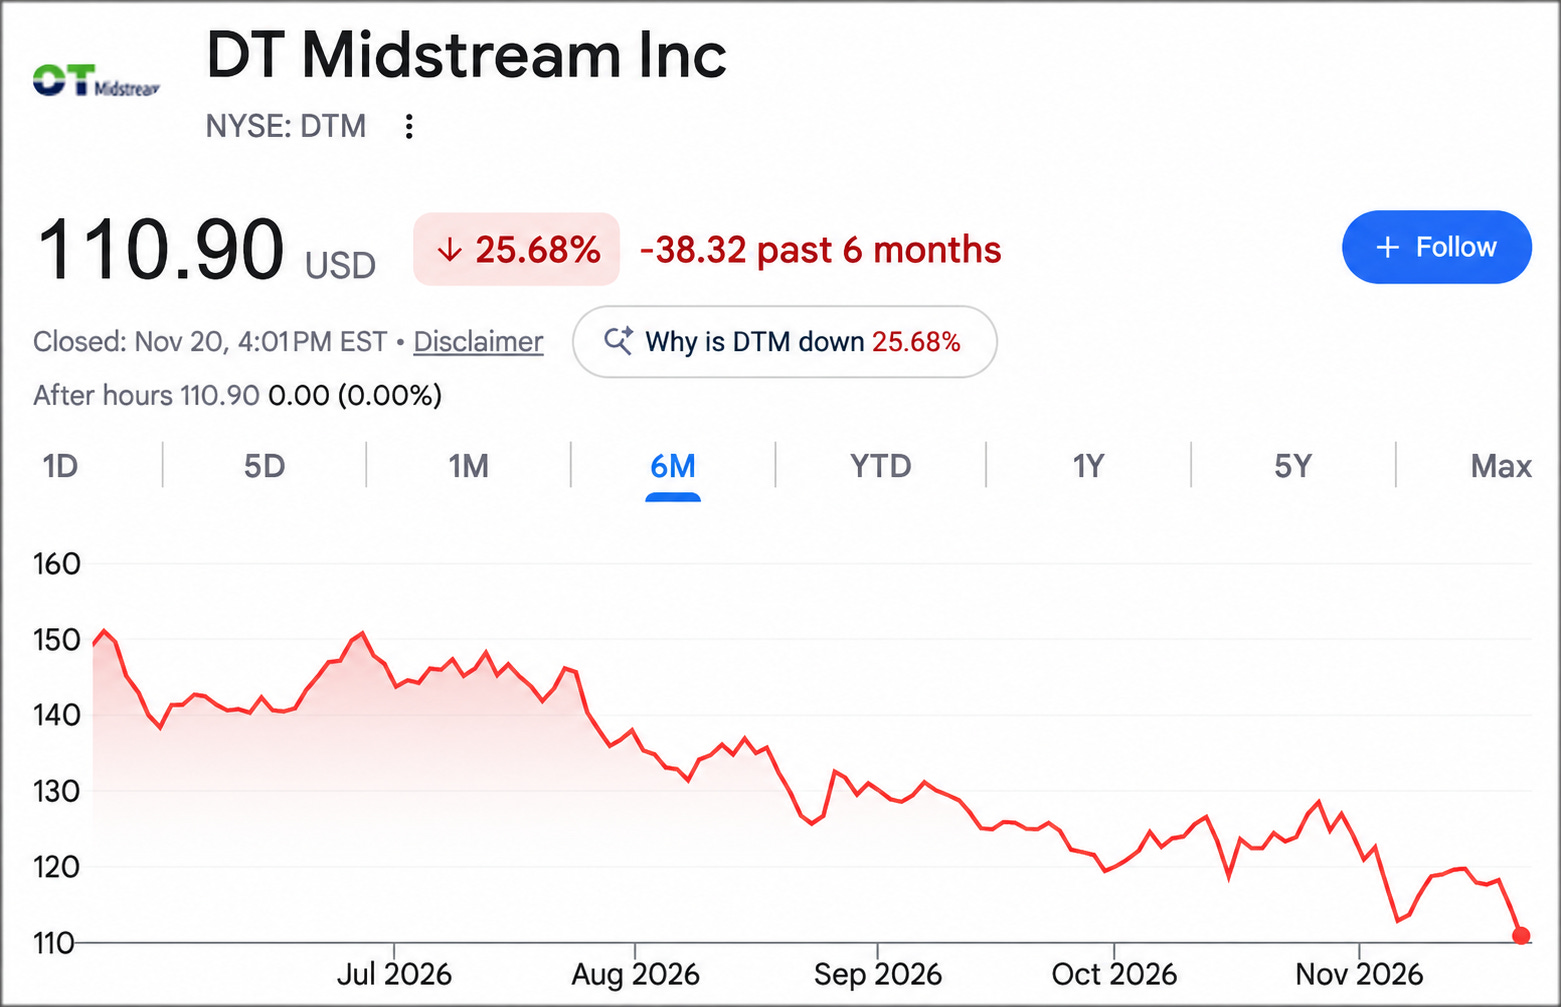
At around $111 a share, it’s sitting roughly 27.5% below its 52-week high.
But during that same stretch, management actually raised its 2026 earnings guidance.
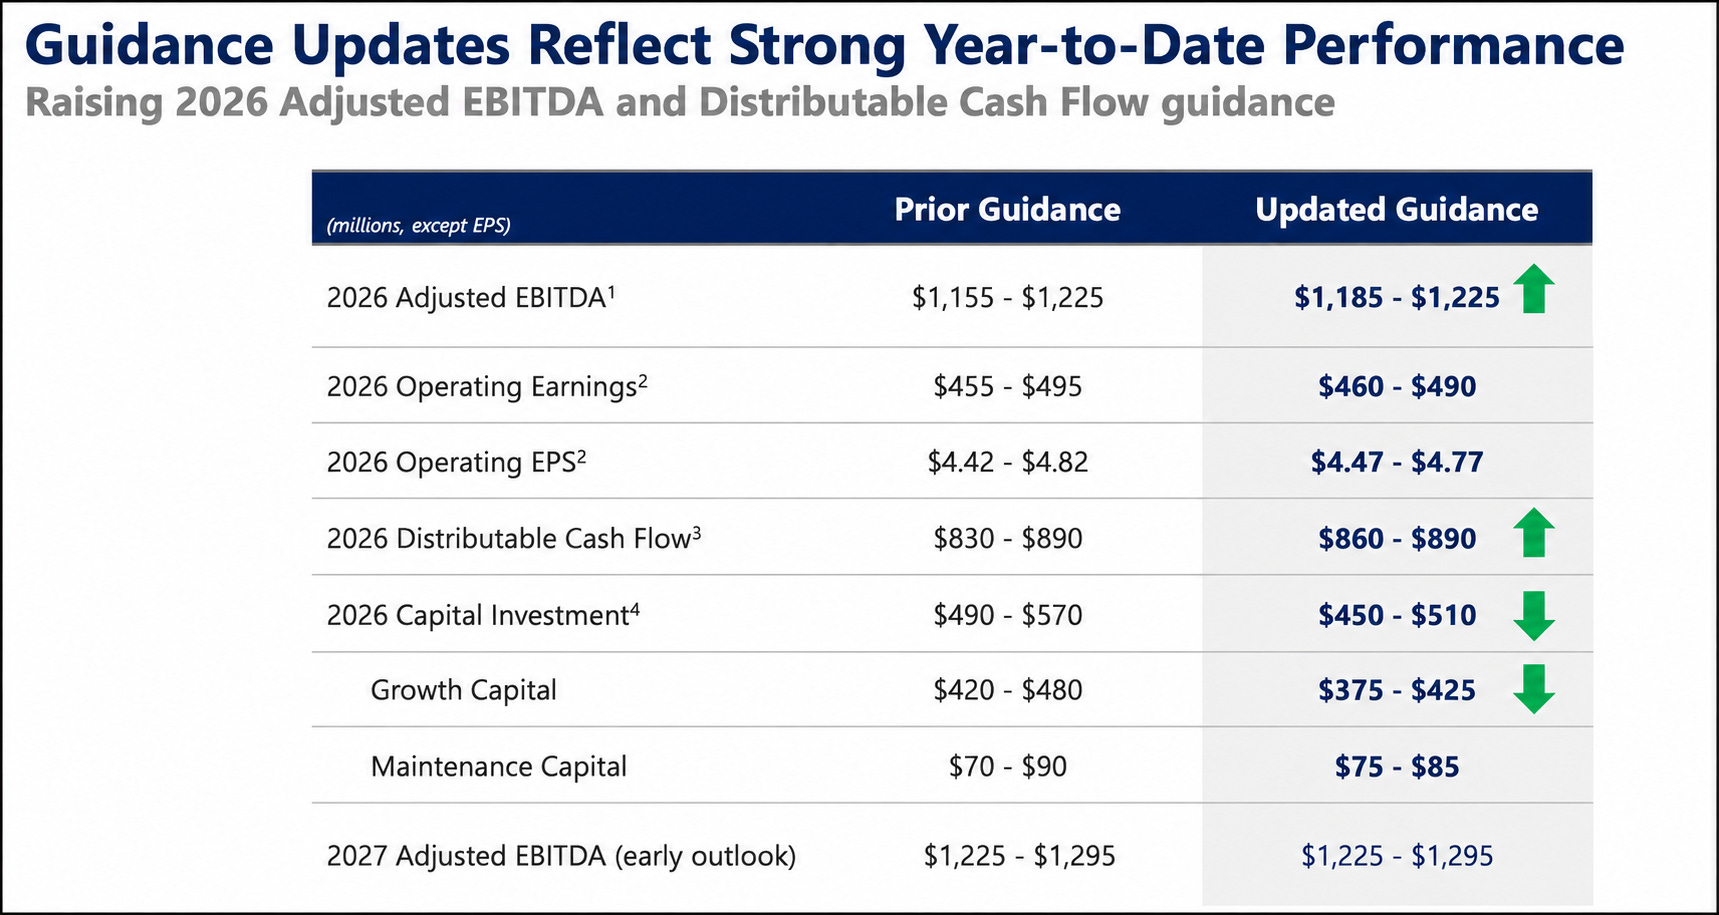
DT Midstream owns and operates natural gas pipelines, storage and gathering systems across the Midwest, Northeast and Gulf Coast.
Unlike most of the midstream names we cover, DTM is a C-corp-
Which means you get a 1099 at tax time, not a K-1.
That makes it far easier to own in an IRA, with no K-1 paperwork or UBTI headaches.
The business has two segments:
Pipelines (~70% of the business): long-haul interstate pipelines and storage, contracted on a take-or-pay basis.
Gathering (~30%): collecting gas from the wellhead in the Haynesville and the Northeast, backed by minimum volume commitments.
In other words, customers pay to reserve capacity whether they use all of it or not.
Essentially 100% of the business is contracted, which makes cash flows far more predictable than those of a gas producer.
So why the selloff?
A big part of DTM’s growth story is natural gas demand from power plants and data centers in the Upper Midwest.
And when the AI trade gets hit, the “AI power” names get hit with it.
There’s also a real soft spot in the business.
Gathering EBITDA slipped from $105 million to $99 million in Q3, as weak natural gas prices led Northeast producers to curtail volumes.
And management expects Q4 to come in below Q3.
But keep in mind, gathering is the smaller part of the business-
And the pipeline side keeps growing.
DTM now has $2.4 billion of committed projects, roughly 70% of its $3.4 billion backlog.
That includes a new lateral to serve a utility-scale power plant in Indiana, and a Midwestern Gas Transmission expansion that adds about 20% more capacity.
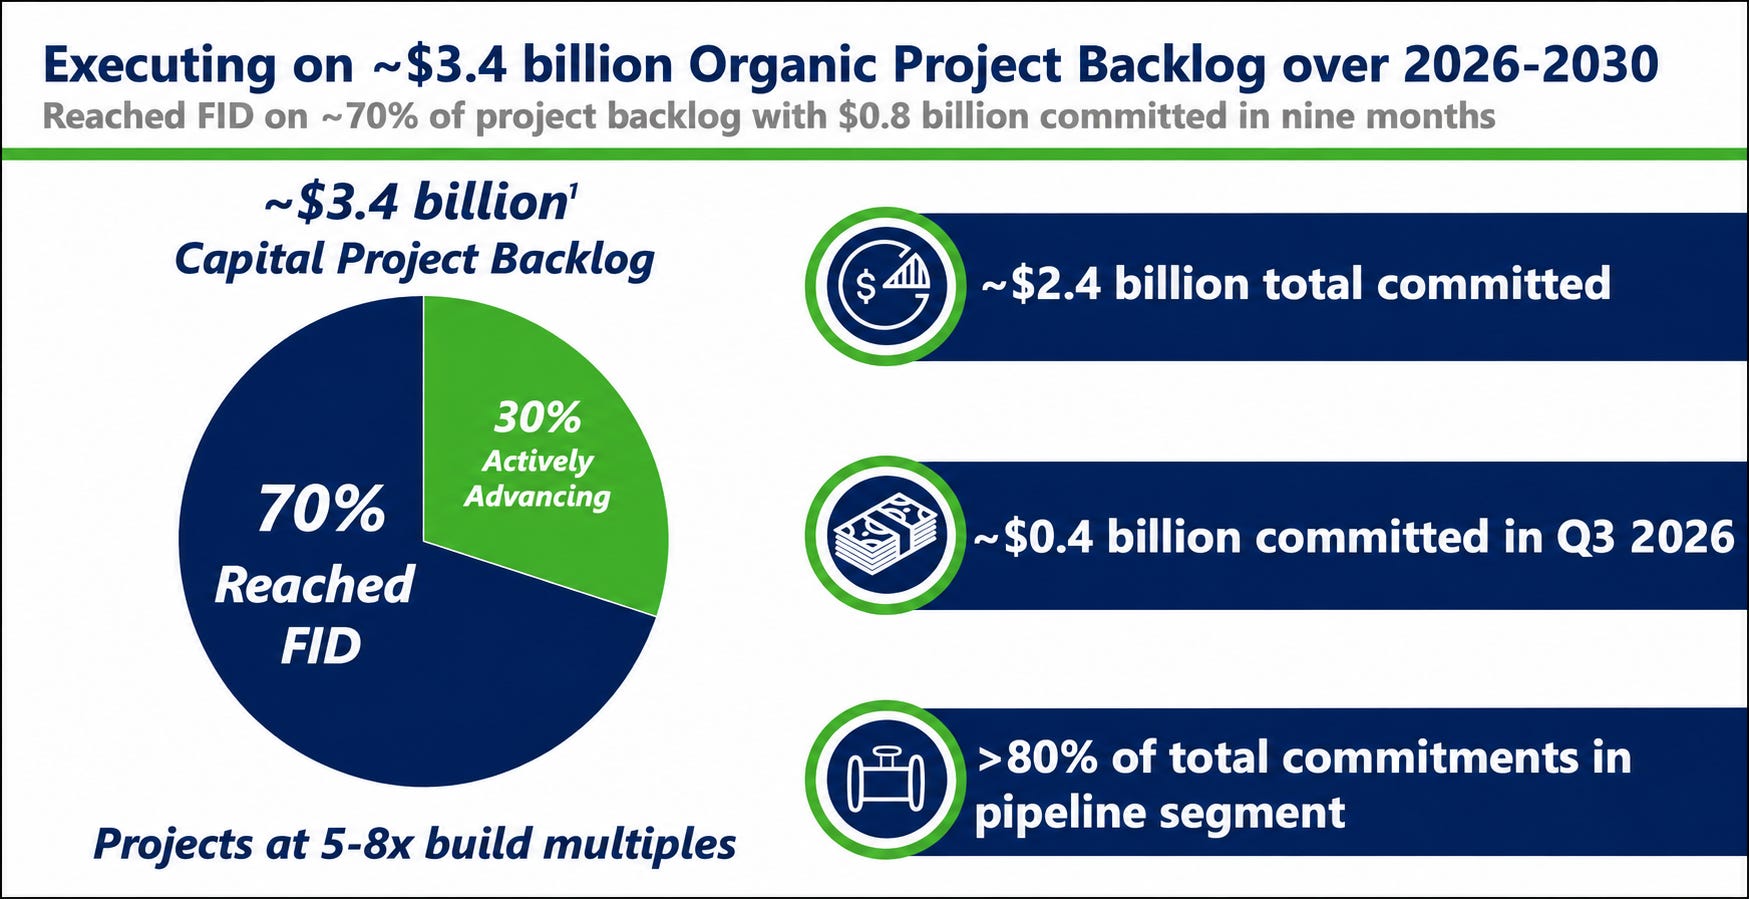
Now let’s look at the numbers that matter most for dividend investors.
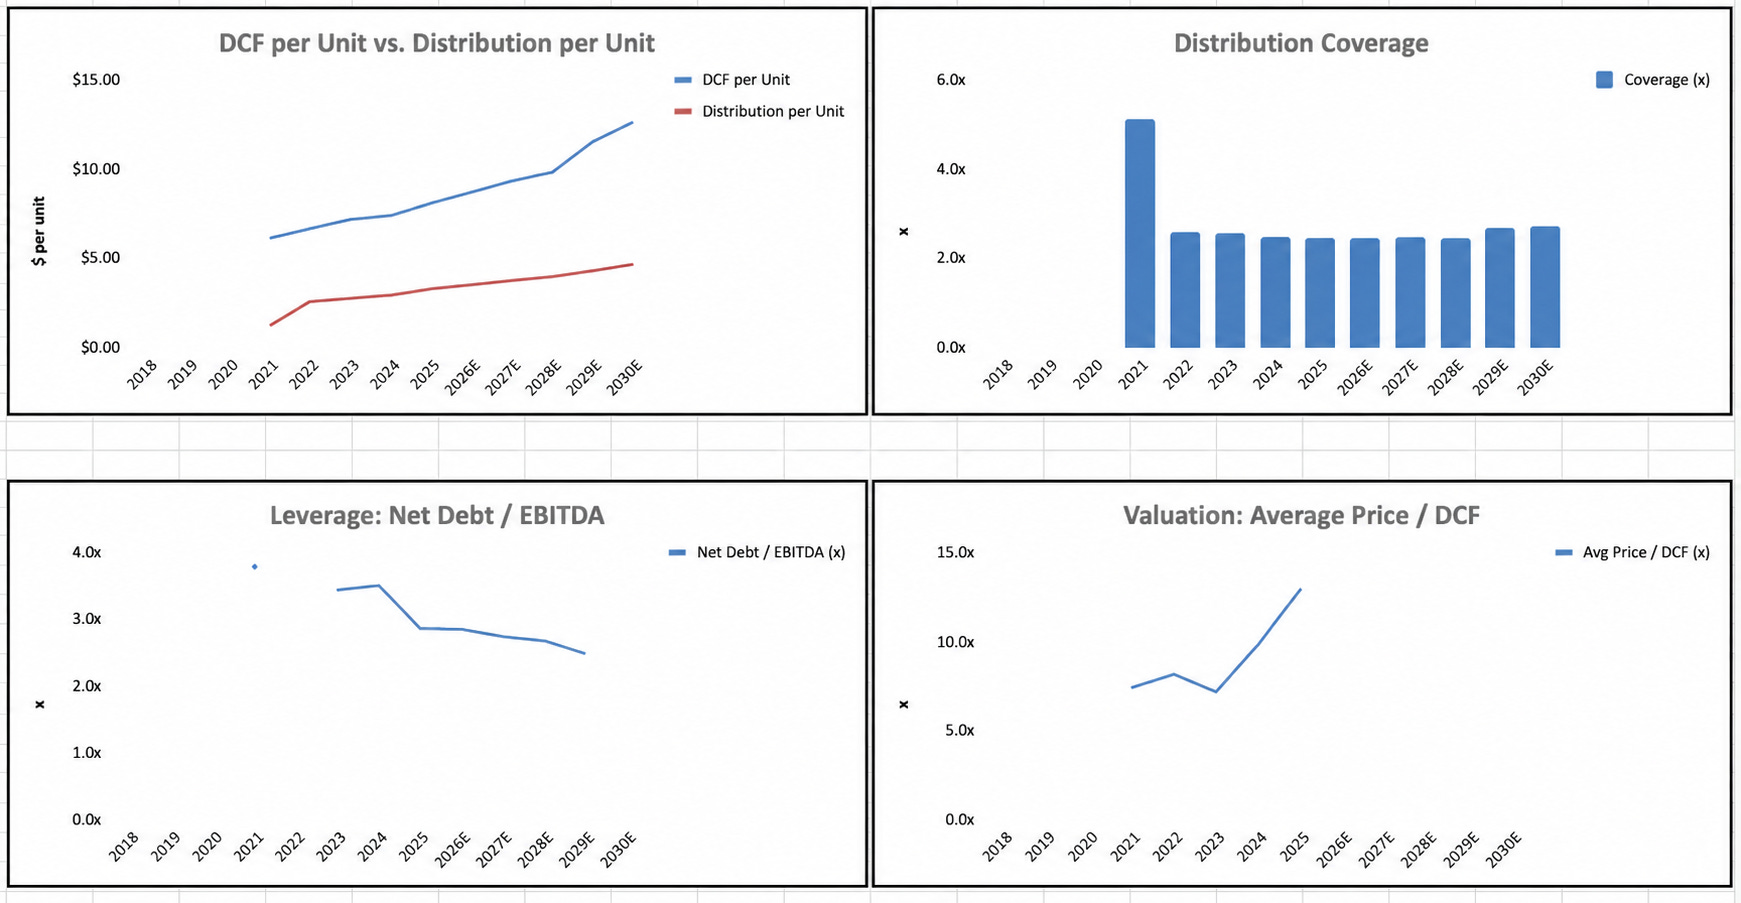
Distributable cash flow per share grew from $7.18 in 2023 to $8.10 in 2025, and is projected to reach $9.84 by 2028.
That’s a projected DCF per share CAGR of about 6.7%.
The dividend has followed right along.
DTM’s annual dividend grew from $2.56 in 2022 to $3.28 in 2025, roughly an 8.6% CAGR, and sits at $3.50 for 2026.
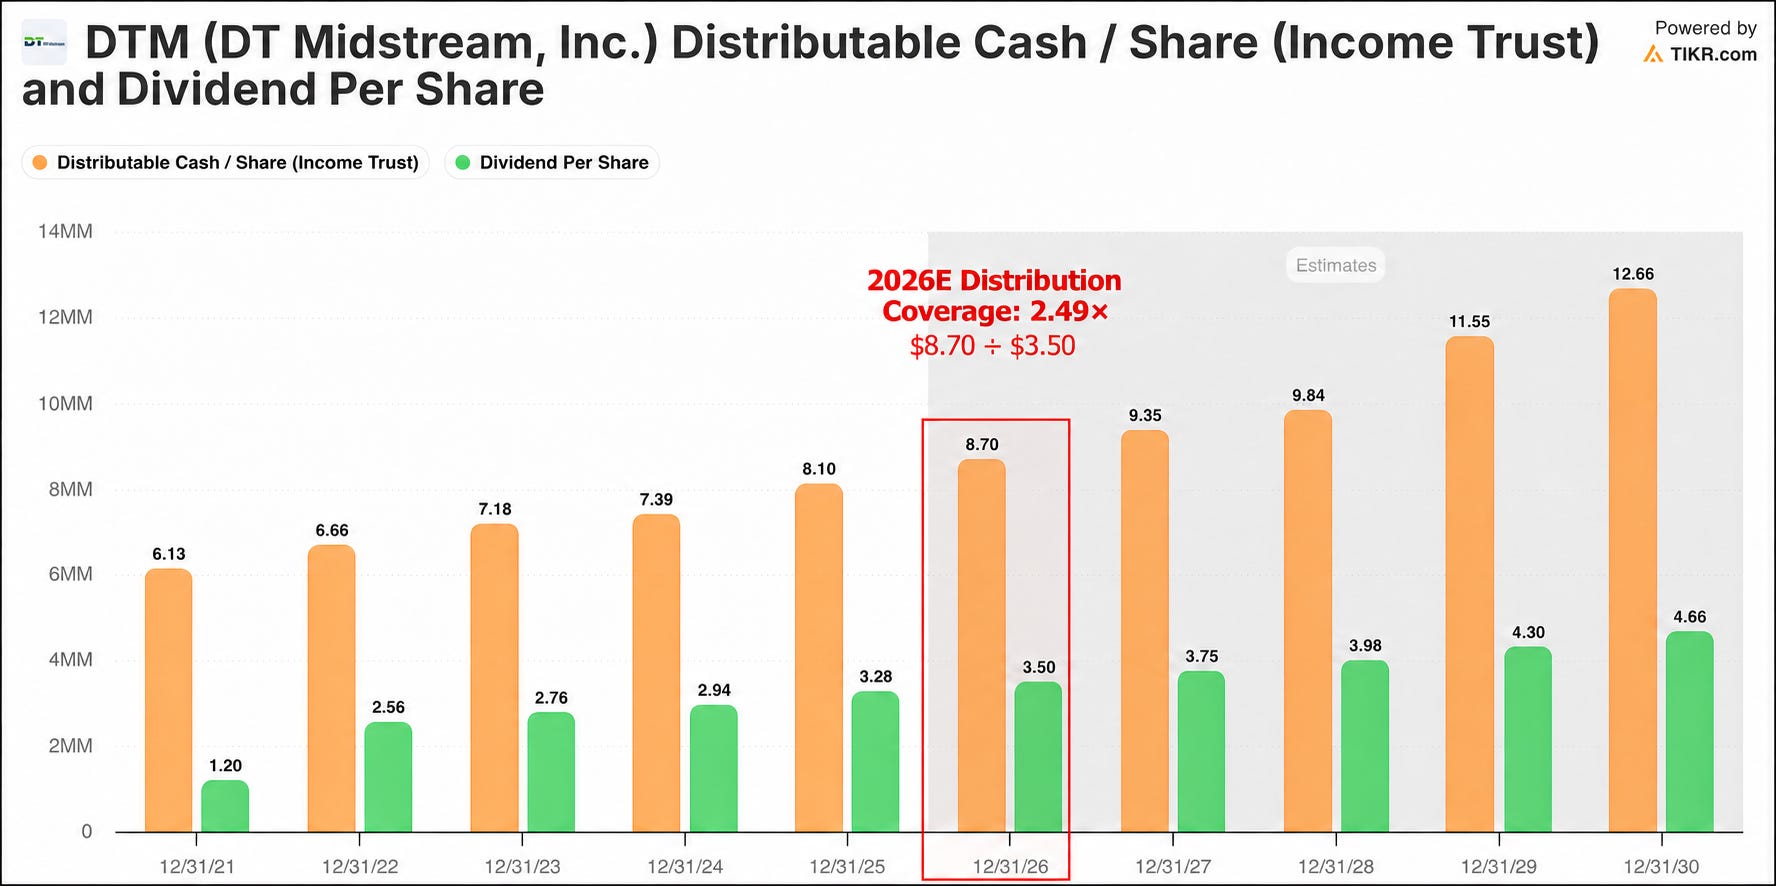
Even with that growth, coverage has stayed remarkably steady at around 2.5x, and it’s projected to stay there through 2028.
The balance sheet is where DTM really stands out.
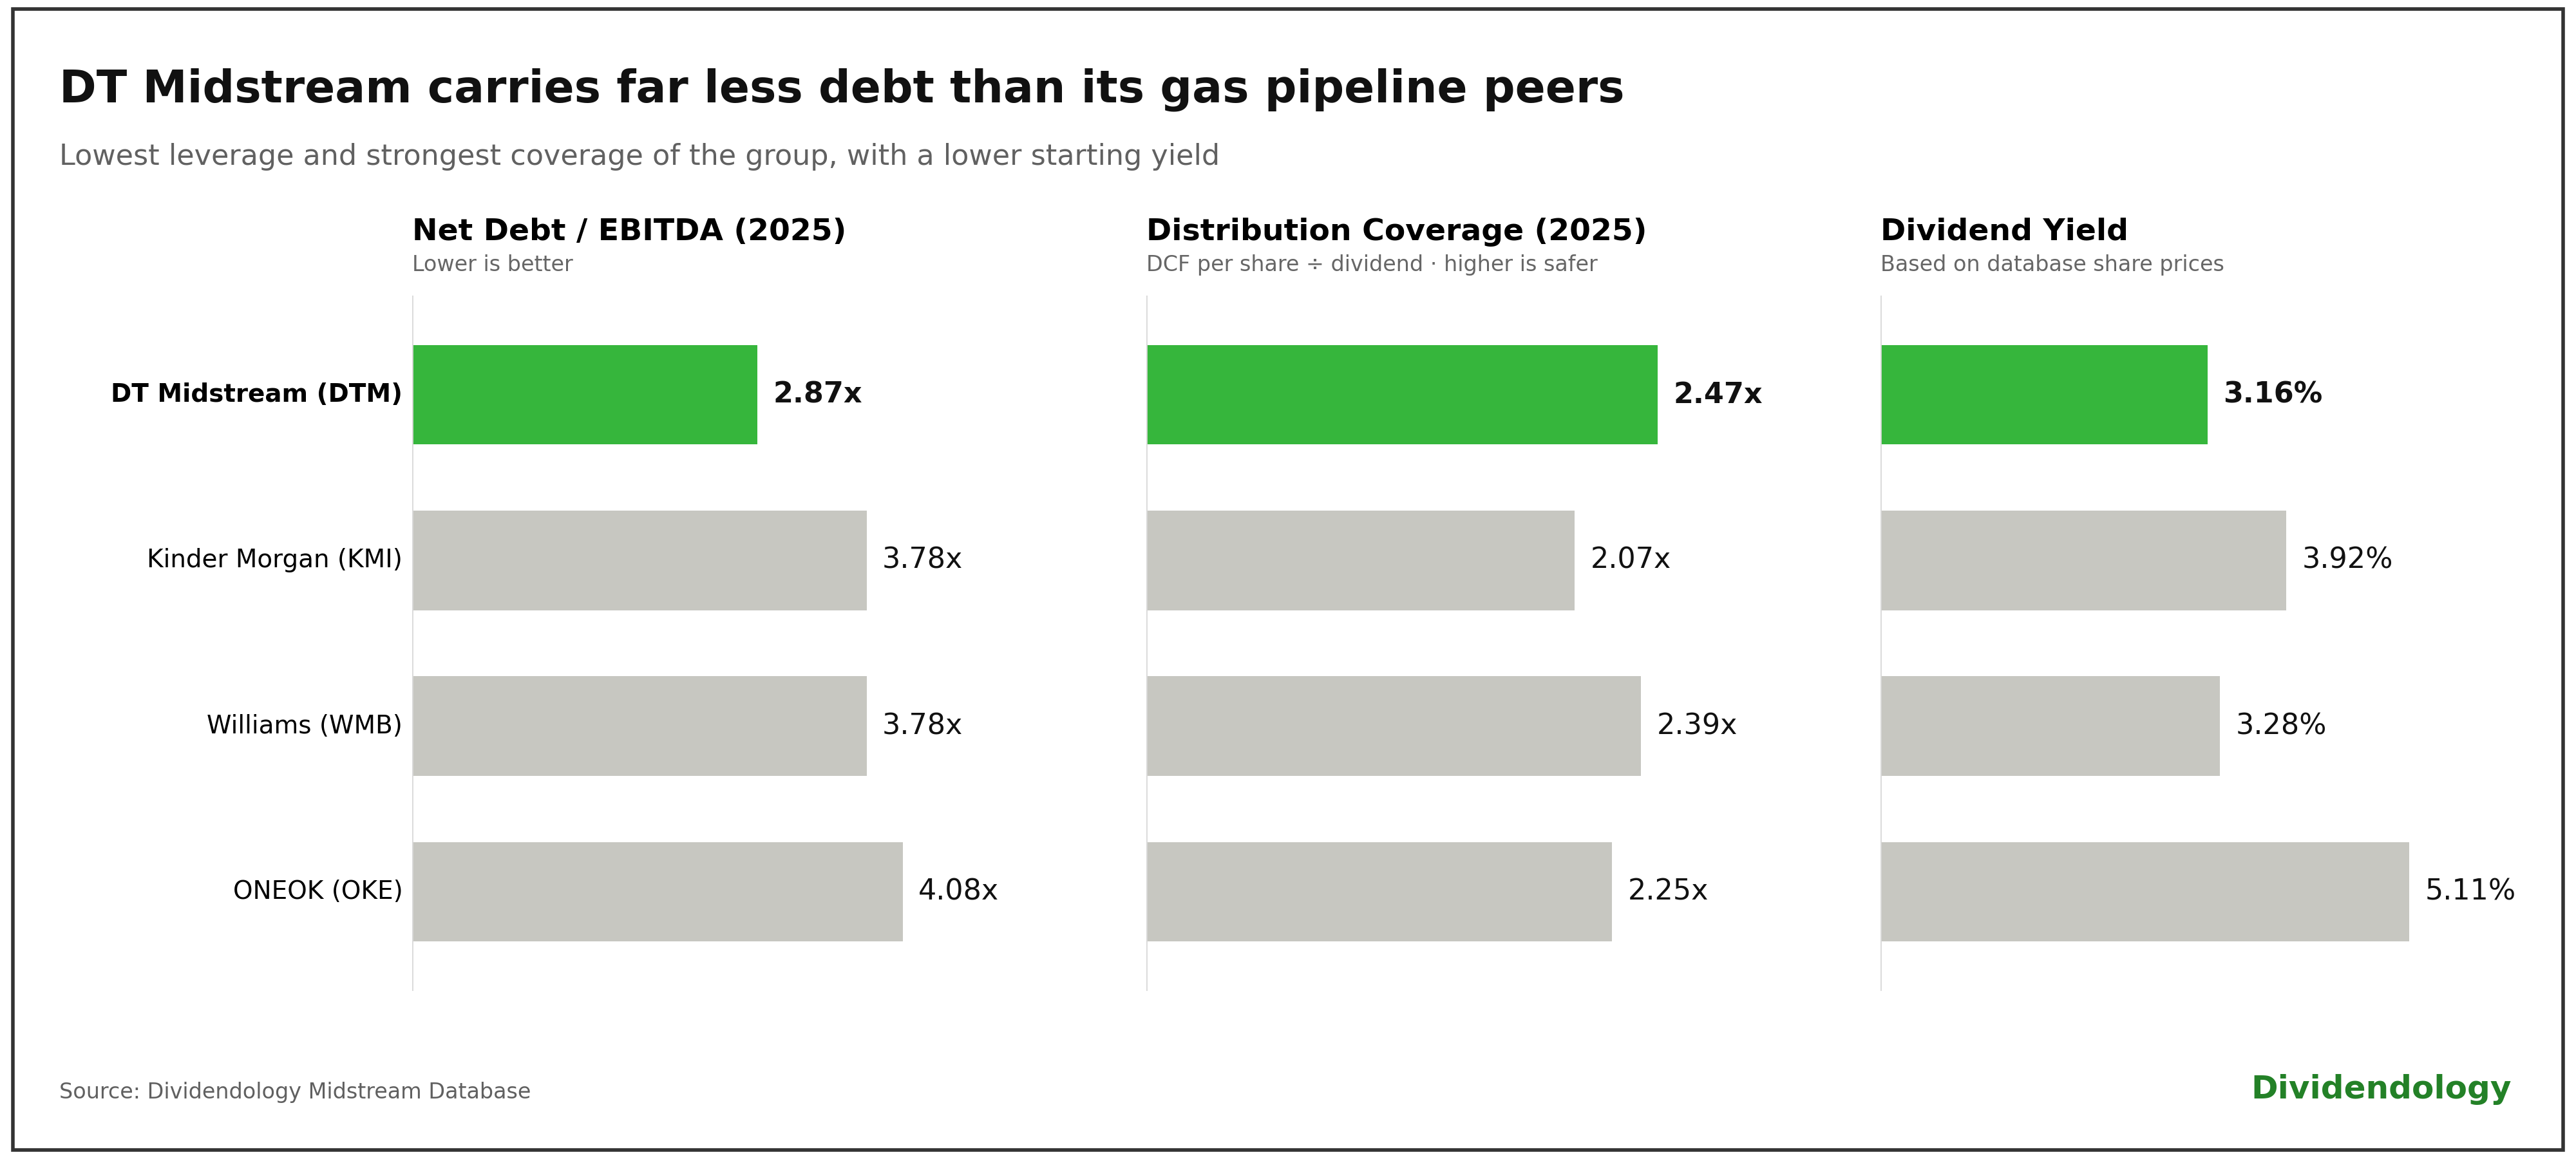
DTM’s net debt to EBITDA sits at just 2.87x, compared with 4.6x for Kinder Morgan, 4.35x for Williams and 5.03x for ONEOK.
So with a business this steady and leverage this low, the stock must be a screaming buy after a 27% drop, right?
Here’s where I have my concern.
Even after the selloff, DTM trades at about 12.75x 2026 distributable cash flow.
Its 5-year average is 9.14x, so it’s still trading at roughly a 39.5% premium to its own history.
Its 3.16% yield is also below its 5-year average yield of 3.96%.
But I do think the premium is earned to some degree.
This is a very different company than it was at its 2021 spin-off.
Leverage is down, the pipeline mix is up, and it now carries investment-grade ratings.
But it’s not just DTM.
Williams trades at a 34.5% premium to its 5-year average, and Kinder Morgan at about 20%.
The entire gas pipeline sector has re-rated on the AI power story-
And as mentioned above, their leverage ratios are down, distributable cash flow per share is growing, and dividend coverage is strong.
But for Wall Street’s $148.67 target to play out, DTM would need to trade at roughly 17x 2026 DCF, nearly double its 5-year average.
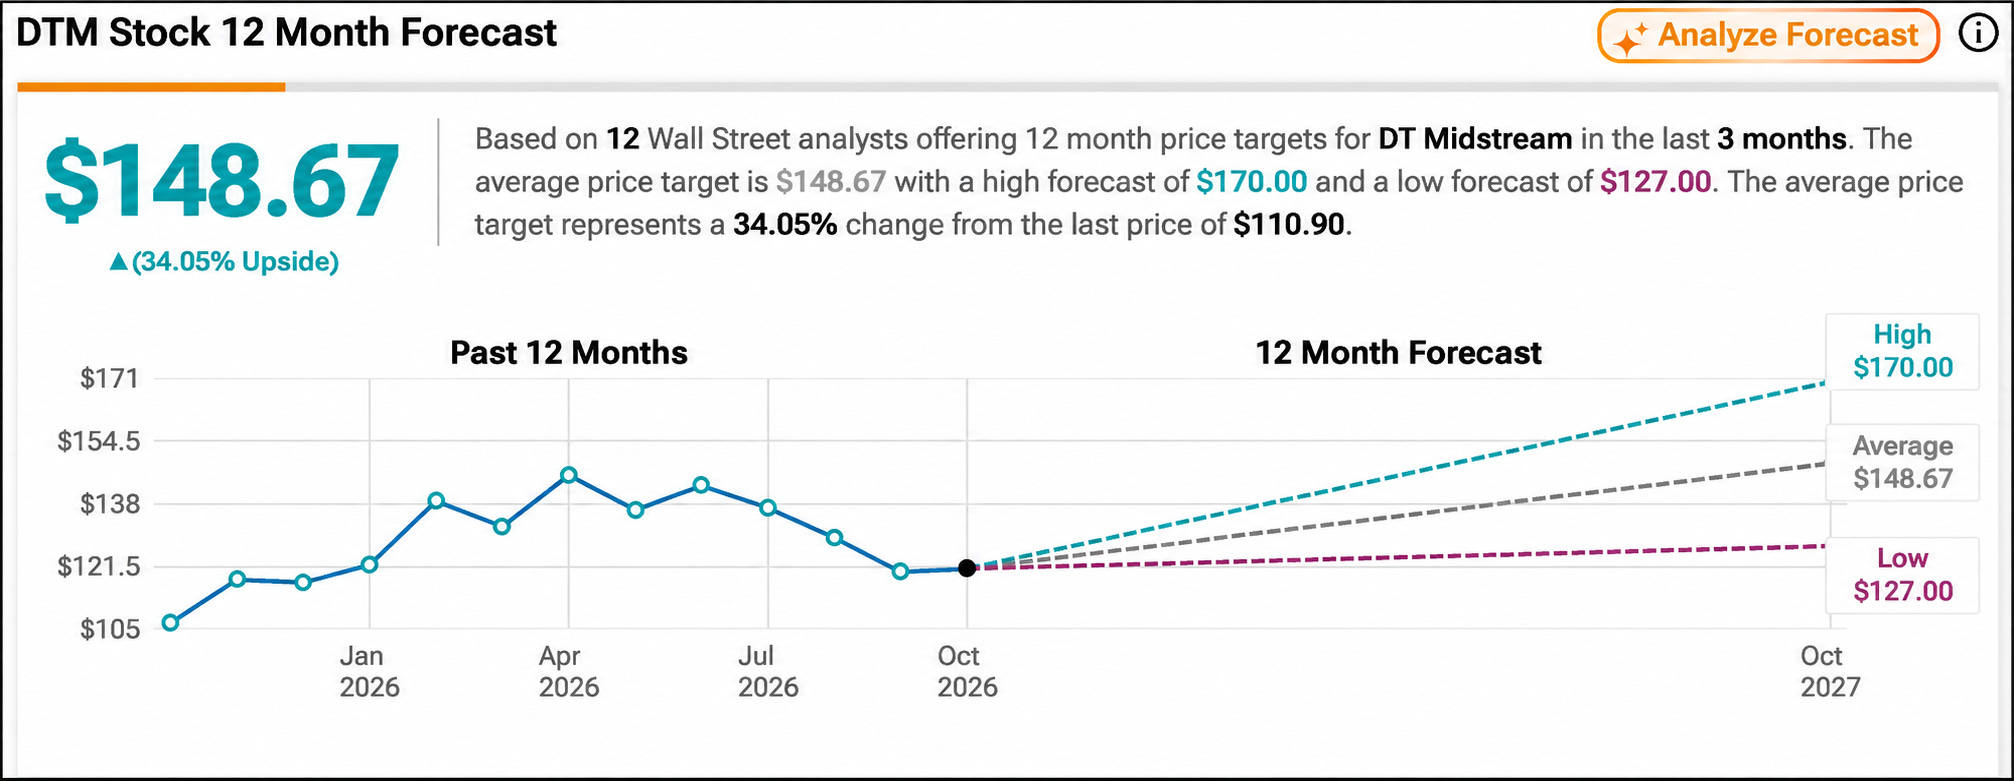
So the price target is a bit aggressive in my opinion, but the company overall is doing quite well and trading at a reasonable valuation.
A starting yield of about 3.2%, plus projected DCF and dividend growth of around 6.7%, points to a total return near 10%, as long as the multiple simply holds.
2. 🖥️ Nvidia (NVDA)
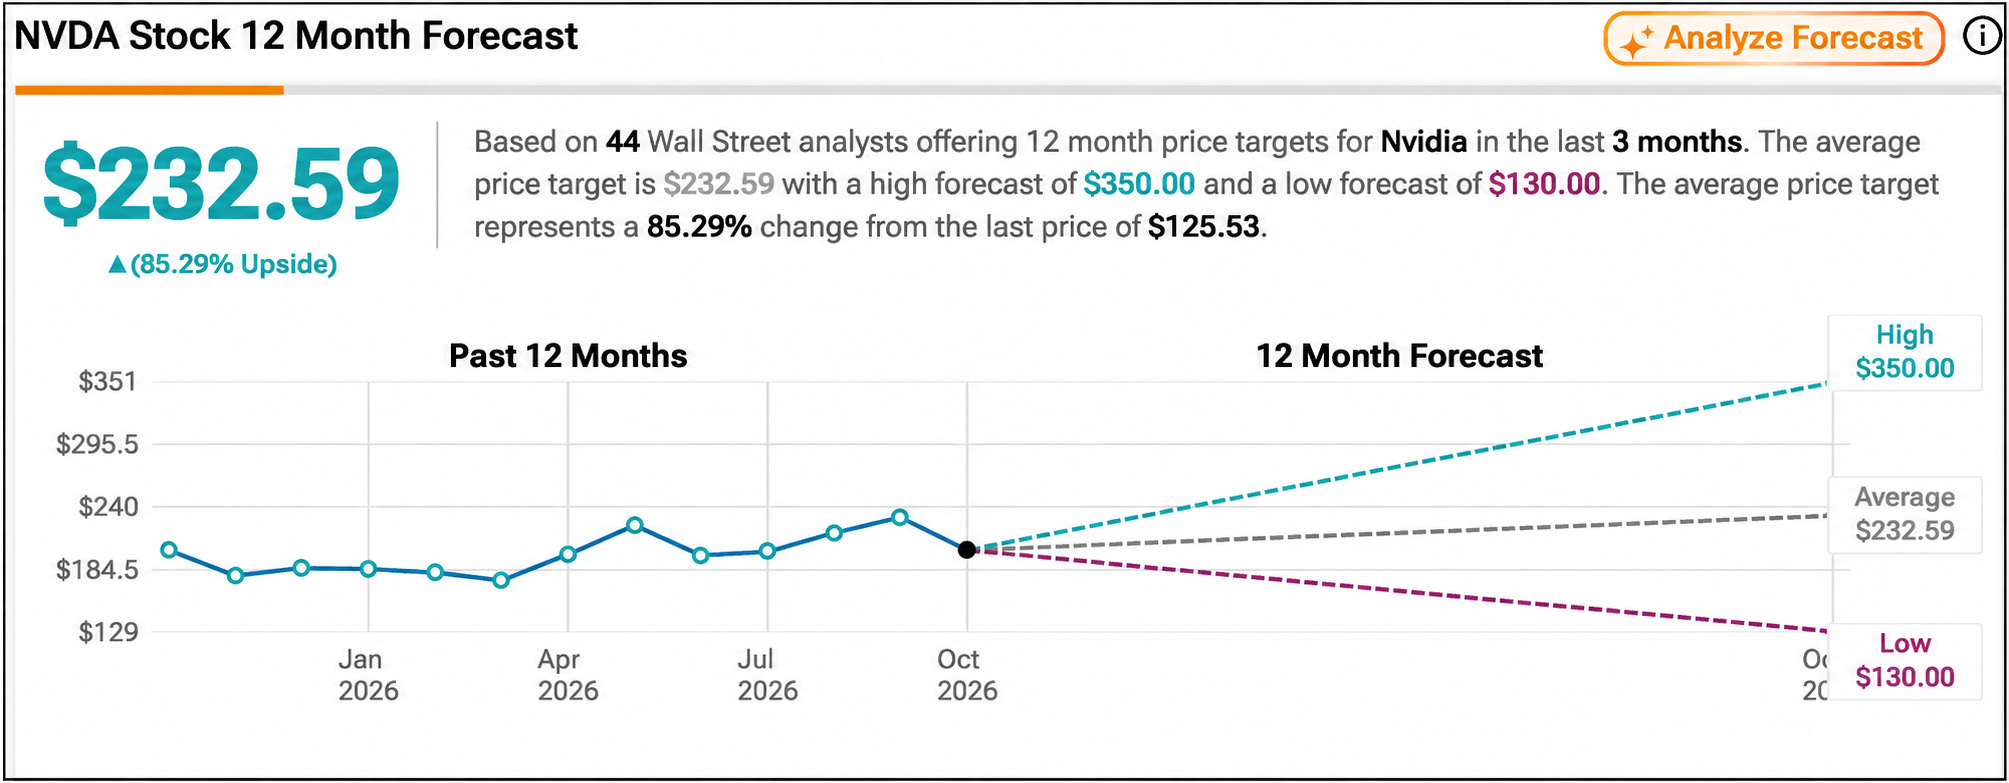
Wall St. Price Target: $232.59 | Upside: 85.29%
Nvidia just reported the best quarter in its history-
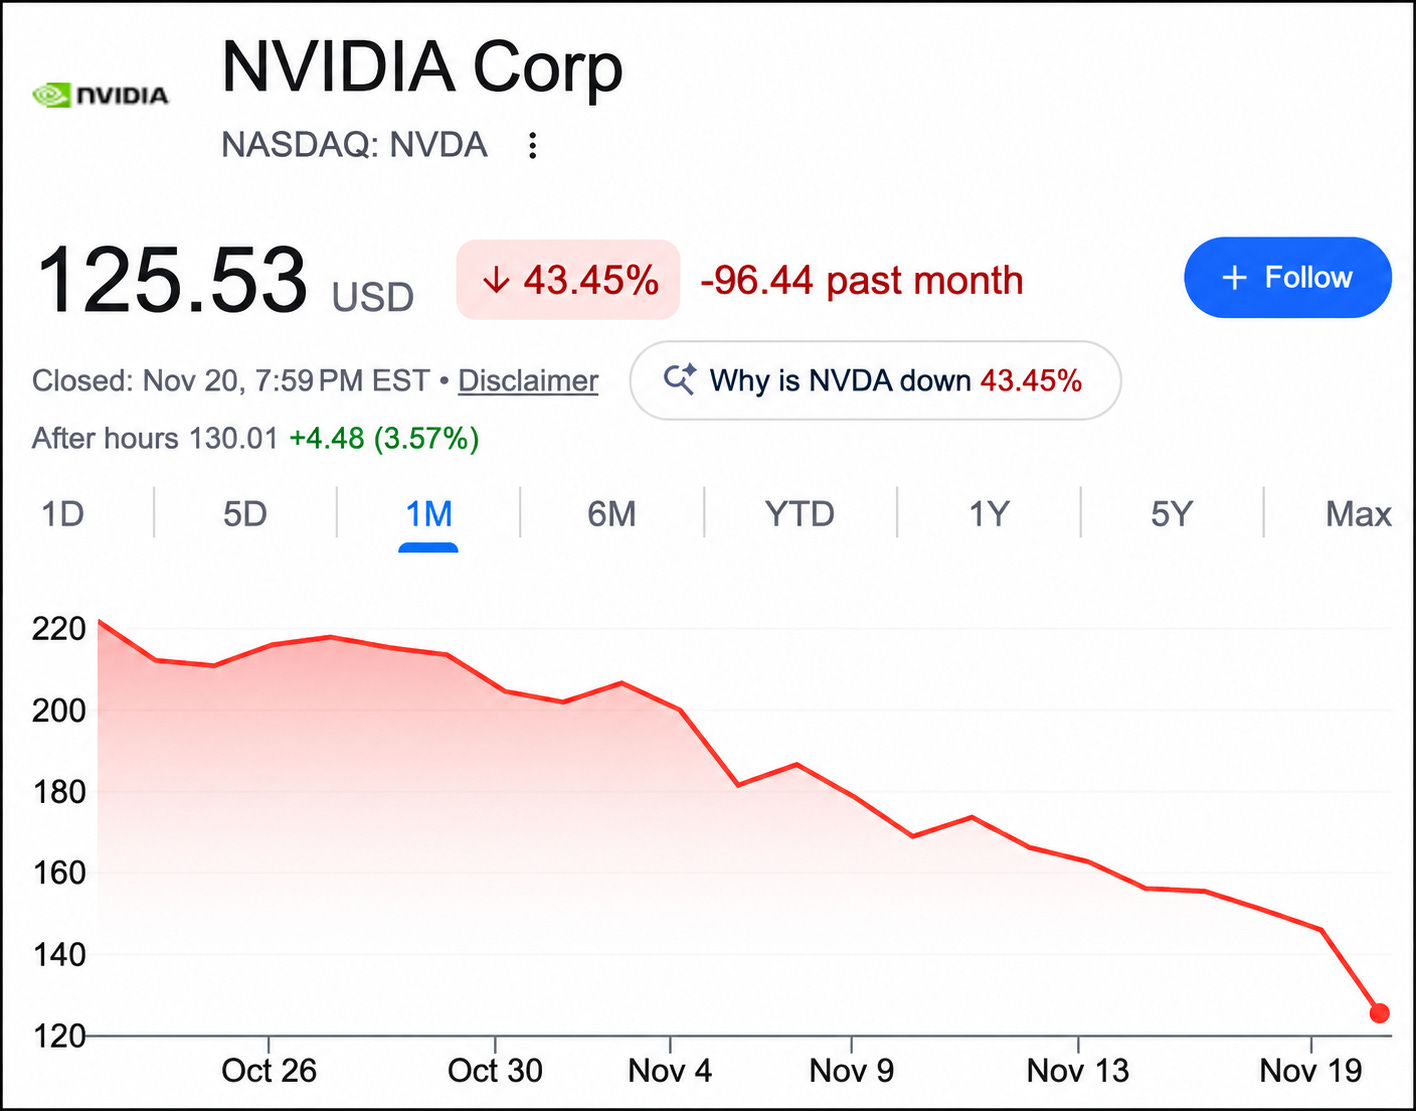
And the stock is down over 40% in a month.
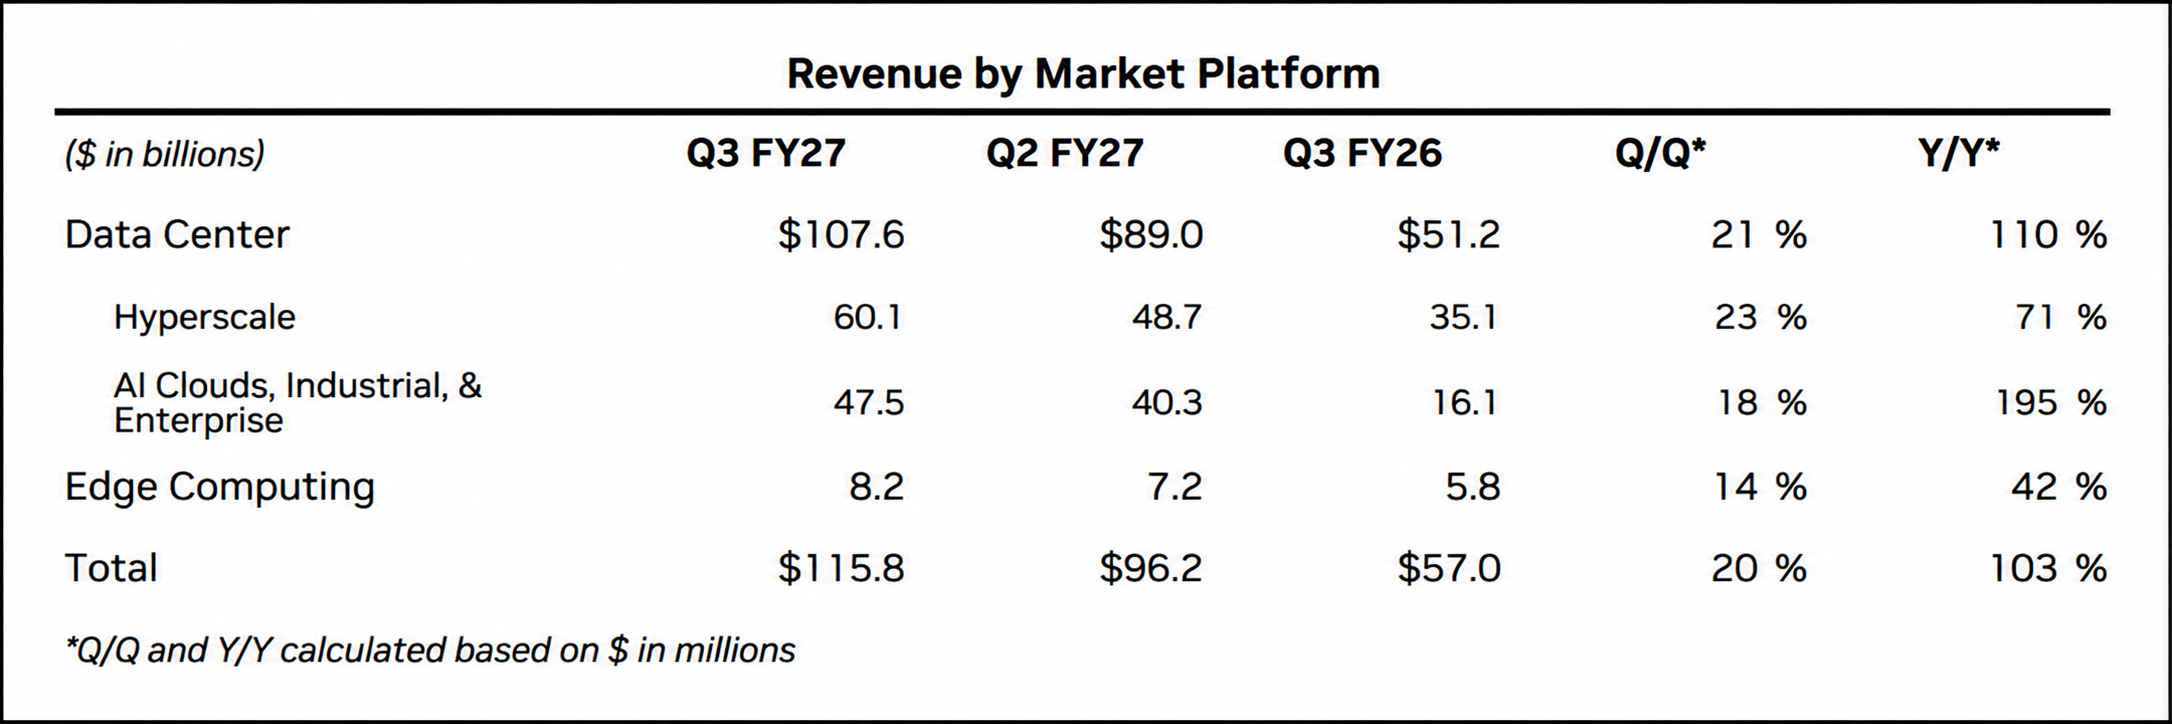
Third-quarter revenue came in at $115.8 billion, up 103% from a year ago, while Data Center revenue hit $107.6 billion, up 110%.
For context, Nvidia’s own forecast was $108 billion, and analysts expected about $109 billion.
So why is the stock collapsing?
On November 12th, Jensen Huang resigned as CEO and left the board, effective immediately.
CFO Colette Kress is now interim CEO, while the board searches for a permanent replacement. The board has also said it doesn’t intend to bring Huang back.
Here’s how I think about this.
A change in leadership will do very little to Nvidia’s cash flows over the next 1-3 years.
Customers have already placed the orders, and the product roadmap is in place.
The real question is what cash flows look like 7, 8, 9 or 10 years from now-
And that’s where the uncertainty kicks in.
Uncertainty always leads to lower valuation multiples.
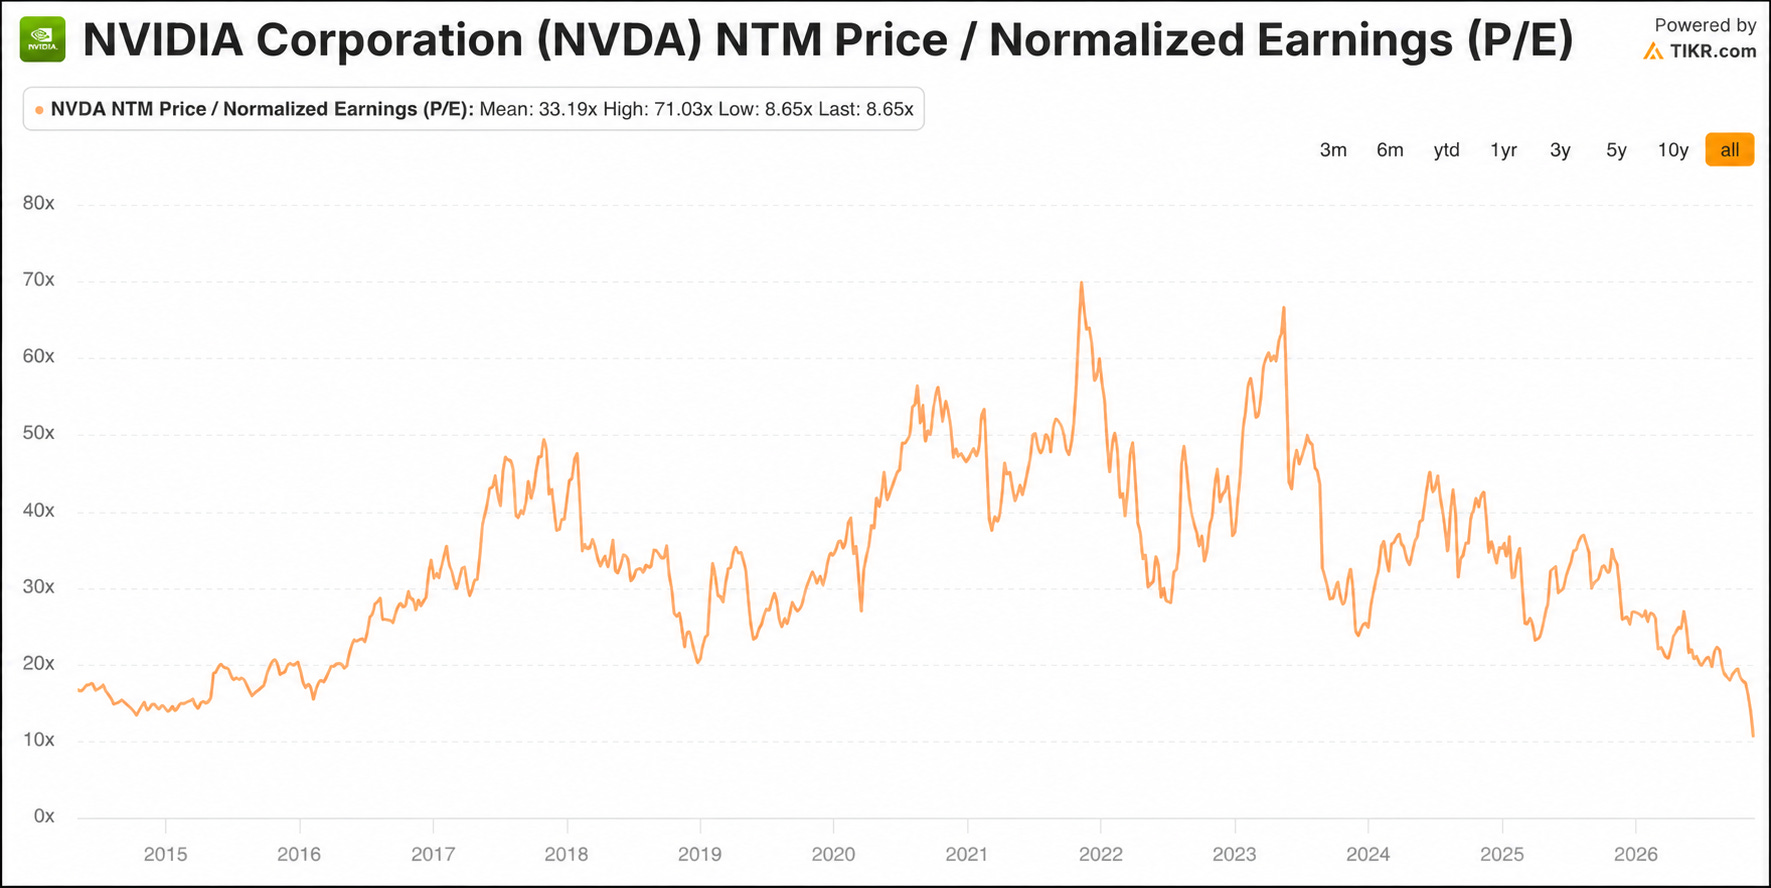
Nvidia now trades at around 9x earnings, its lowest multiple in over 5 years, after trading at roughly 70x at one point.
And here’s what’s interesting-
Even after losing its CEO, management raised its fiscal 2028 revenue growth guidance to about 75%, up from 70% previously.
The customer base is also broadening.
AI cloud, industrial and enterprise customers brought in $47.5 billion of Data Center revenue last quarter, up 195% year over year. Hyperscalers grew 71%.
In other words, this isn’t just four big tech companies writing checks anymore.
With that being said, there are three things I’m watching closely:
The first is margins. Gross margin was 74.8% in Q3, but management guided Q4 to between 71% and 72%. That’s not alarming on its own, but if it keeps falling, it will offset some of that revenue growth.
The second is China. The Q4 outlook of $130 billion assumes zero Data Center compute revenue from China, so the AI buildout alone is carrying the forecast.
The third is the same issue we’ll discuss with Broadcom in a moment: customer financing.
Nvidia now discloses guarantees with a maximum gross exposure of about $118 billion, tied in part to supporting data center buildouts for its customers.
Management of course says this isn’t new.
But if a customer’s project gets delayed or runs into trouble, Nvidia’s exposure becomes much more real.
Now here’s what dividend investors may have missed.
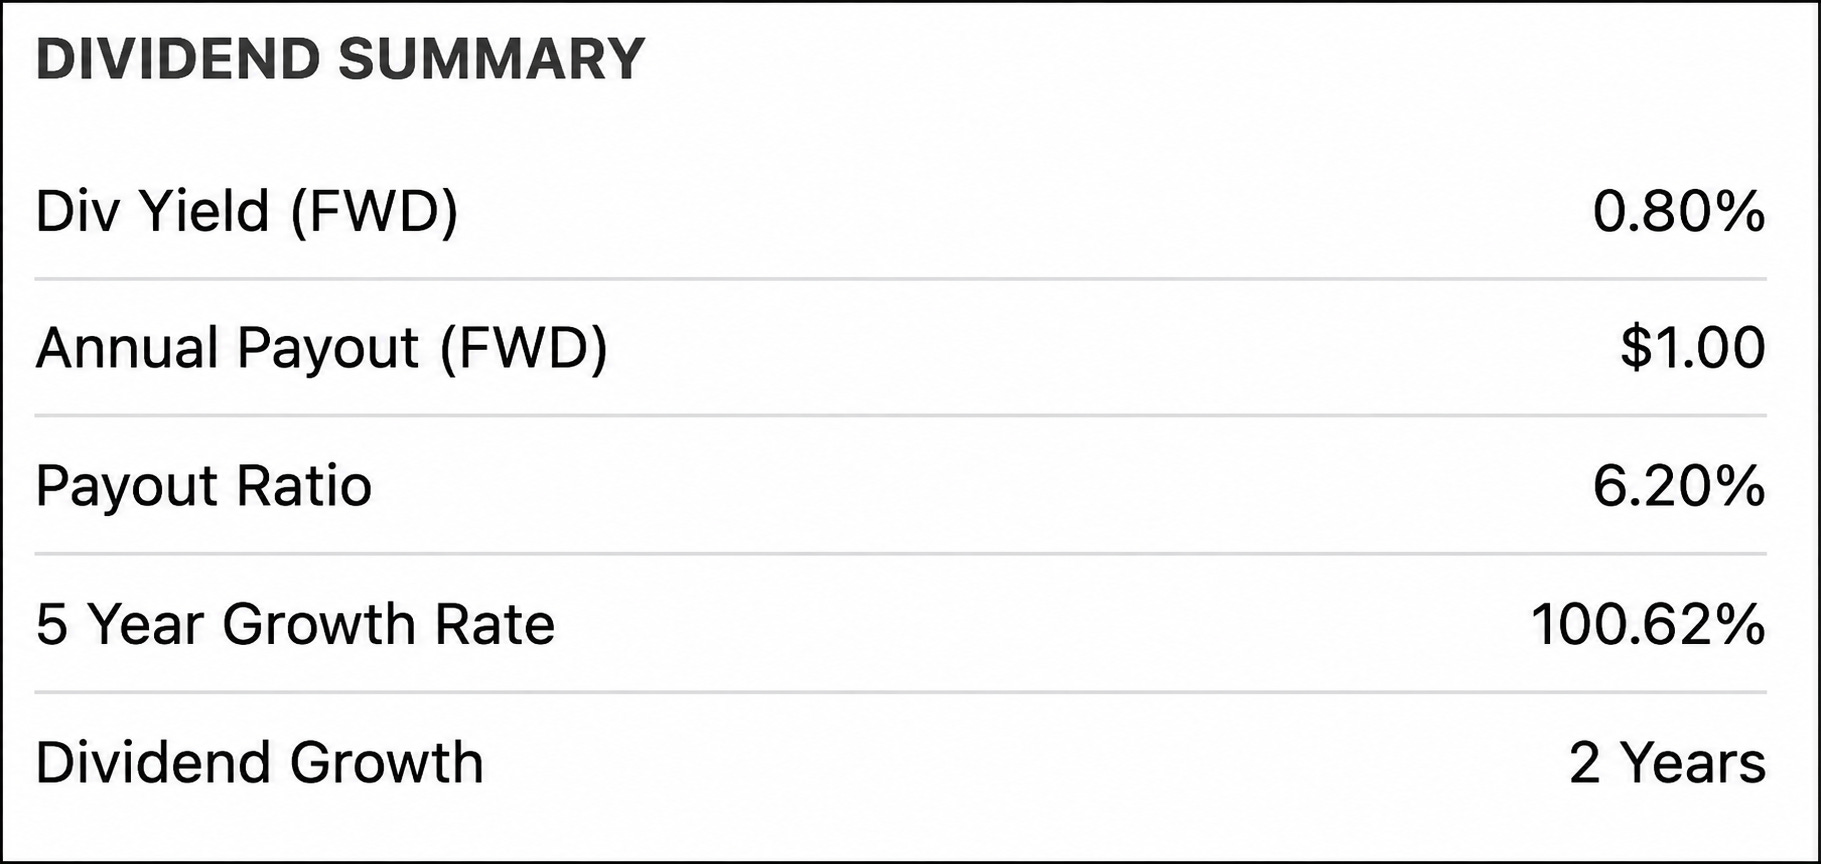
Earlier this year, Nvidia raised its quarterly dividend from $0.01 to $0.25 per share.
At today’s price of around $125, that’s a forward yield of roughly 0.80%.
For the first time in years, Nvidia’s yield is in line with other dividend growth tech stocks.
And the buyback is even more interesting.
The board approved a $150 billion increase to the buyback, leaving roughly $227.3 billion authorized.
At today’s price, here’s what that math looks like:
$227,300,000,000 ÷ $125.53 = 1.81 billion shares
That’s roughly 6.5% of the entire company.
If Nvidia achieves the average analyst 5-year EPS CAGR of around 53% and trades at just 15x trailing earnings in 2030, you’d be looking at a price target of roughly $374.
That’s a compounded annual return of around 24.41%.

Even if 2030 earnings come in substantially lower and the multiple falls to 12x, the model still points to a CAGR of around 11%.
That’s still well above historic market averages.
Wall Street’s average price target implies 85% upside.
The math supports it, as long as you believe the demand holds up without Jensen Huang leading the company.
Keep on eye on risk number three listed above though.
That’s what would unwind everything.
3. ⚡ Broadcom (AVGO)
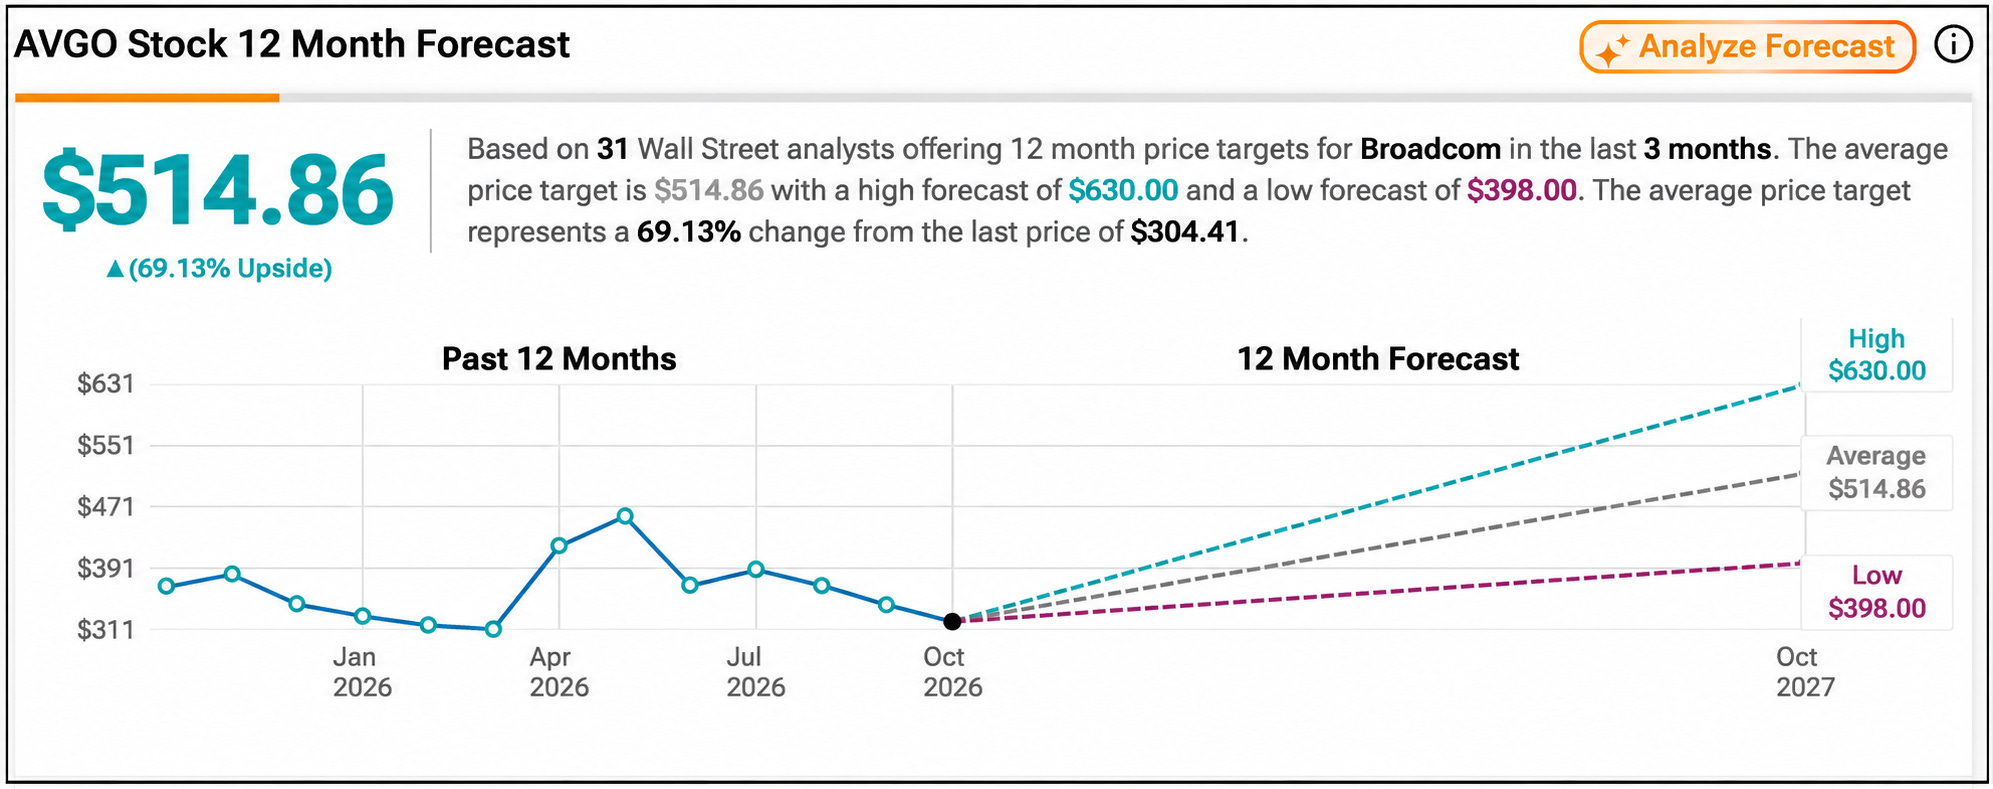
Wall St. Price Target: $514.86 | Upside: 69.13%
In September, Broadcom made our list of undervalued dividend stocks at around $366 a share.
Today, it’s trading around $304.
In complete transparency, that’s a decline of roughly 17% since we wrote about it.
So let’s be honest about what changed, and what didn’t.
What didn’t change is the growth.
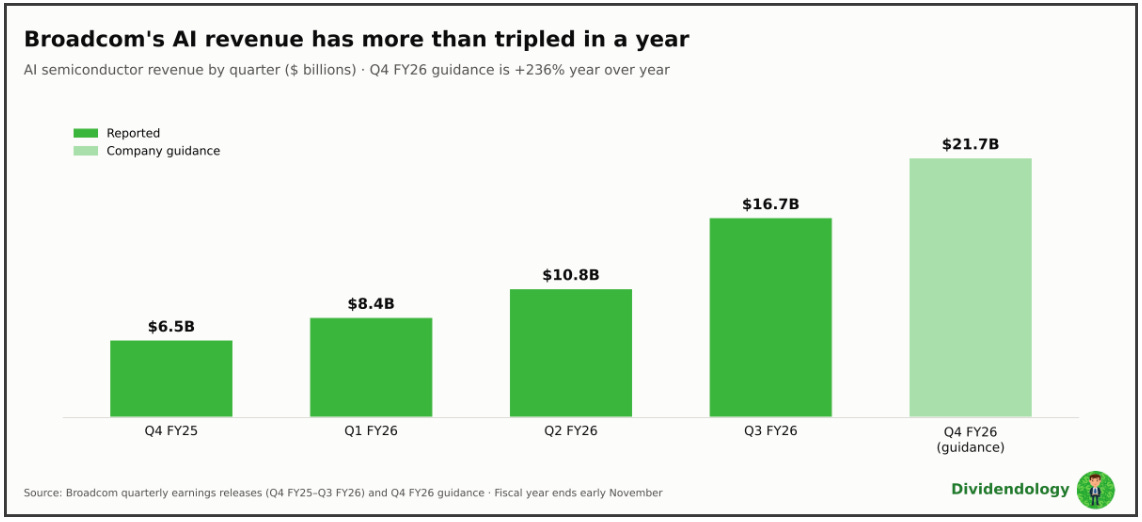
Q3 AI semiconductor revenue hit $16.7 billion, up 221% year over year.
Management expects Q4 AI revenue to accelerate to $21.7 billion, up 236%, with total Q4 revenue of $34.8 billion, up 93% from a year ago.
And the long-term outlook is even more mind blowing.
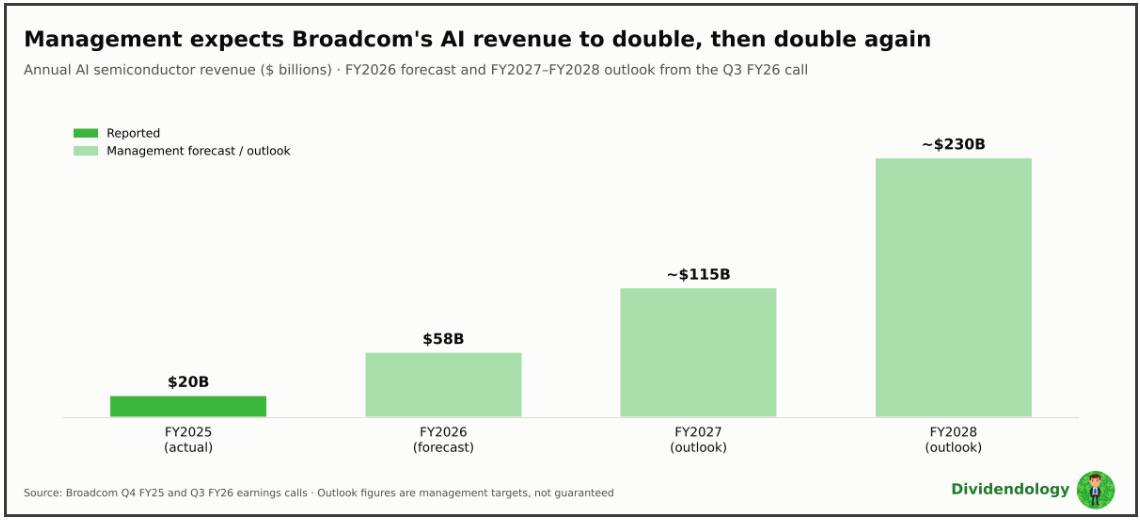
Management expects AI revenue of $58 billion in fiscal 2026, roughly $115 billion in fiscal 2027 and roughly $230 billion in fiscal 2028.
In other words, Broadcom expects its AI business to roughly double in each of the next two years.
Broadcom also generated $13.7 billion of free cash flow in Q3 alone, or 46% of revenue.
On valuation alone, the stock looks absurdly cheap.
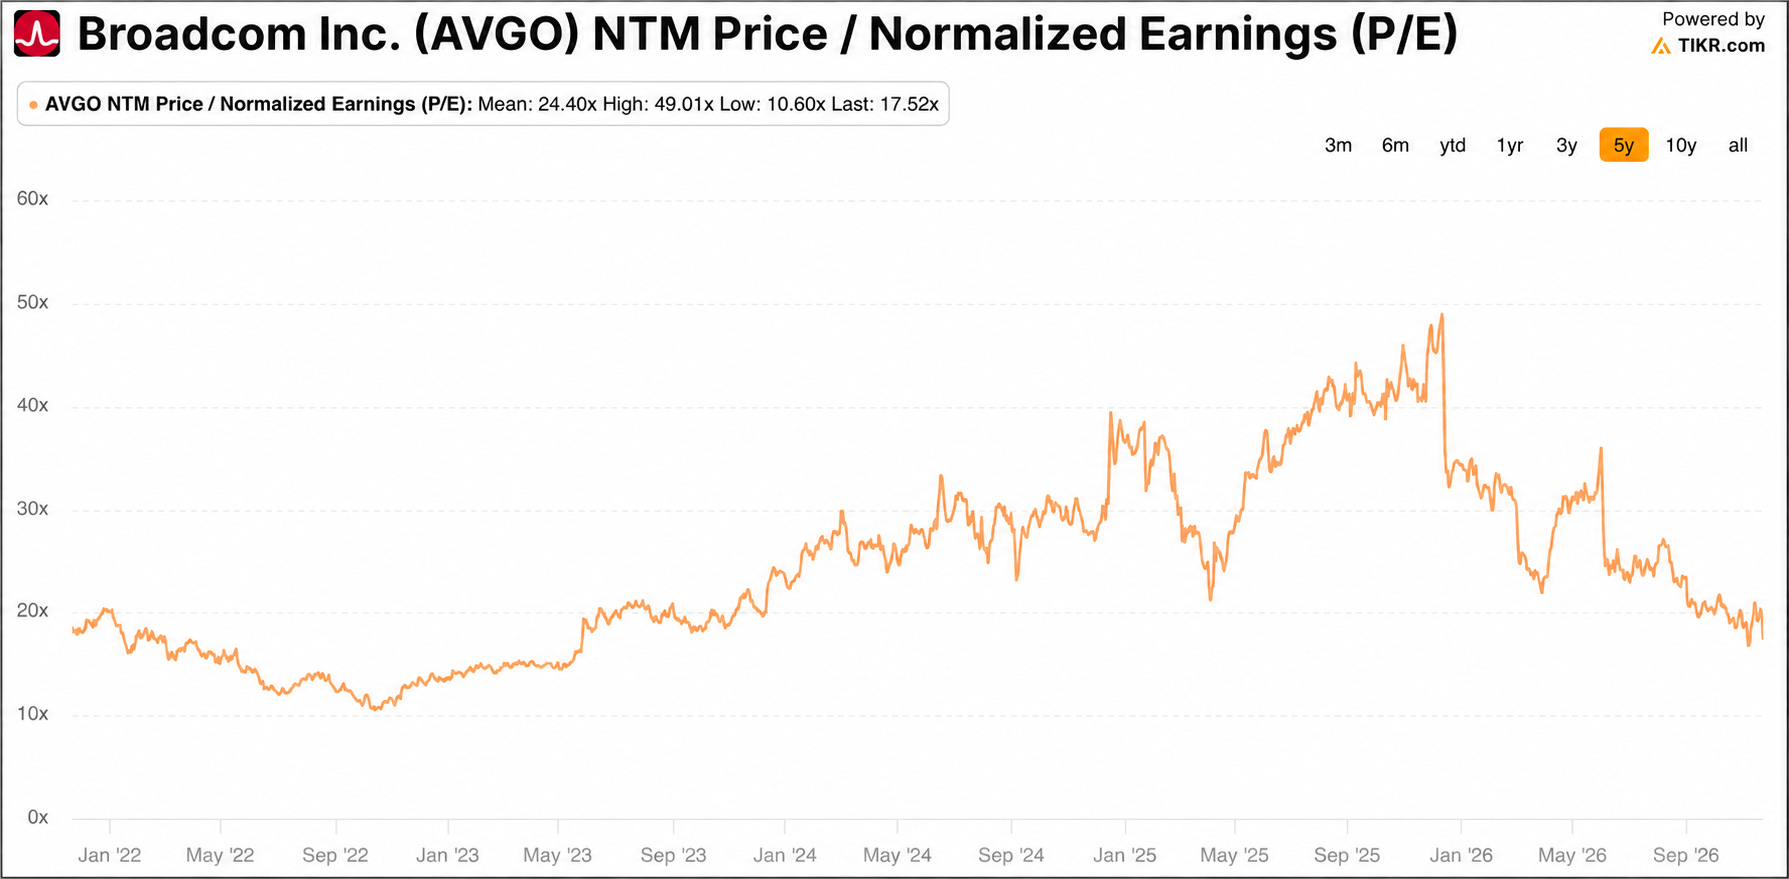
Broadcom traded at about 49x earnings at the end of 2025.
Today, it trades at under 18x forward earnings, with a PEG ratio of just 0.26.
So what’s the problem?
With Broadcom, the concern isn’t the price…
It’s the quality of earnings.
Broadcom isn’t just selling chips to AI labs anymore-
It’s helping finance them.
Broadcom already backs a $42 billion senior debt package that helps fund Anthropic’s computing capacity, and it’s now working to arrange $30-$50 billion more in financing for OpenAI’s custom chips.

Those OpenAI talks are still preliminary, and OpenAI’s chip project has reportedly already run into funding hurdles.
But the direction is clear.
In other words, Broadcom’s largest customers increasingly need Broadcom’s help to pay for Broadcom’s products.
That creates two risks stacked on top of each other:
Customer concentration: a handful of AI labs and hyperscalers drive most of the growth.
Credit exposure: if one of those customers struggles, Broadcom feels it on both the revenue line and the financing side.
If everything goes well with those customers, Broadcom will be one of the biggest winners of the decade.
But this is exactly why the market is refusing to pay up.
If these risks come to fruition, earnings would drop substantially for Broadcom.
Wall Street seems to believe a good portion of the customer risk is already priced in, giving them 69% upside from current prices.
There’s also a near-term catalyst to watch.
Broadcom reports Q4 earnings on December 9th, which is typically when it announces its annual dividend increase.
Last December, it raised the quarterly dividend 10% to $0.65 per share.
At current prices, that’s a yield of about 0.85%.
Now, let’s dive into the full list of dividend stocks with the most upside according to Wall Street.