
🏆 List of Undervalued Dividend Stocks (January '26)
These Stocks are Undervalued! 🔥

At the beginning of each month, I send out a spreadsheet that lists out the dividend stocks that I believe to be undervalued.
This is the end result of 100’s of hours of research every month.
It’s time to dive in.

1. 💳 Visa (V)
I love it when markets are irrational.
It’s a huge advantage for long-term investors, as it can create incredible opportunities.
Visa has sold off more than 5% today following headlines around a proposed 10% cap on credit card interest rates.
At first glance, this reaction makes sense.
Visa is often lumped in with “credit card companies.”
But this is a critical misunderstanding.
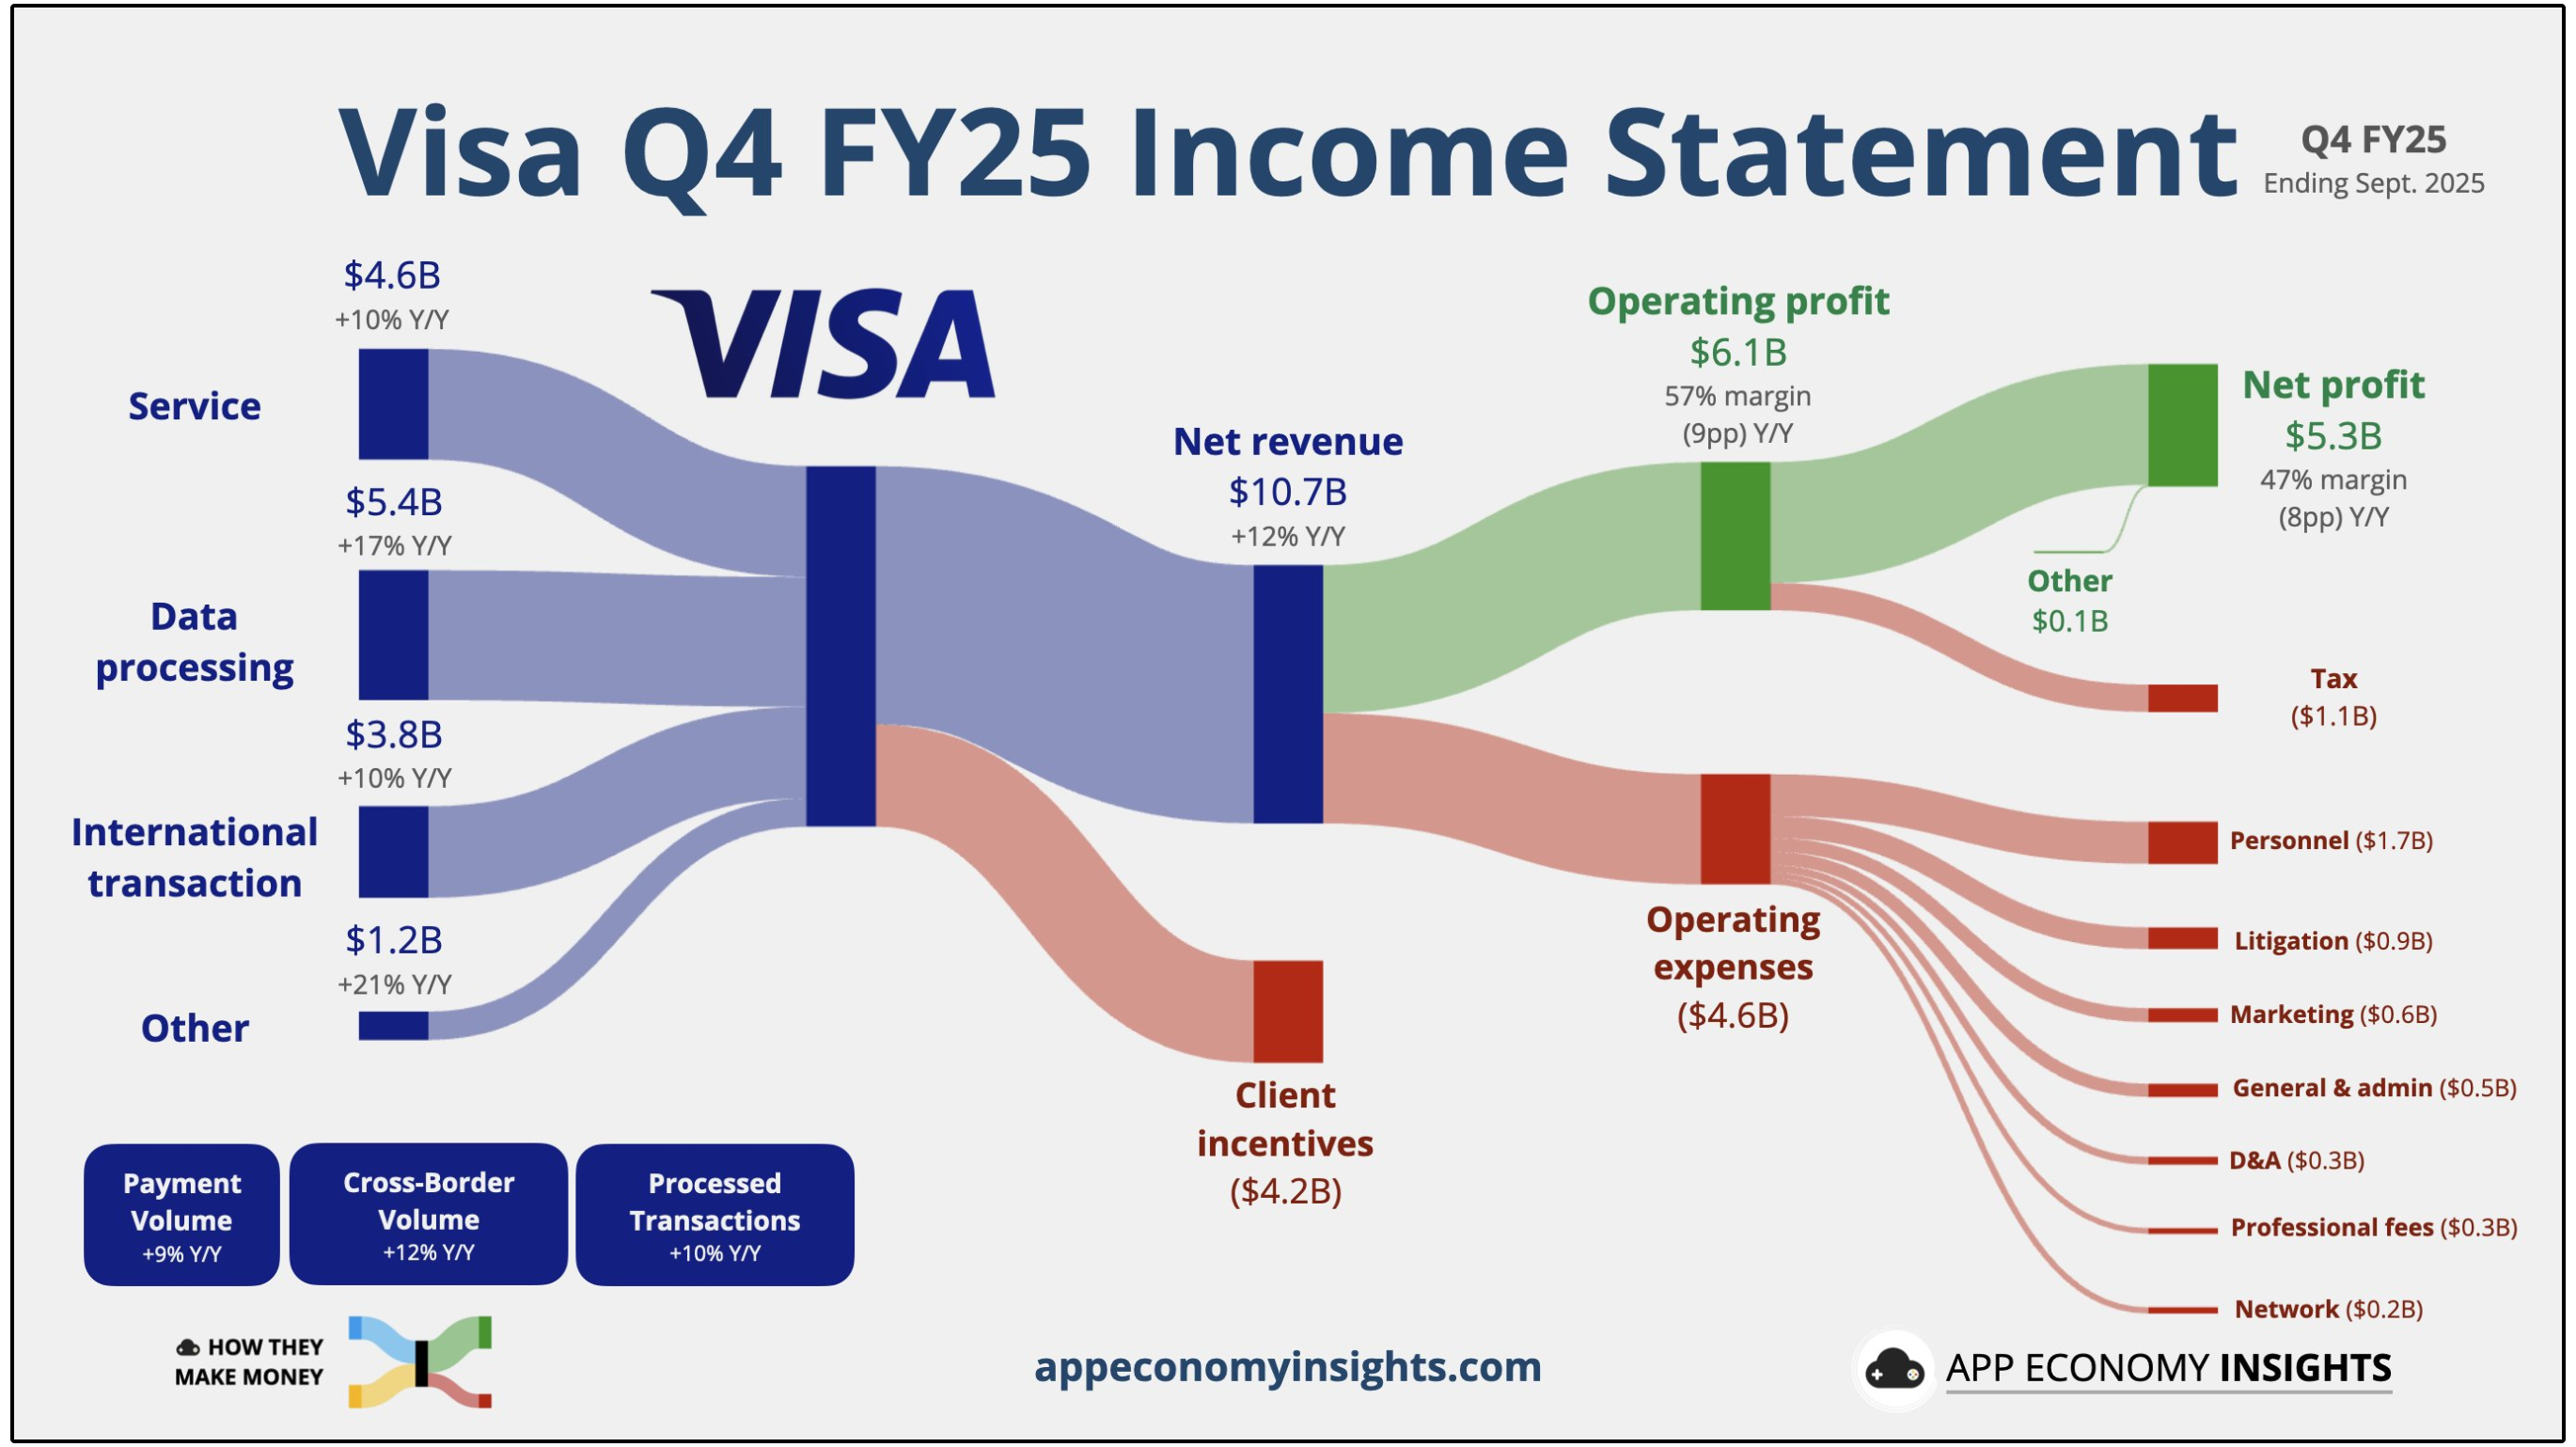
Visa operates with four primary revenue segments:
Service Revenue (value-based fees tied to payment volume)
Data Processing Revenue (fees earned per transaction processed — the largest segment)
International Transaction Revenue (cross-border and currency conversion fees)
Other / Value-Added Services (fraud, analytics, tokenization, and network services)
So here’s the issue with Visa selling off today-
Visa does not lend money, does not earn interest income, and does not take credit risk.
Interest rates charged to consumers are set by issuing banks, not Visa.
As a result, a cap on credit card APRs would primarily impact banks and specialty lenders, not the network itself.
Visa earns revenue when payments are authorized, routed, cleared, and settled across its network, regardless of whether a consumer carries a balance, pays interest, or pays their bill in full each month.
In fact, a large portion of Visa transactions come from debit cards and credit cards that are paid off monthly, where interest rates are irrelevant.
Reduced lending would impact banks’ willingness to extend credit, but transaction activity does not disappear.
Consumers still spend, merchants still accept cards, and money still needs to move digitally.
Visa continues to collect fees on that activity.
In fact, Visa’s highest-margin growth areas (data processing, cross-border transactions, and value-added services) are entirely disconnected from consumer interest rates.
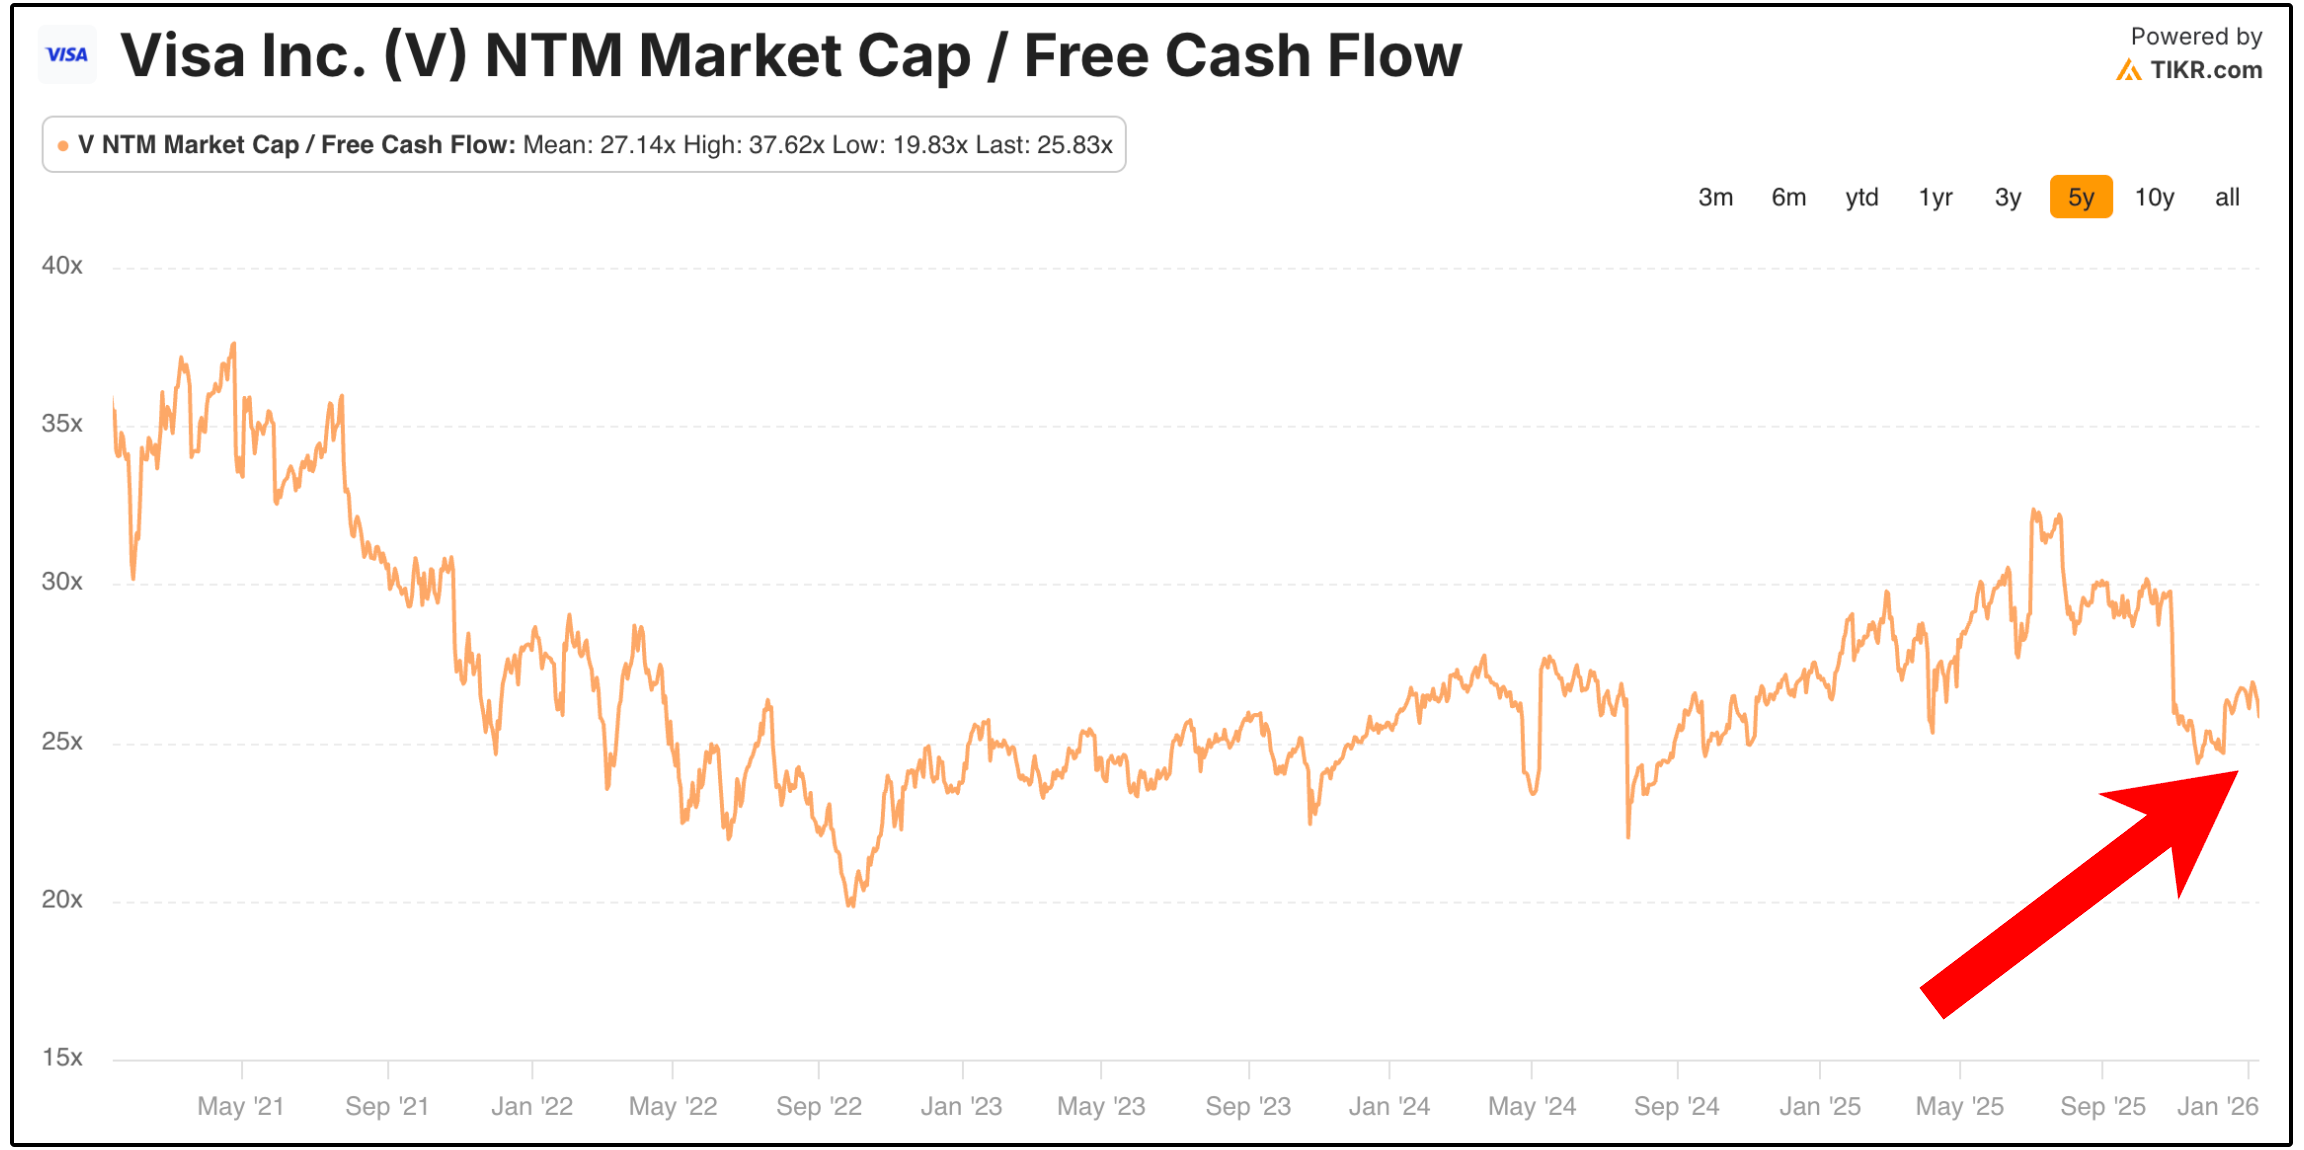
As a result of the unjustified sell-off, Visa’s now trading at a Market Cap to Free Cash Flow multiple below its historic average.
What’s interesting about proposed headlines surrounding a cap on credit card interest rates, is it actually reveals how high-quality Visa truly is.
Visa is a capital-light, highly scalable global network that benefits from powerful long-term tailwinds:
The continued shift from cash to digital payments
Global e-commerce growth
Rising cross-border travel and tourism
As a result, they generate incredibly high returns on invested capital.
2. ⛽ Energy Transfer (ET)
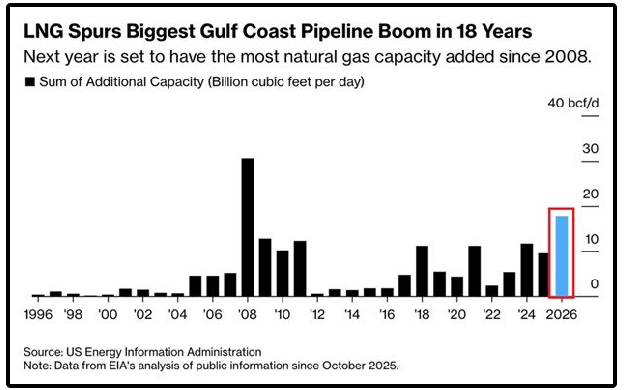
Energy is shaping up to be one of the most important investment themes of the next five years, particularly natural gas.
Bloomberg expects roughly half of incremental data-center power demand over the next decade to be supplied by natural gas, given its reliability, scalability, and cost advantages.
Energy Transfer is directly positioned to benefit.
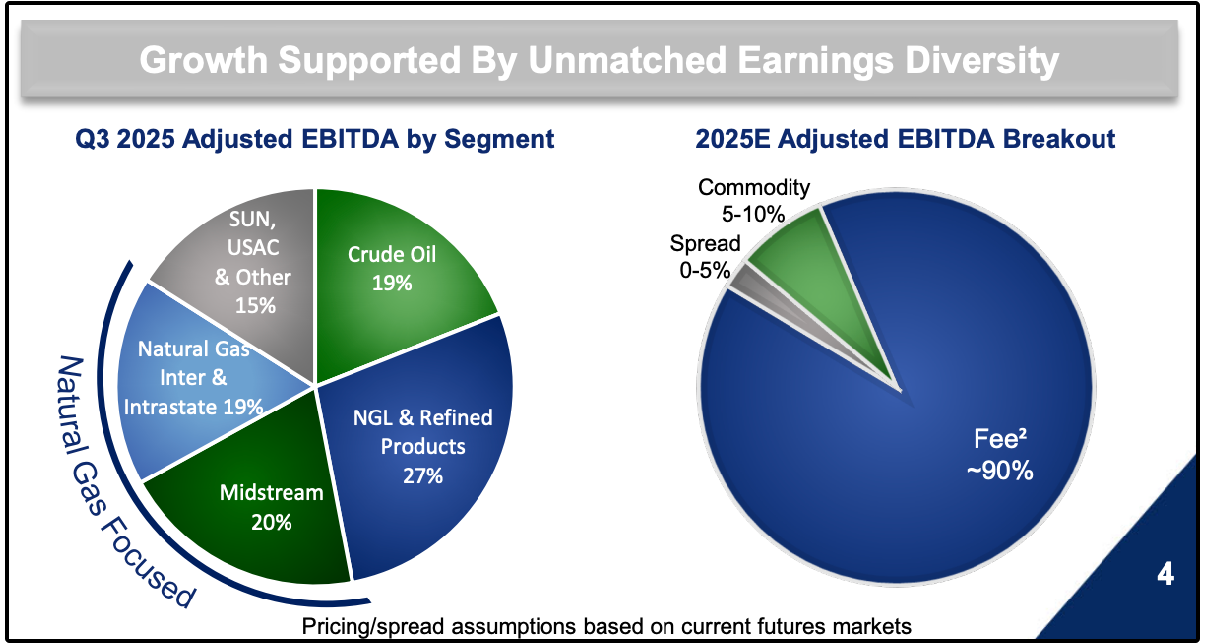
Energy Transfer is one of the largest and most strategically important midstream operators in North America, with a vast, irreplaceable network of pipelines, terminals, and processing assets spanning natural gas, crude oil, NGLs, and refined products.
These assets are mission-critical to the U.S. energy system and extraordinarily difficult and costly to replicate today, creating high barriers to entry.
Earnings from ET are not only diversified, but aren’t heavily impacted by commodity prices since 90% of their earnings are fee-based.
The balance sheet and distributions are quite attractive:
7.76%+ distribution yield, covered by stable, fee-based cash flows
Improving balance sheet, with leverage steadily trending lower after years of deliberate deleveraging
Management guidance of 3%–5% annual distribution growth
Remember, this is an MLP, and as a result, we look at distributions relative to distributable cash flow.
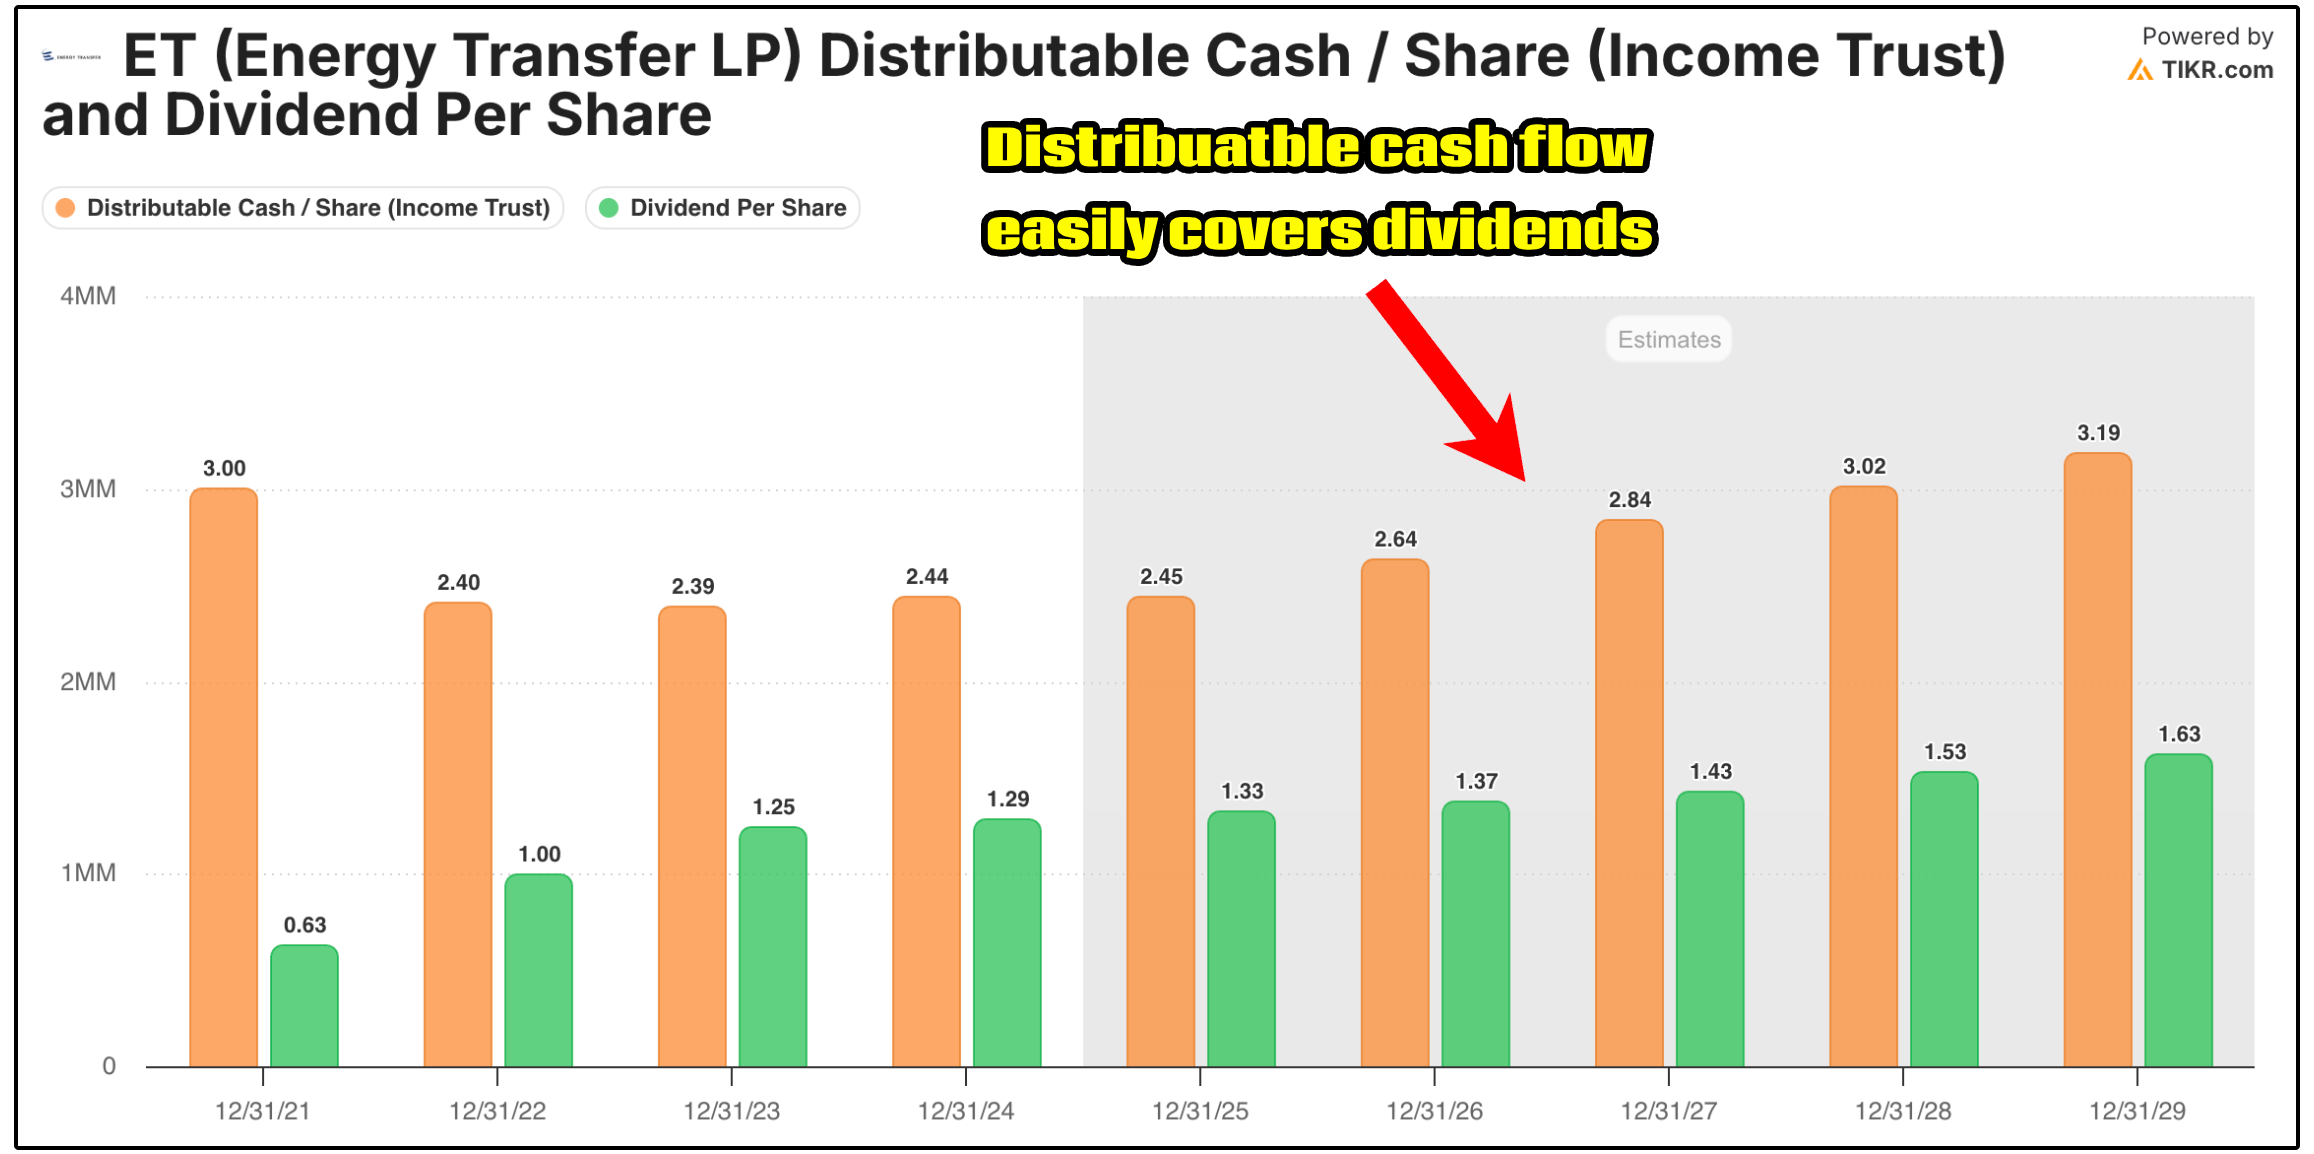
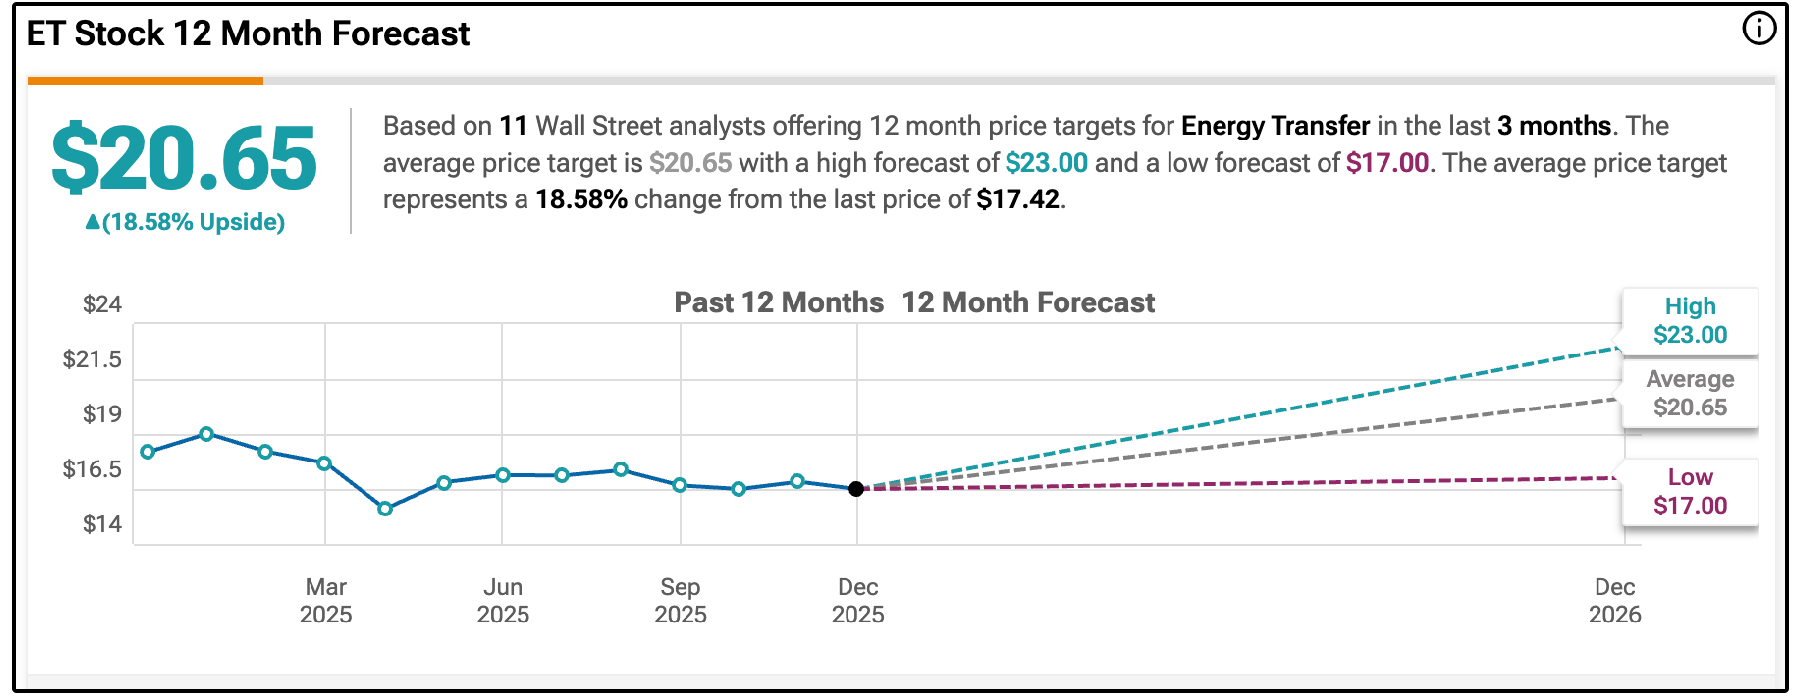
Despite the balance sheet health, the high distributions that are well covered and growing, ET still trades at a discount compared to their peers.
As a result, the average analyst is currently giving them around 18.5% upside from current prices.
3. 🖥️ Microsoft (MSFT)
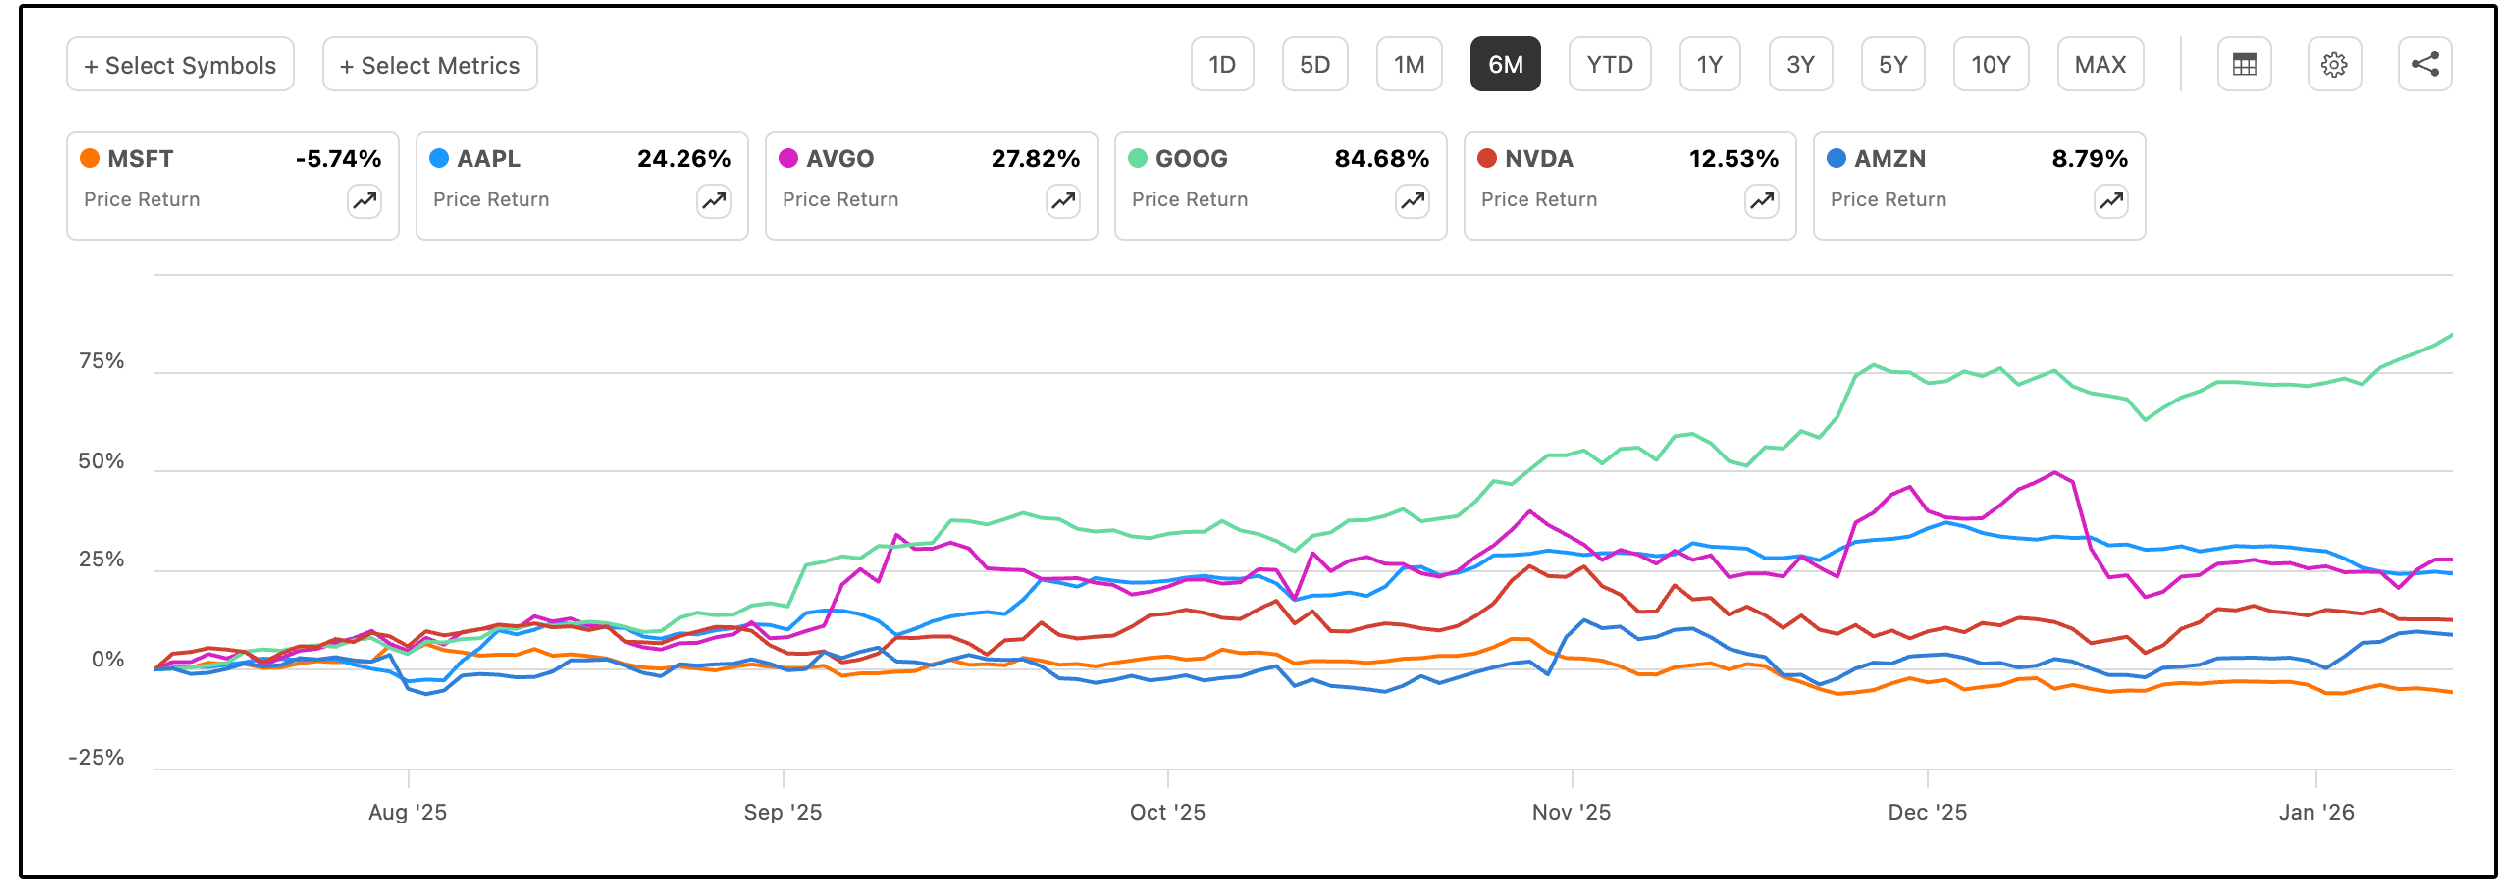
Microsoft is quietly down 6.5% in the last 6 months, and trading at its lowest price since June of last year.
While that is by no means an indicator of undervaluation, it is a stark contrast to what has happened with many of the other big tech names during the same time period.
With that being said, I consider Microsoft potentially one of the greatest businesses of all time.
It’s so well diversified across its businesses segments, one could even consider it a ‘mini-ETF’.
However, if we value the stock relative to their free cash flow, it appears they are trading at their highest valuation in the last 5 years.
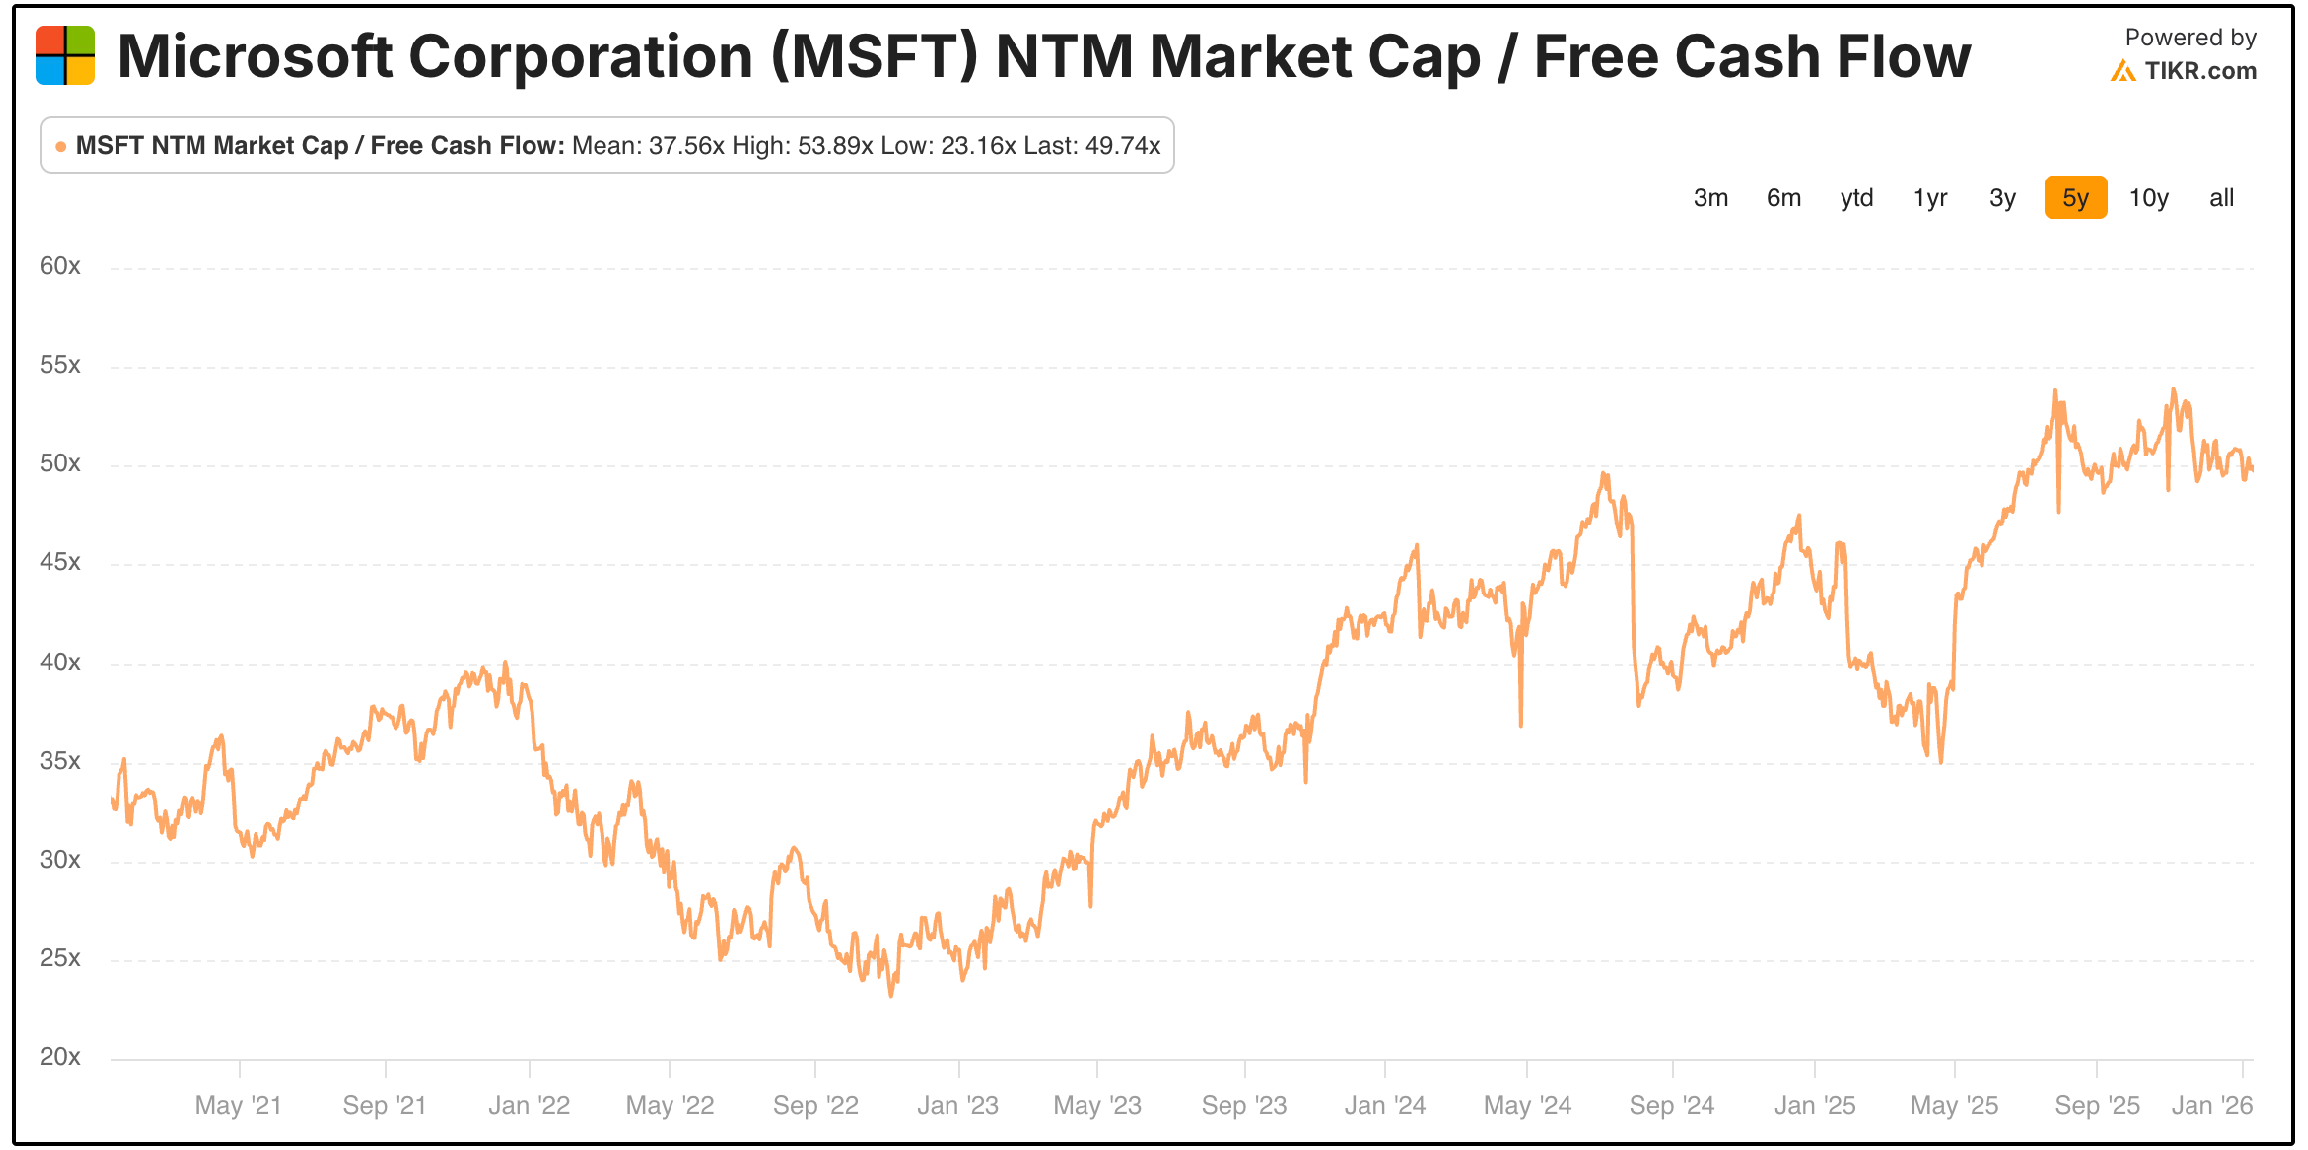
Here’s the good news:
This is incredibly misleading.
That elevated valuation is largely a function of temporarily depressed free cash flow, driven by unusually high capital expenditures tied to AI infrastructure build-out.
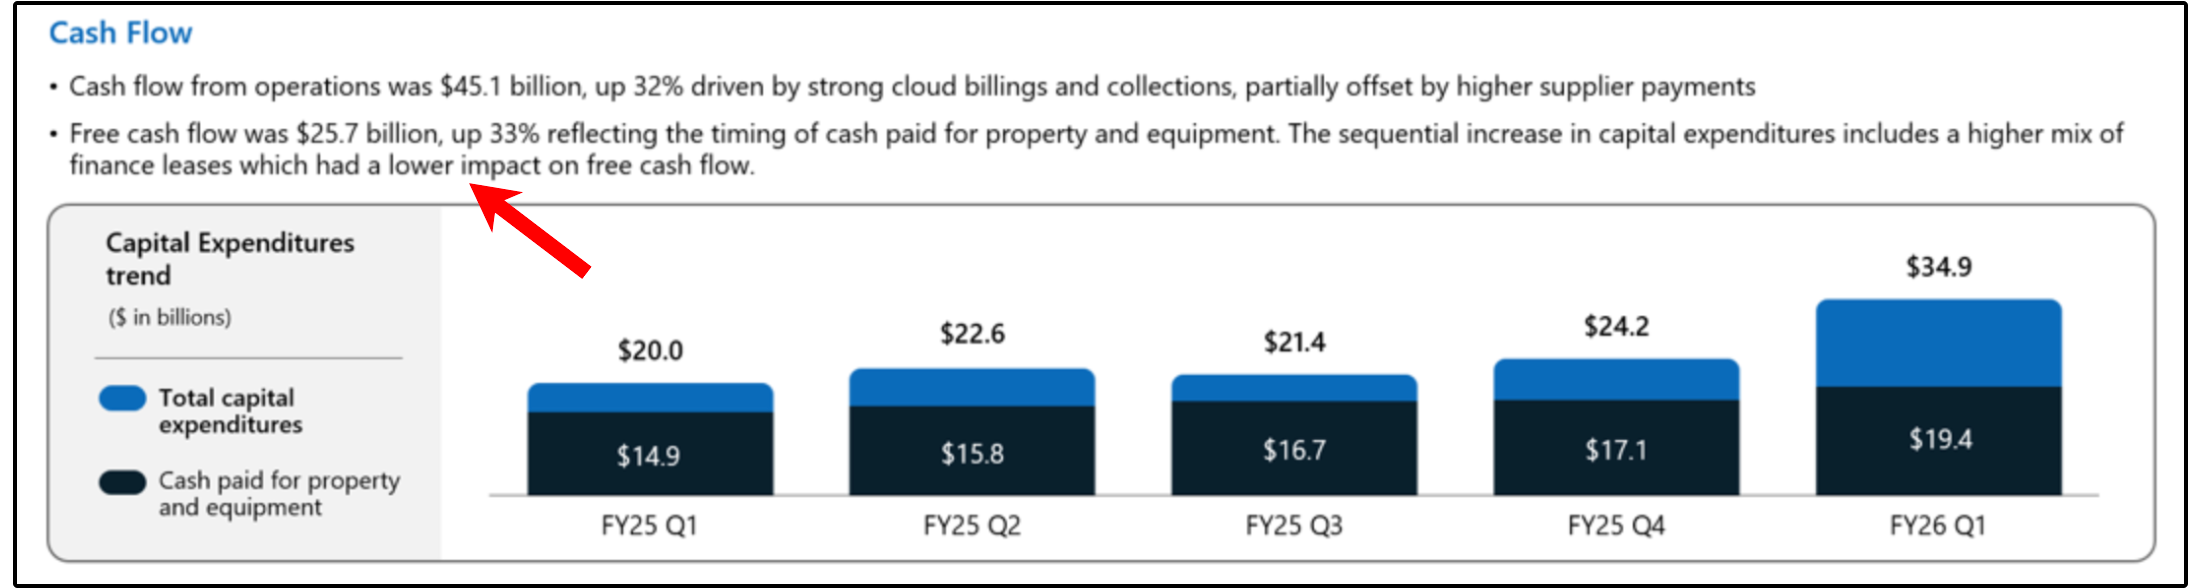
In other words, Microsoft does not look expensive because the business is weakening, it looks expensive because the company is investing far more aggressively than normal.
This distinction matters.
Not all capex is created equal.
In general, there are two types of capital expenditures:
Maintenance capex is spending required simply to keep the business running at its current level. It preserves existing revenue but does not meaningfully increase future earnings power.
Growth capex, on the other hand, is discretionary investment aimed at expanding capacity, unlocking new revenue streams, and increasing long-term cash flow.
The vast majority of Microsoft’s elevated capex today falls firmly into the growth capex category.
Microsoft is building out global data center capacity, AI infrastructure, and long-lived cloud assets to meet demand that already exists.
How do we know that demand exists?
Microsoft now has one of the strongest forward revenue backlogs in all of big tech.
Commercial remaining performance obligations (RPOs, which represent signed customer contracts that have not yet been recognized as revenue) have surged to $392B (+51% YoY), nearly doubling in just two years, with a weighted average duration of ~2 years.
That matters.
Unlike many long-dated or optional software backlogs, Microsoft’s RPOs represent near-term, highly visible consumption.
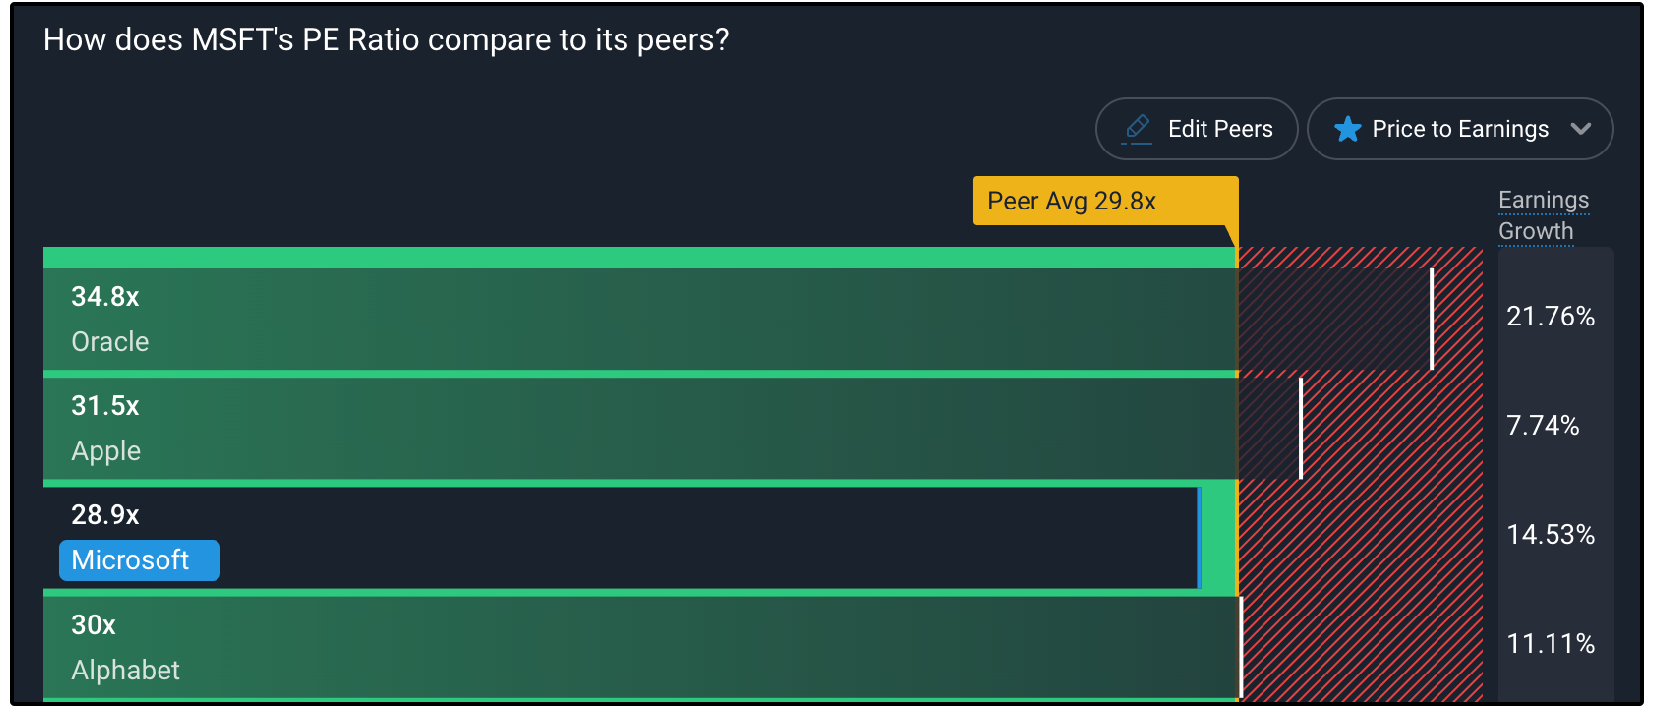
If we look at Microsoft’s valuation relative to peers, they are trading at a lower multiple, while also growing earnings at a faster rate.
Now, let’s review the full list for January: