
🏆 List of Undervalued Dividend Stocks (May '26)
These Stocks are Undervalued! 🔥

At the beginning of each month, I send out a spreadsheet that lists out the dividend stocks that I believe to be undervalued.
This is the end result of 100’s of hours of research every month.
It’s time to dive in.
1. 🌲 Alpine Income Property Trust (PINE)
The REIT market as a whole has struggled under the high interest rate environment over the last couple of years-
But that has led to some REITs becoming quite interesting opportunities.
I believe PINE is one of those REITs, but also a REIT that often gets overlooked because of its size.
It’s a $300M-ish market cap Florida-based net lease REIT, but the underlying story right now is potentially one of the most compelling in the small-cap REIT space.
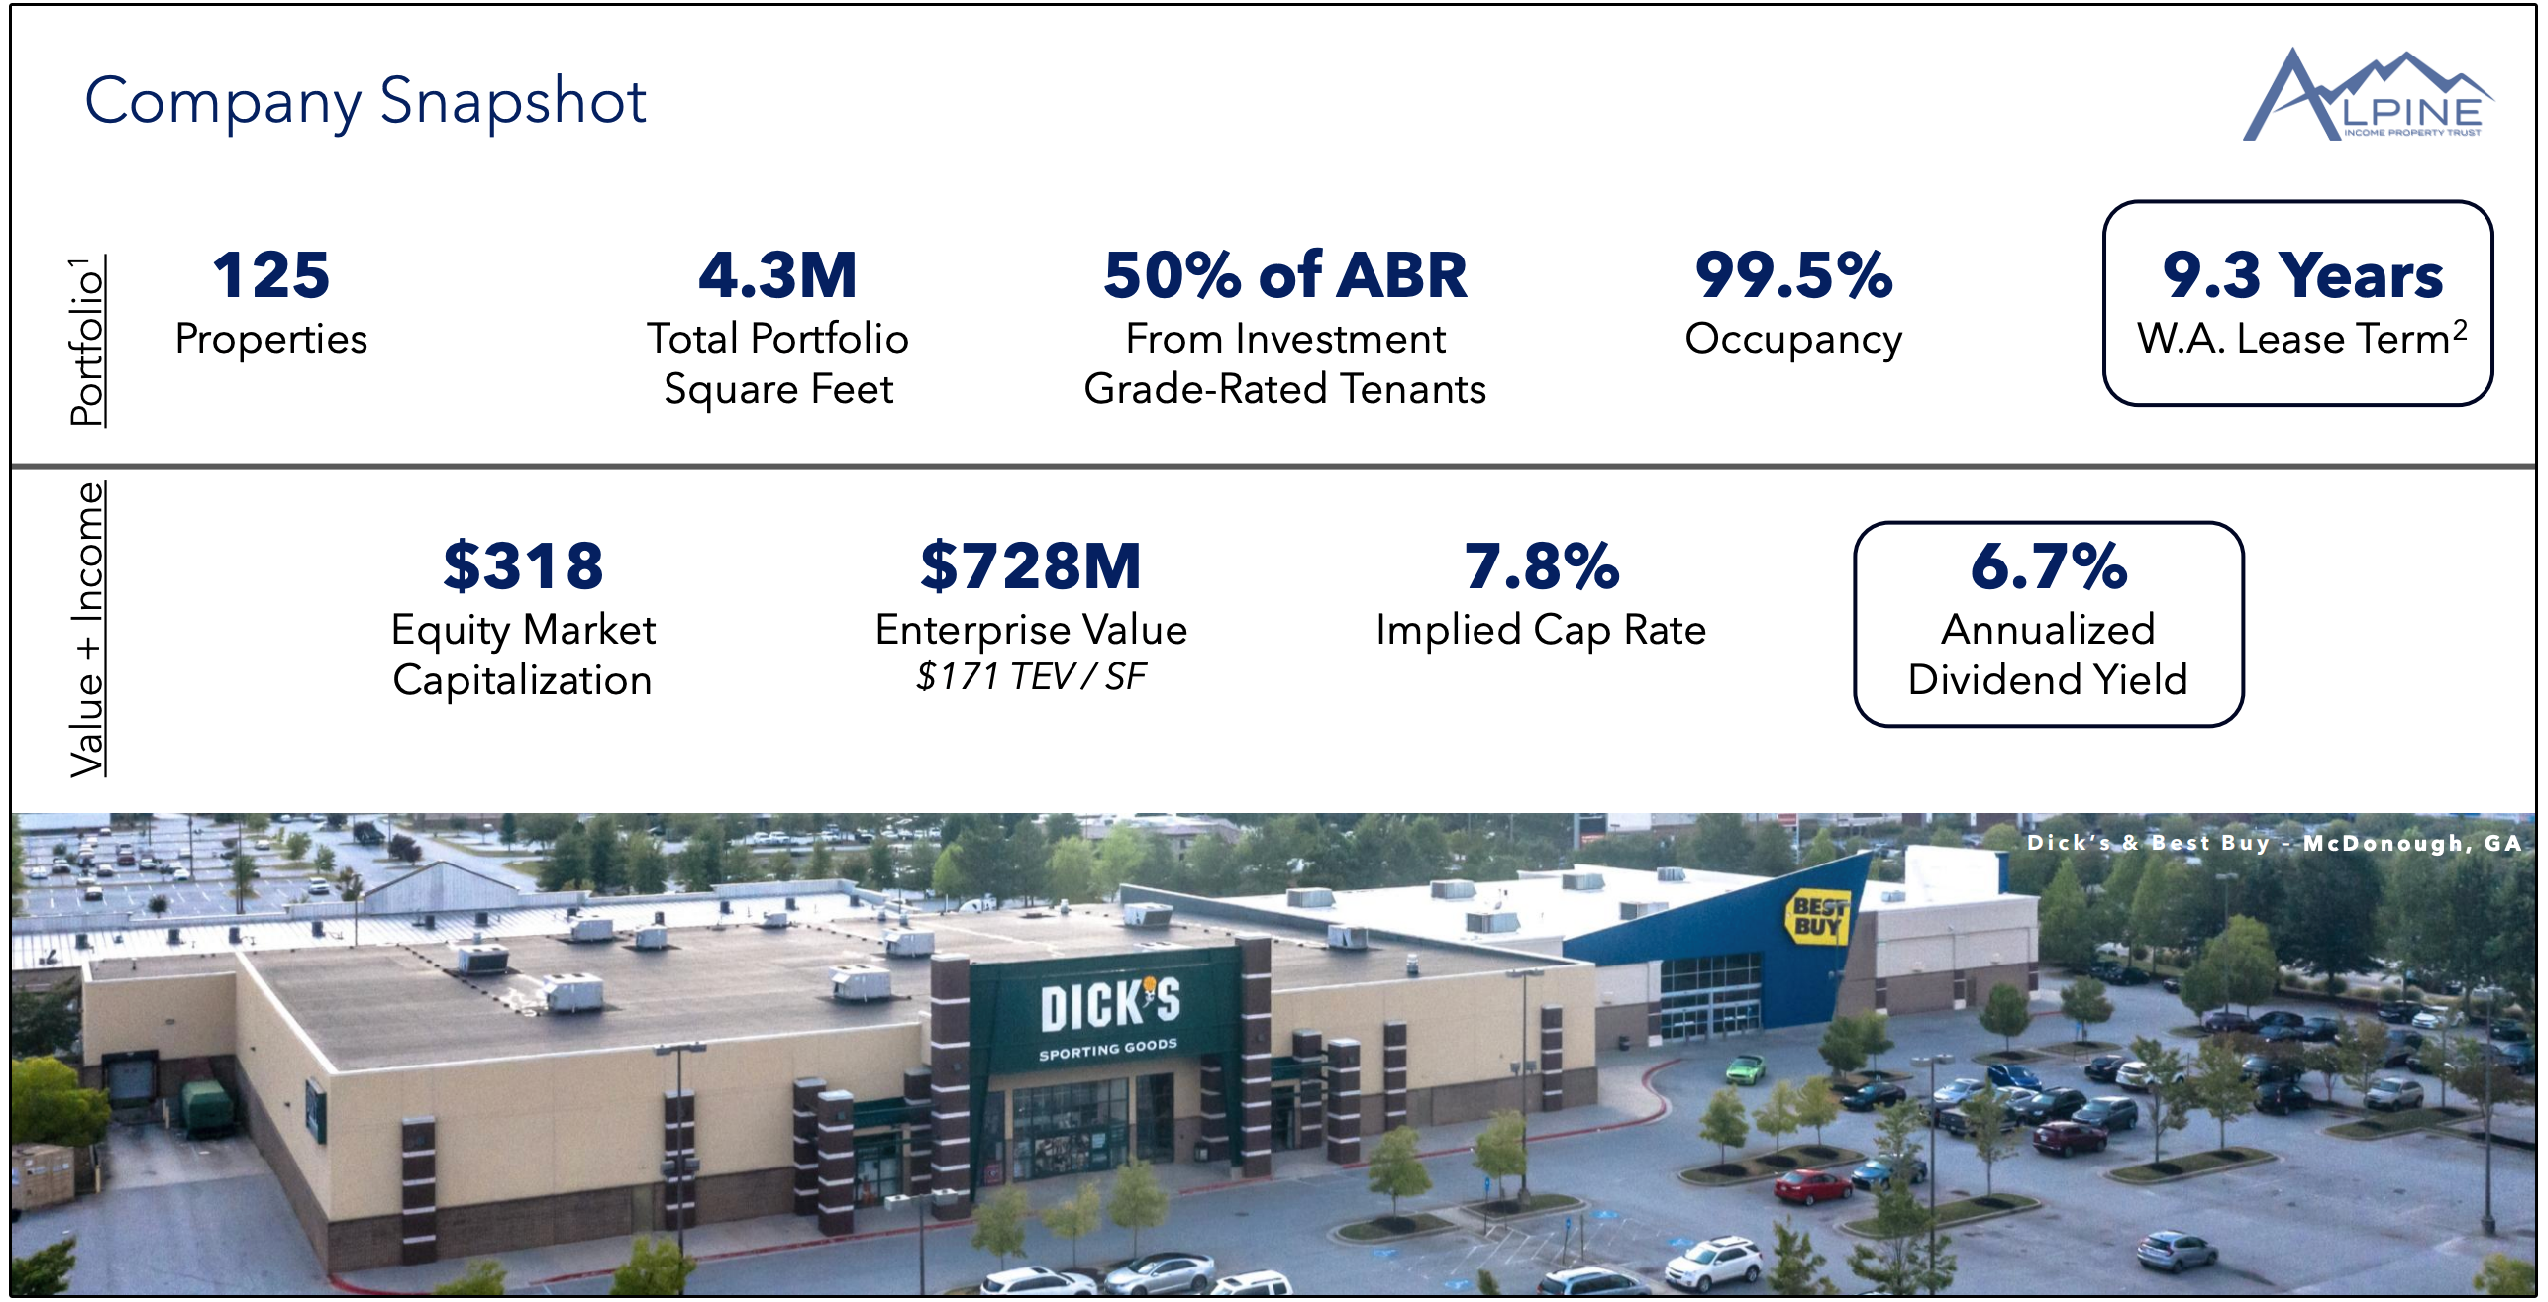
The REIT owns 125 properties and currently maintains a high 99.5% occupancy rate.
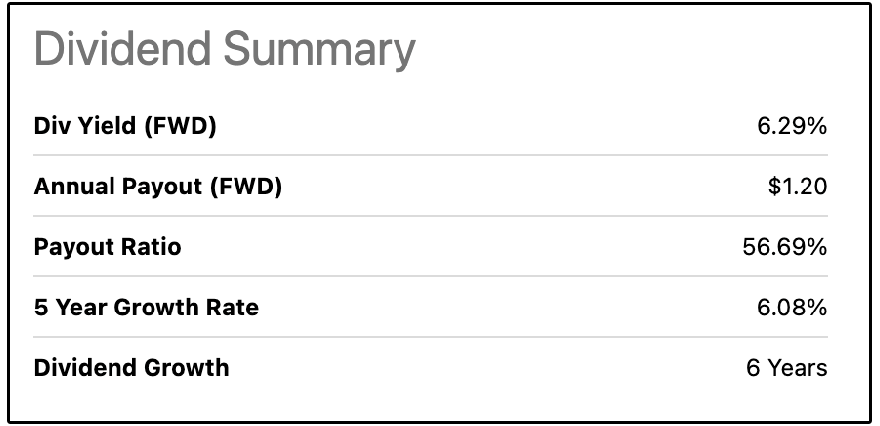
And of course, like many REITs, they offer a quite attractive starting dividend yield at 6.29%, along with a history of growing the dividend at a healthy rate (especially for a REIT).
And on top of the yield being quite attractive, especially when compared to the dividend growth rate-
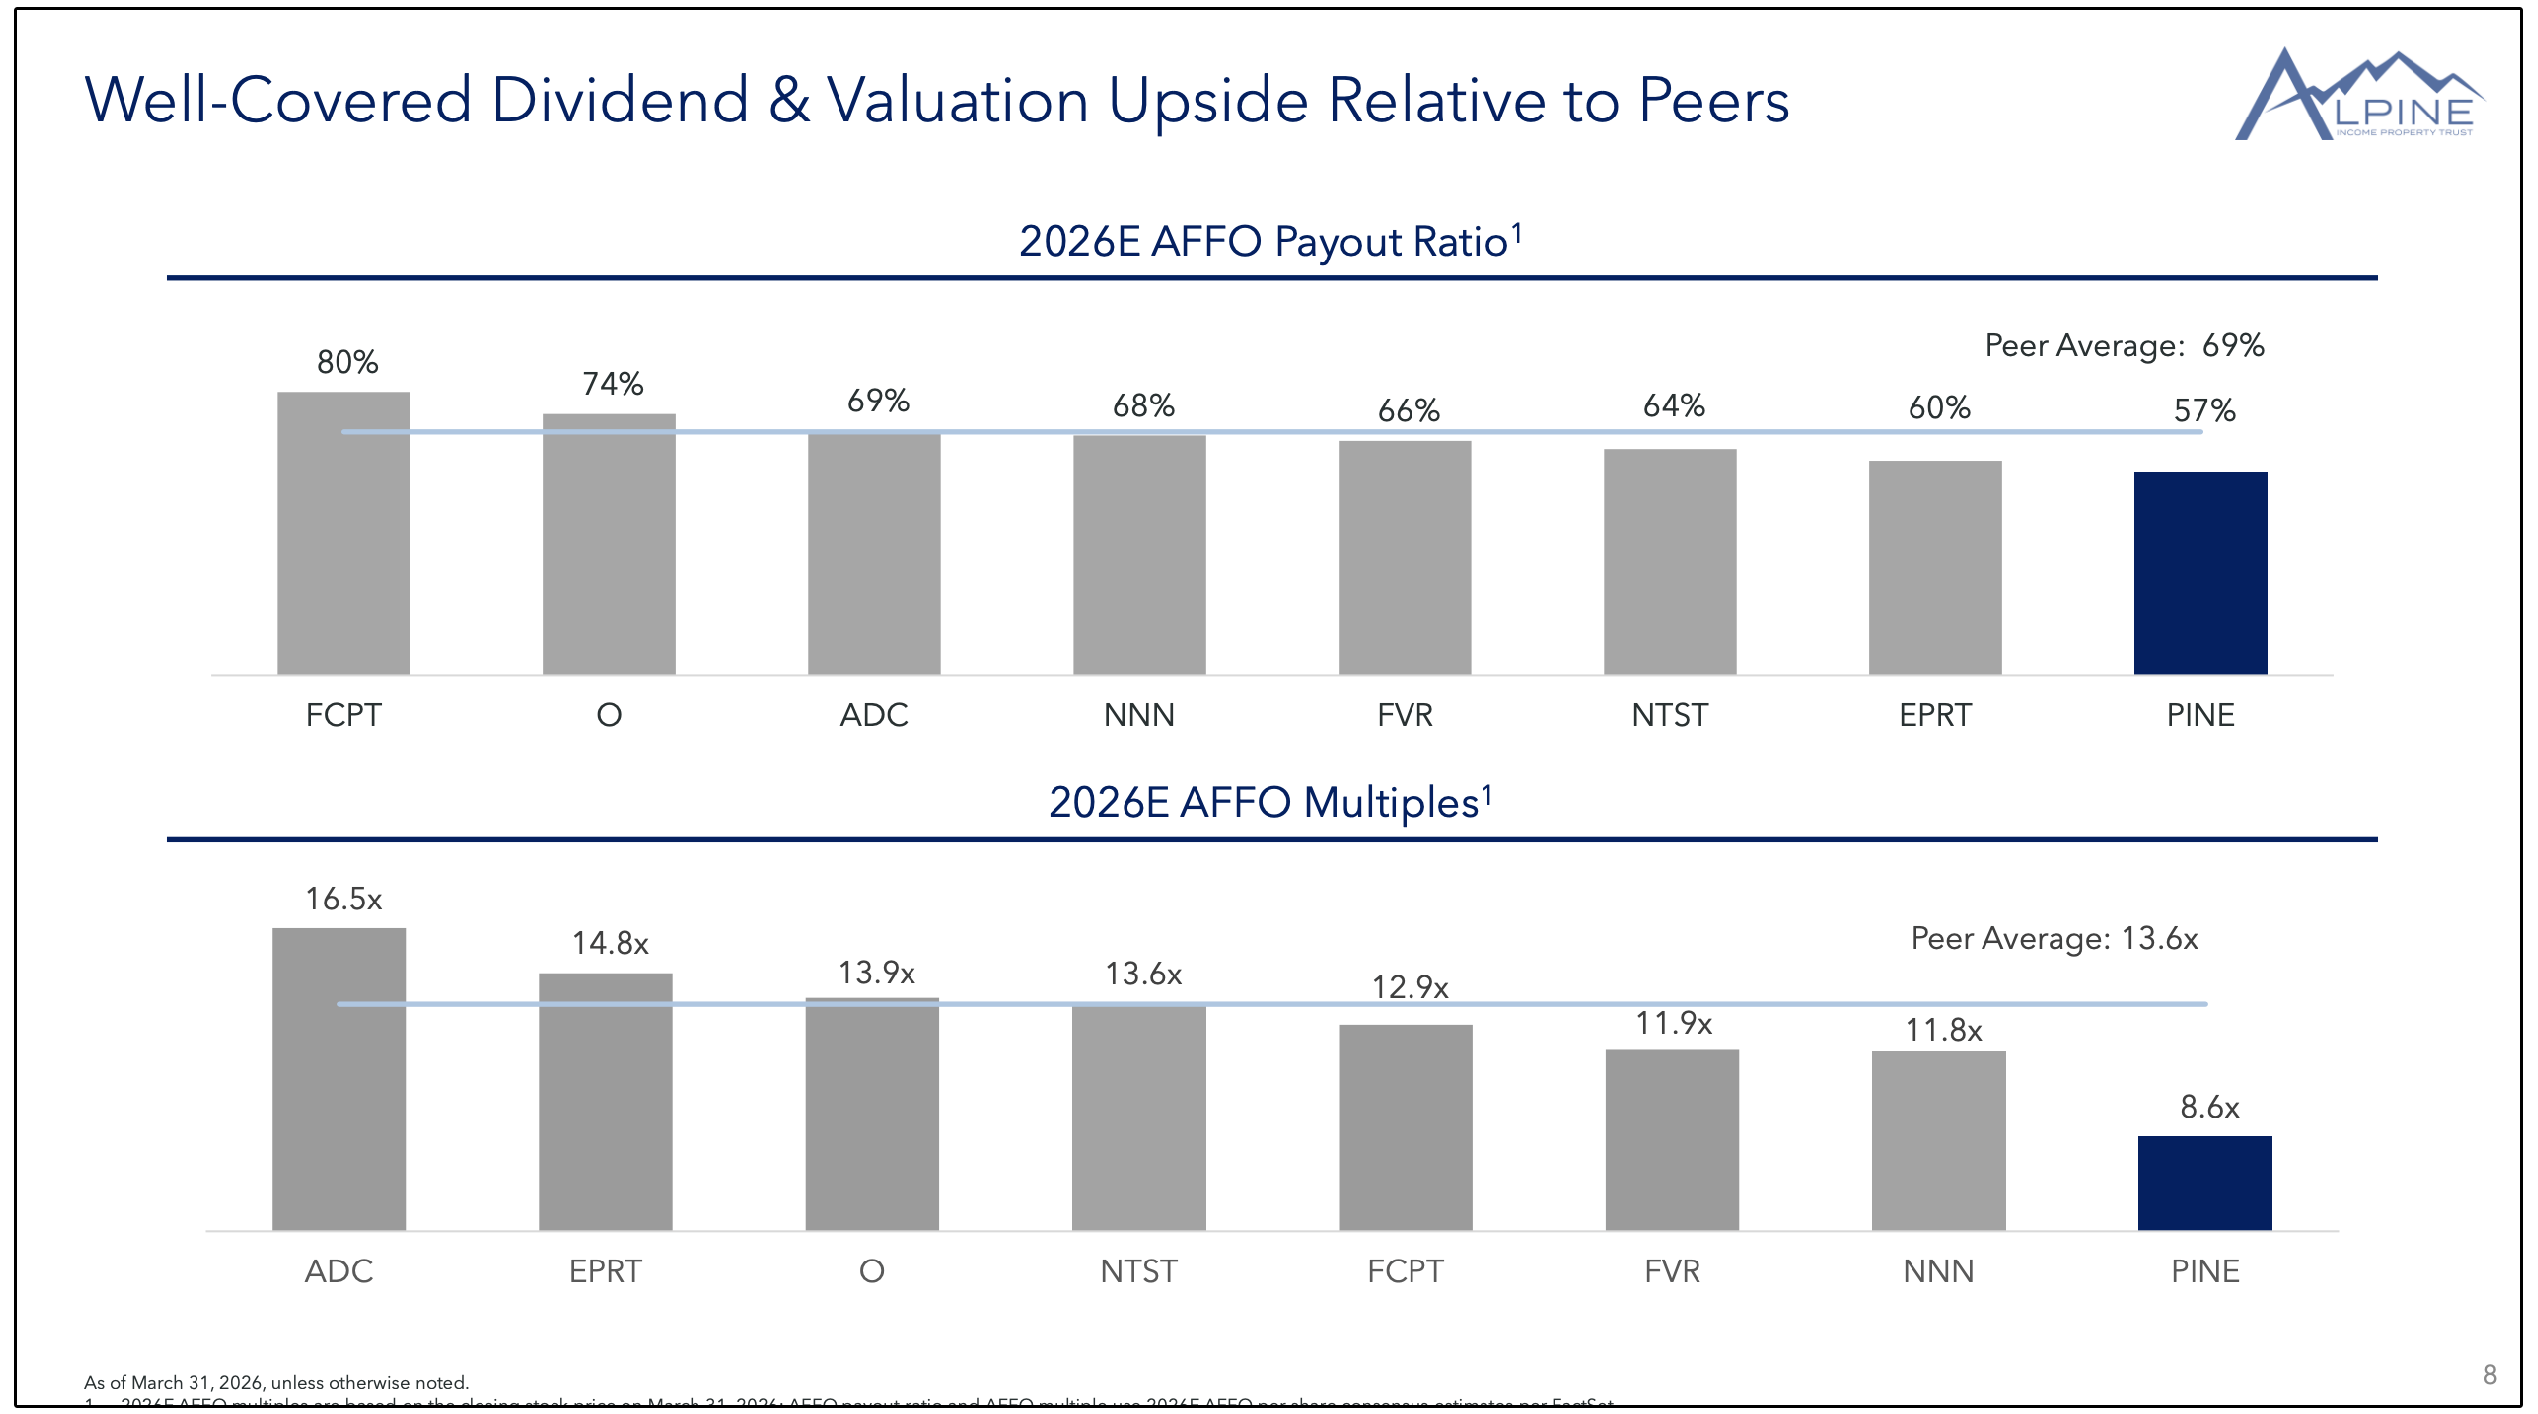
Their estimated AFFO payout ratio is just 57%!
That is the safest dividend coverage in 2026 out of all of their peers by a wide margin.
So while the dividend metrics look quite interesting, the growth trajectory has been ramping up as well.
A few weeks ago, Raymond James upgraded the stock on the back of accelerating growth, and their recent Q1 2026 earnings report confirmed exactly what they were seeing.
PINE reported Q1 2026 AFFO of $0.53 per diluted share (up roughly 20% year-over-year), beating both FFO and revenue expectations.
Alongside the print, management raised full-year guidance on the two metrics that matter most:
AFFO per share to $2.11–$2.15, implying 12.7% growth at the midpoint
2026 investment volume from $70–$100M to $170–$200M, effectively doubling the planned deployment for the year
That last raise tells you how management feels about the deal pipeline.
Q1 transactions came in at a 14.1% blended initial yield, including a downtown Aspen retail property with a 50-year lease and 1.25% annual escalators, plus a $32M Georgia retail development loan at a 13% rate.
Their portfolio sits at 99.5% occupancy across 125 properties in 31 states, with a 9.3-year weighted average lease term, and 50% of annualized base rent comes from investment-grade rated tenants-
Which is one of the highest concentrations in the net lease space.
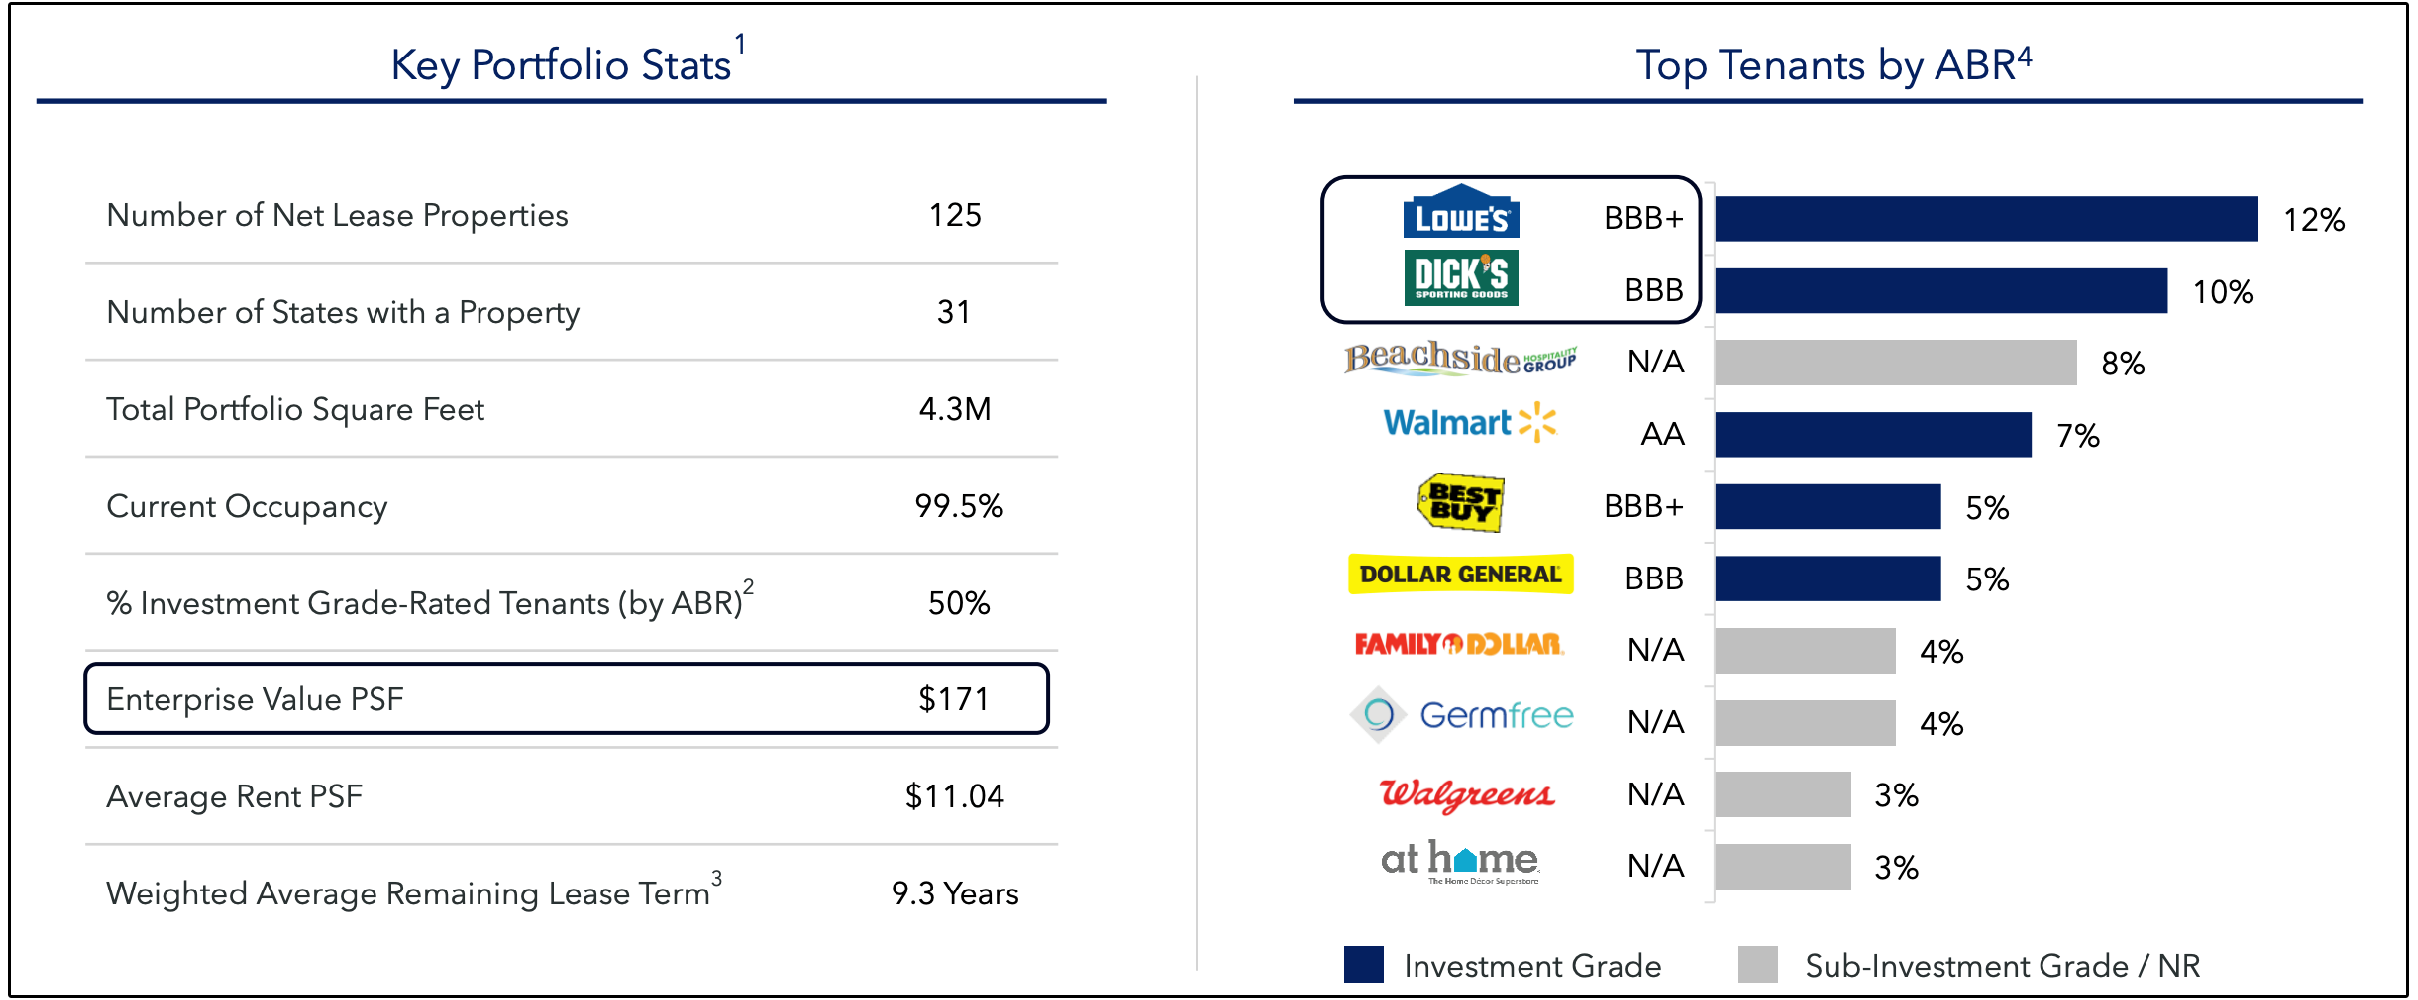
Top tenants include big names like:
Lowe’s (BBB+)
Dick’s Sporting Goods (BBB)
Walmart (AA),
Best Buy (BBB+)
Dollar General (BBB)
The top 5 making up less than 50% of total ABR (annual base rent).
There’s also meaningful exposure to defensive grocery and pharmacy tenants like Walgreens, which I view as a quiet upside factor heading into a potentially weaker consumer environment.
For more conservative income investors, there’s also PINE.PR.A, the 8% Series A cumulative redeemable preferred issued in November 2025. It currently yields about 7.9% at a slight premium to the $25 liquidation preference, with a first call date in November 2030.
The fair pushback on PINE is leverage and the lending book.
Net debt to pro forma EBITDA is 6.6x, which we typically don’t want to see higher than 5.5x, and the commercial loan portfolio (~$217M vs $438M of real estate) blurs the line toward an mREIT-style risk profile.
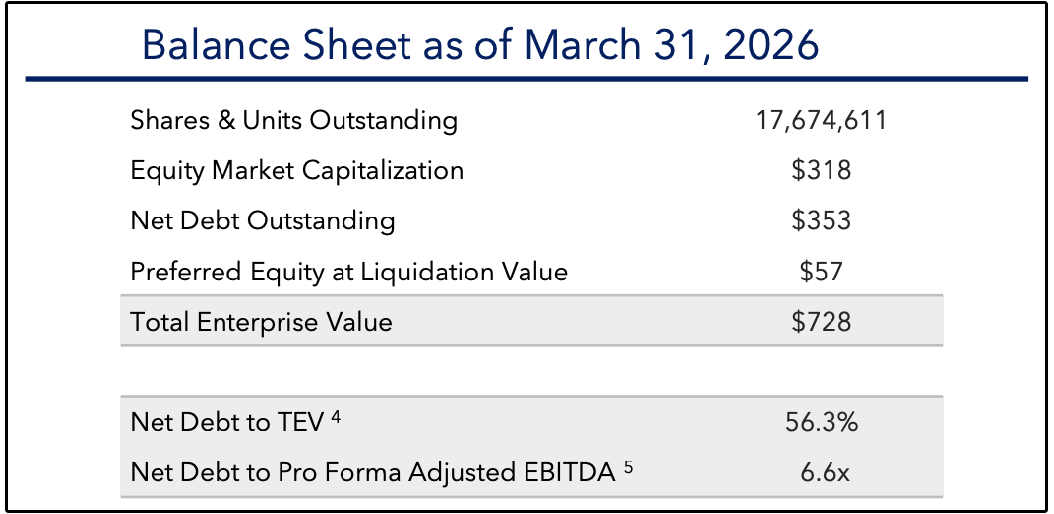
This essentially means roughly a third of PINE's invested capital sits in commercial loans rather than owned property.
Those loans yield 13–15%, including paid-in-kind (PIK) interest, which means a portion of the income is non-cash and only realized if the borrower performs through maturity.
That's a fundamentally different risk profile than a traditional net lease REIT.
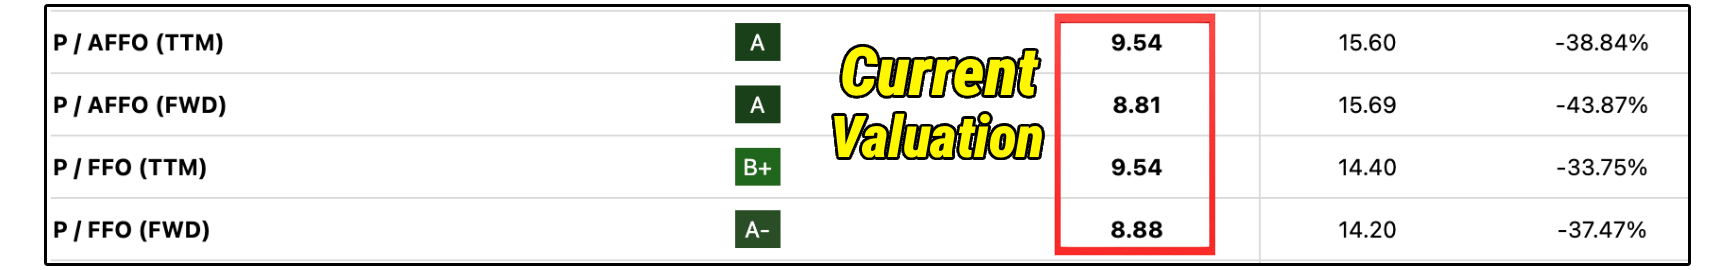
PINE’s share price is only up 3.2% in the last 5 years, yet based on estimated AFFO per share for 2026, they’ve grown AFFO per share 35% since 2021.
So naturally from a valuation perspective, PINE is trading significantly below their historical valuation multiples.
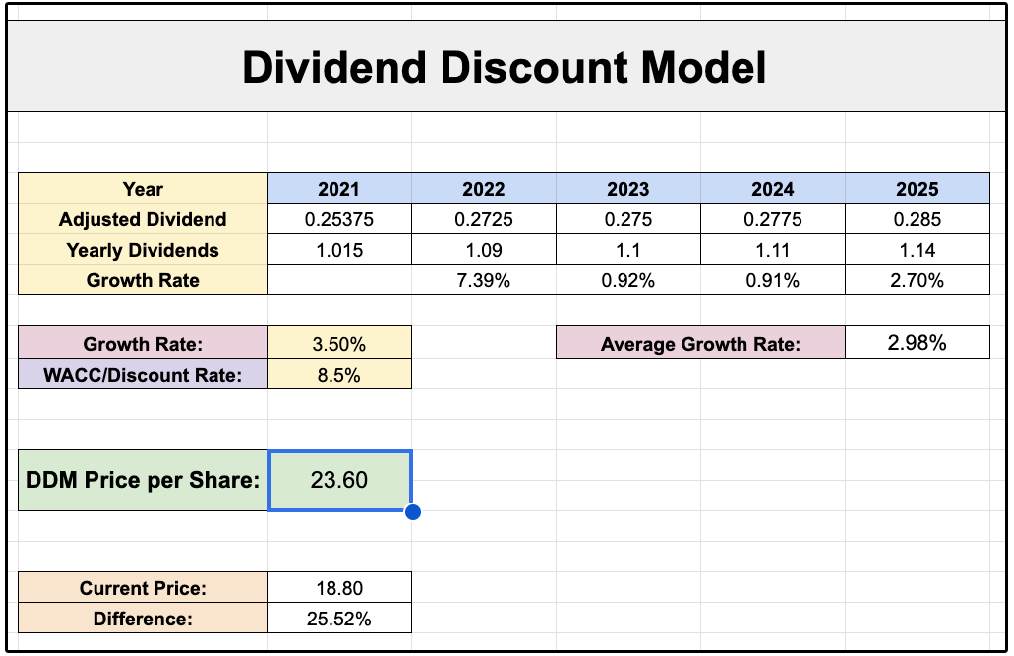
Even from a dividend discount model, if they grow the dividend just 3.5%, that would imply over 25% upside!
Keep in mind, they are projected to grow AFFO per share at 6.2% over the next 4 years, combined with the fact that the AFFO payout ratio is currently 57%-
Dividend growth at 3.5% should be quite sustainable.
Overall, despite some added risk from leverage and its lending exposure, PINE’s combination of strong dividend coverage, accelerating AFFO growth, and discounted valuation makes it one of the more compelling small-cap REIT opportunities in today’s market.
2. 📱 Meta Platforms (META)
After releasing earnings this past week, Meta is now the cheapest of the MAG7 stocks.
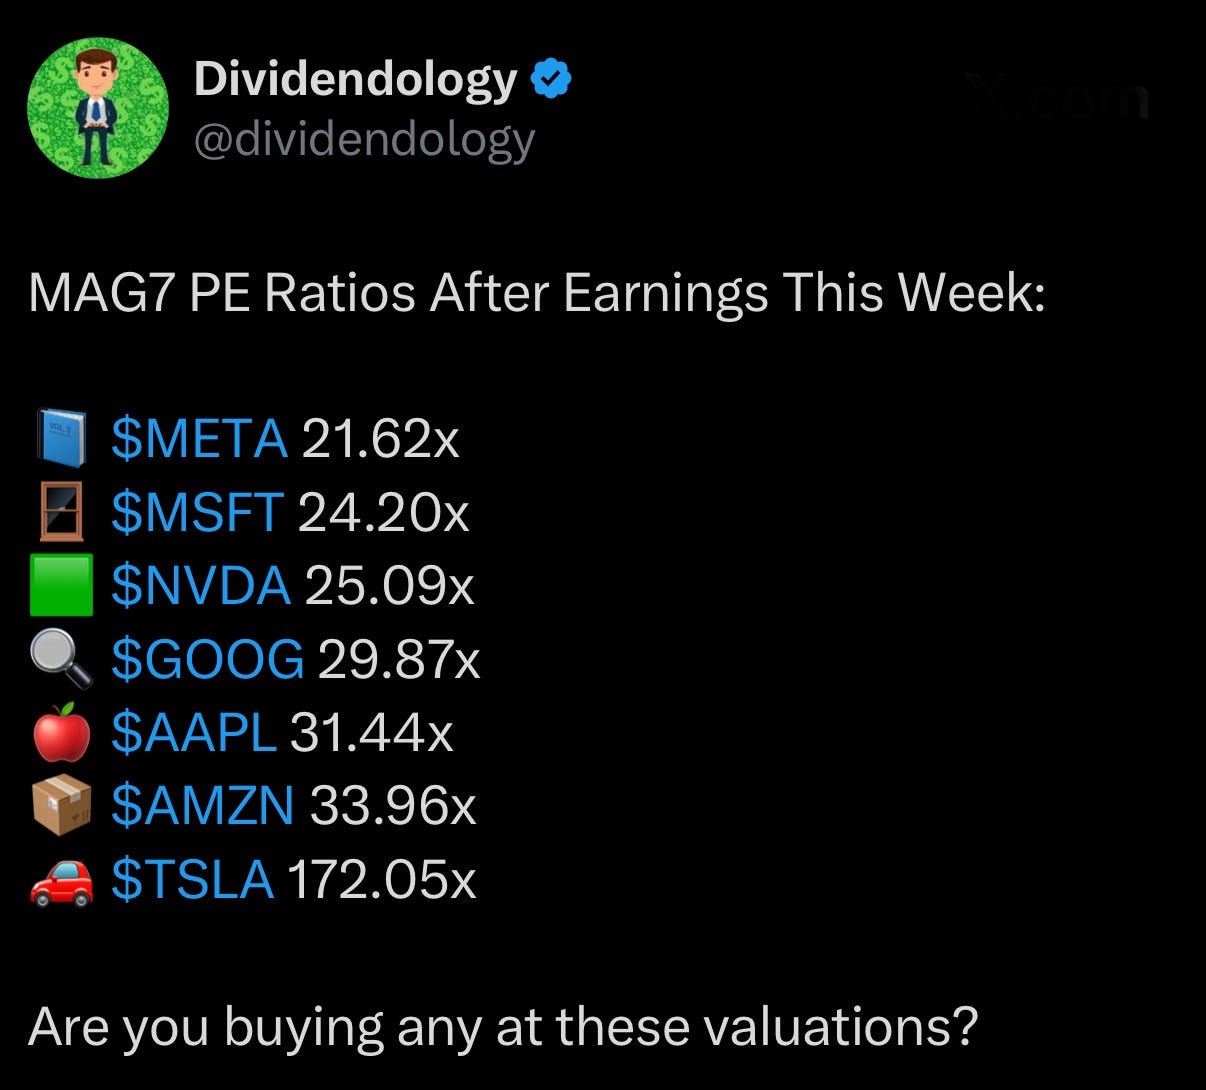
The stock sold off about 8% post-print (down close to 10% intraday at one point) and is now down roughly 6.5% year-to-date, putting it on the lower end of its 52-week range.
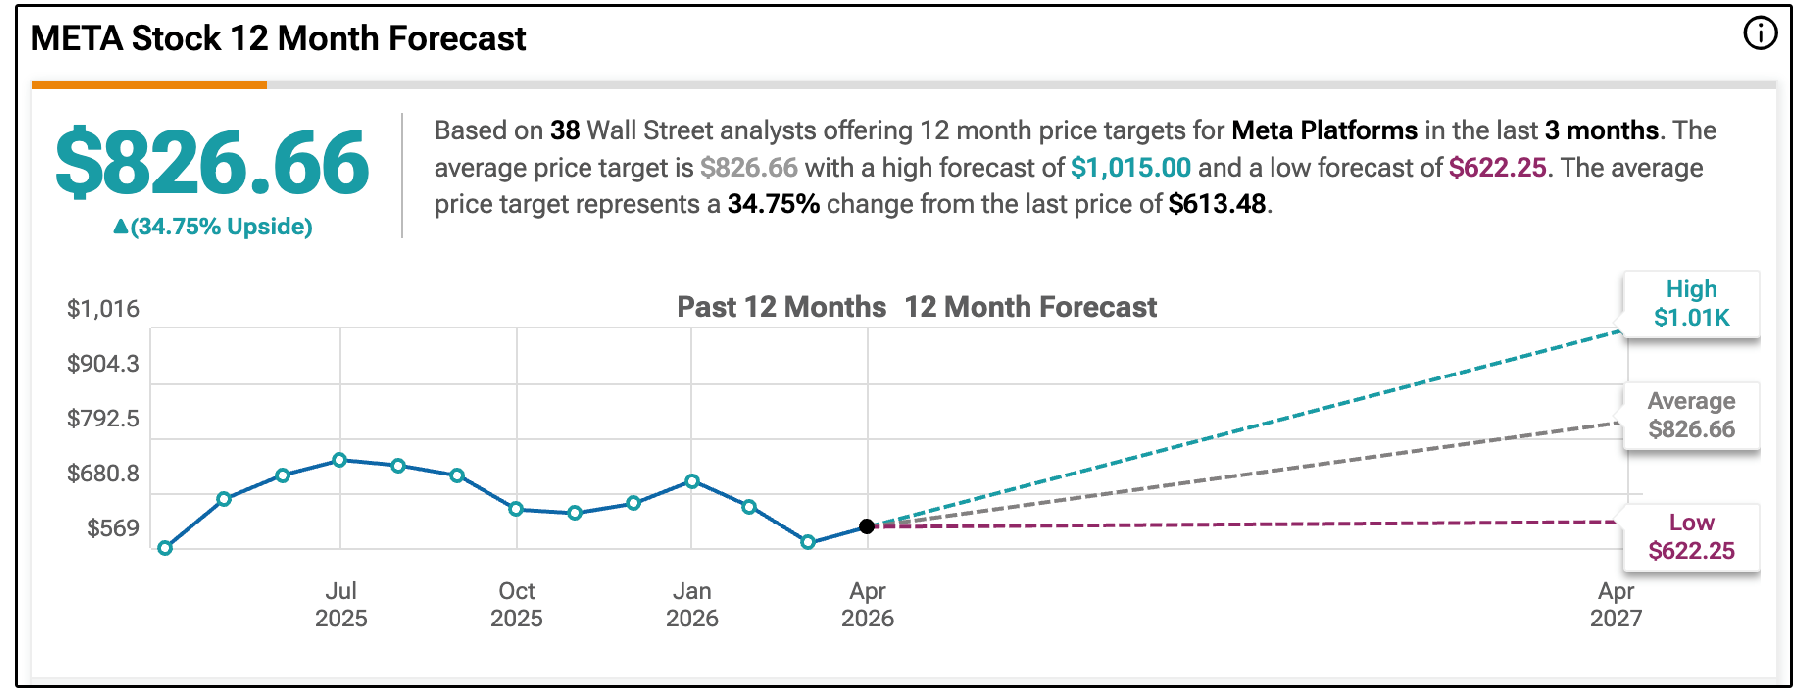
Meanwhile, the average analyst price target sits at $826.66, implying around 35% upside
Let’s start with what was actually inside their earnings report:
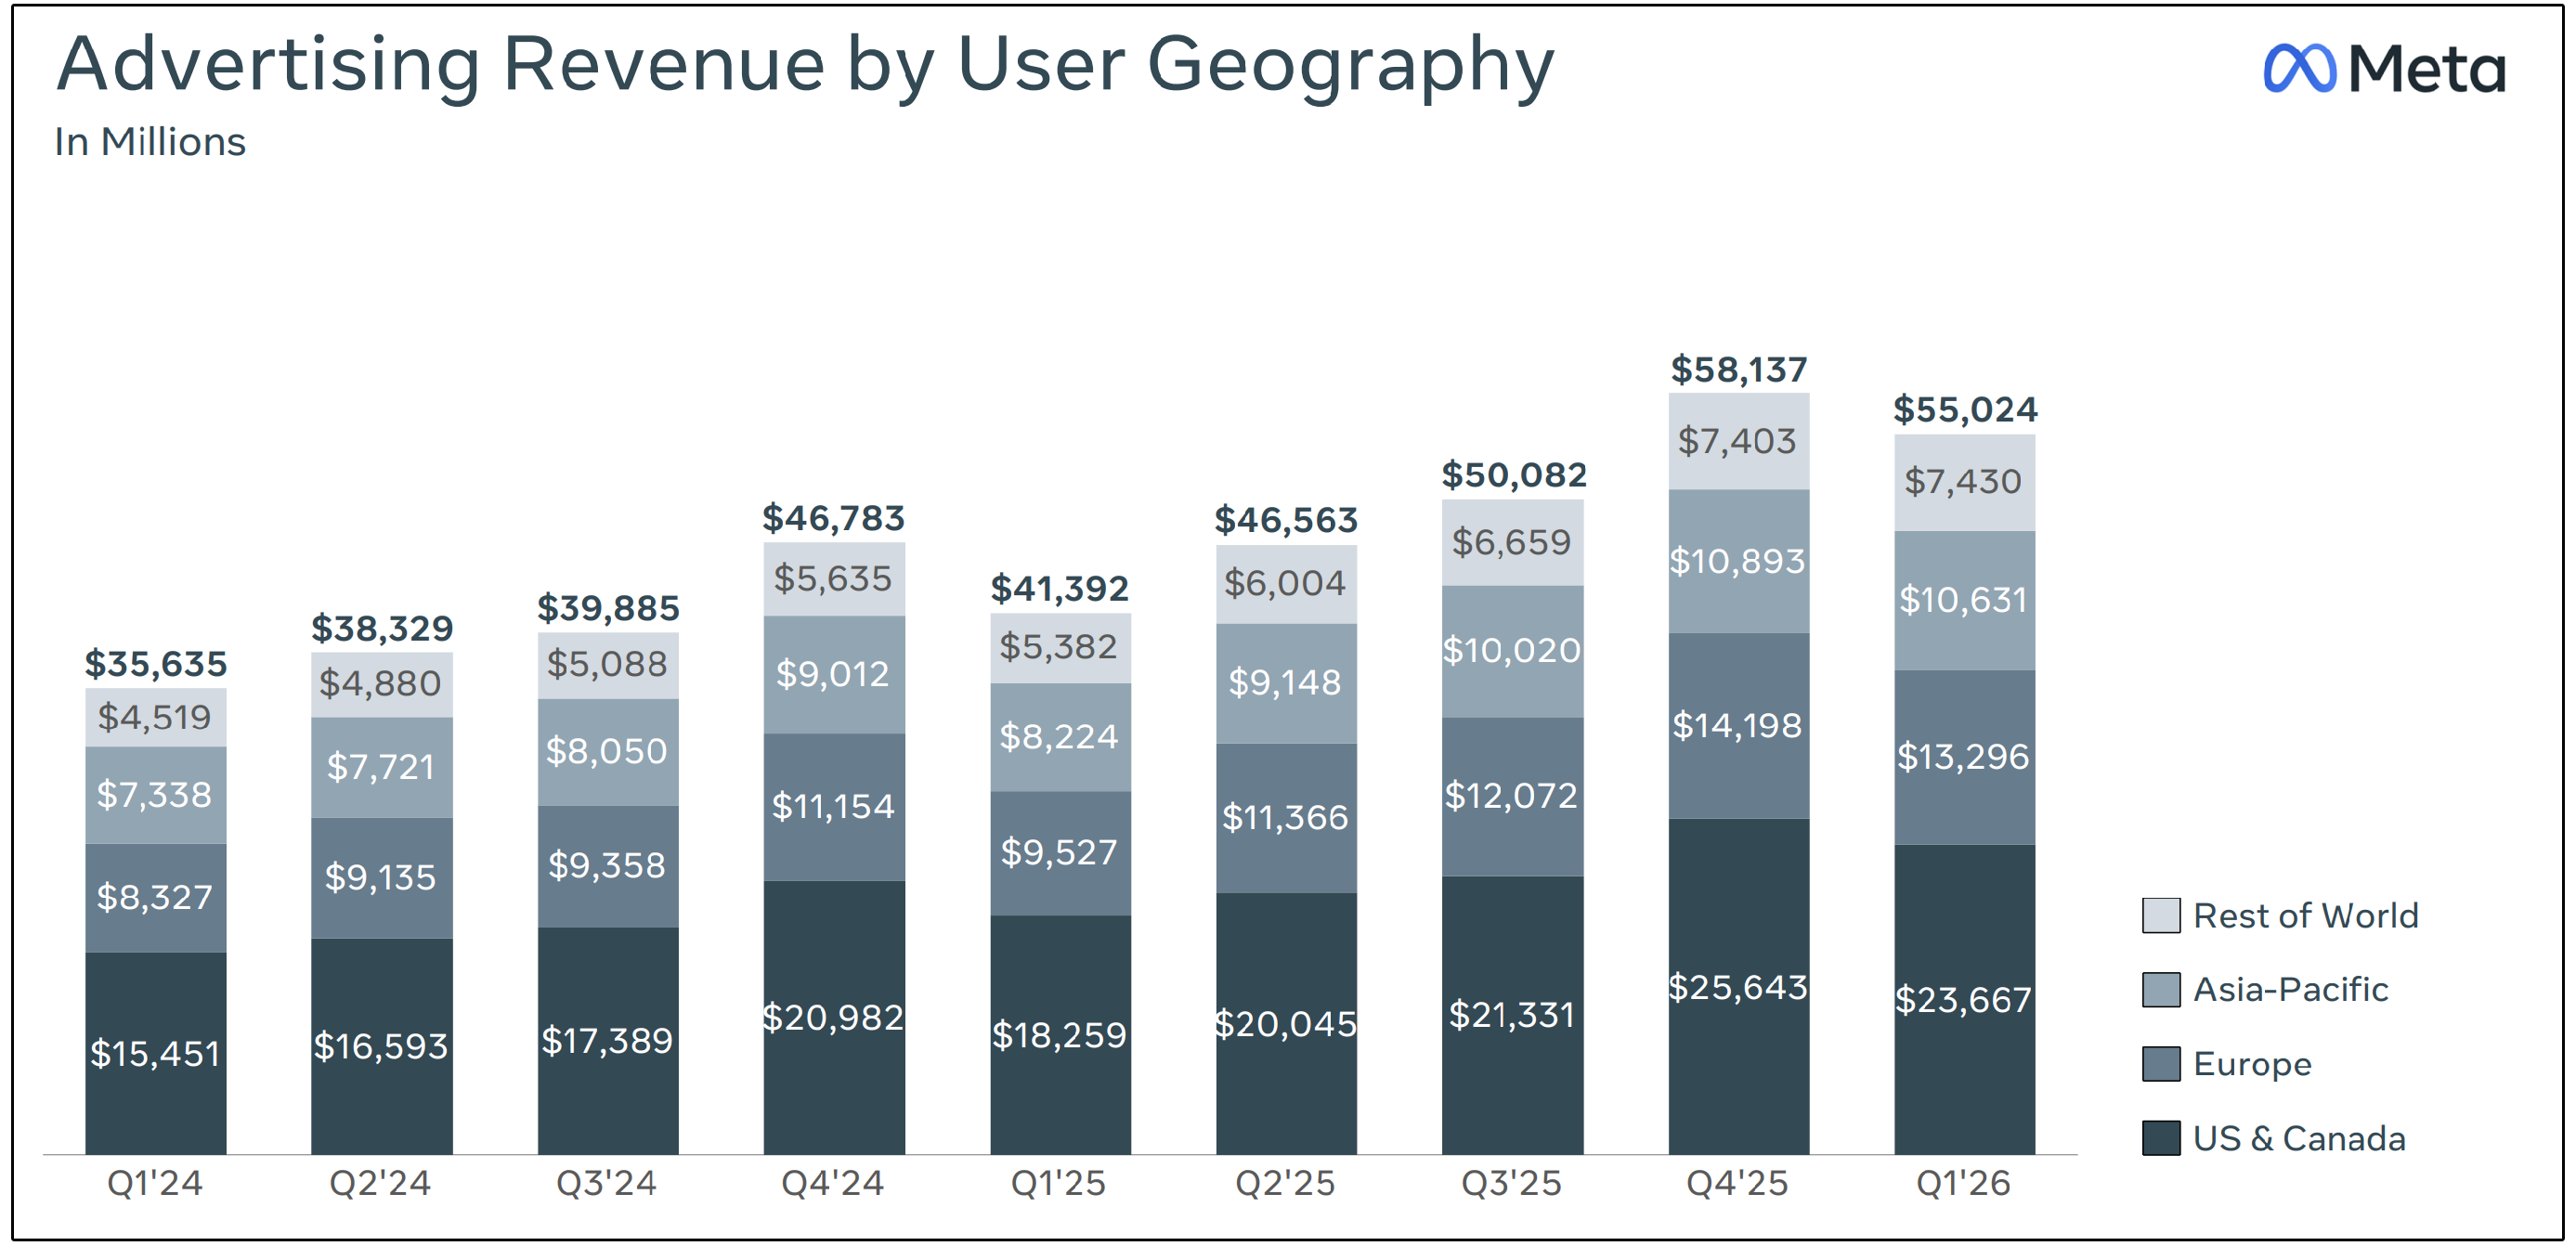
Revenue beat by ~$760M, up 33% year-over-year (the fastest growth since 2021)
GAAP EPS of $10.44, a beat of $3.78
Operating margin 41%, free cash flow $12.4B for the quarter
This isn’t a one-off.
Meta’s 5-year revenue CAGR is 18.5% and its 10-year revenue CAGR is 27.3%, with last year’s gross margin coming in at 82%.
Surging revenue growth, surging earnings growth, exceptional margins, and the stock sold off.
So what’s the issue?
Management raised 2026 capex guidance from $115–$135B to $125–$145B, citing higher component pricing and additional data center capacity.
On an absolute basis, that’s actually still lower than the rest of the MAG7.
Microsoft is around $190B, Google $180–$190B, and Amazon over $200B.
But absolute numbers don’t tell the story. You have to look at capex relative to revenue.
Before this raise, Meta was already projected to spend 49.8% of revenue on capex in 2026.
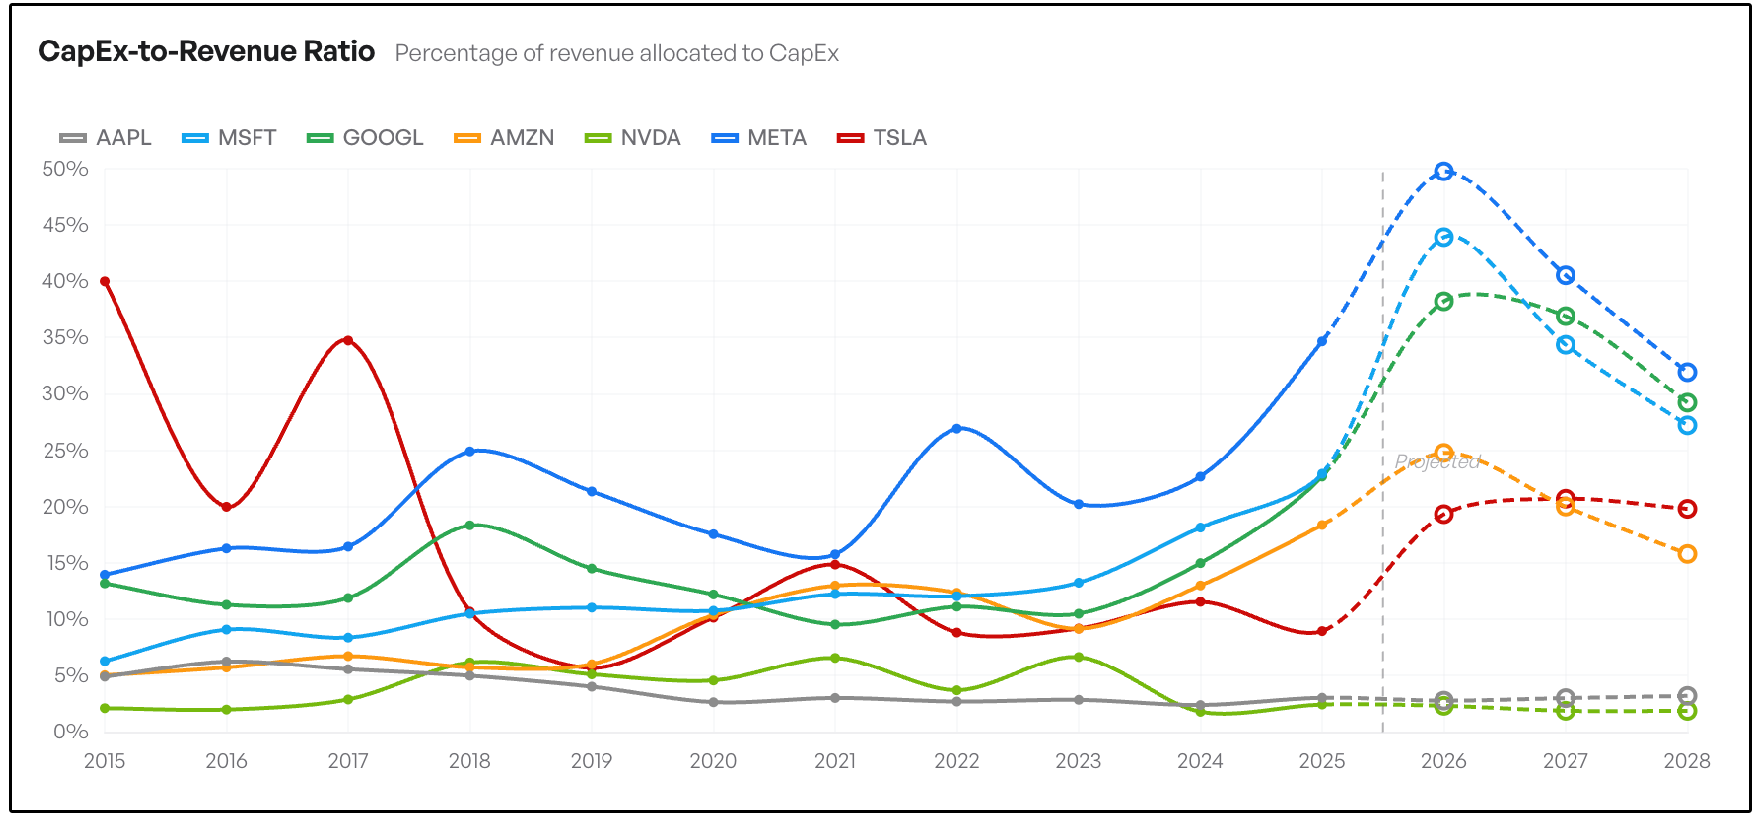
After the increase, that number is above 50%.
A historically capital-light advertising business with 82% gross margins is now spending more than half of every revenue dollar on capital expenditures.
That is capital-intensive-business math, and it’s the core of why the market is uncomfortable, especially when you consider Meta’s history with increasing capex spending.
Investors remember Reality Labs, the segment has bled capital essentially every quarter since inception, and the 2021–2022 capex binge took FCF/share from $13.90 down to $0.79 as ad budgets also pulled back during the recession.
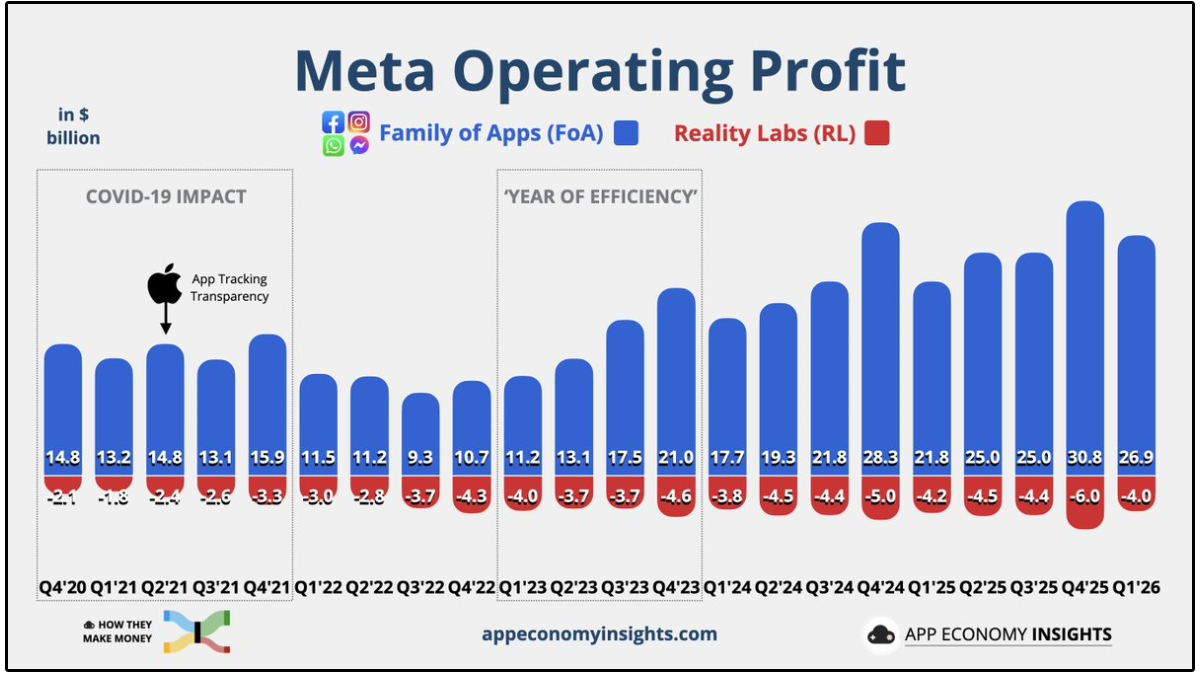
Free cash flow more than recovered, but it pulled back again in 2025 on rising capex.
The market is being asked to trust Meta’s ROI on a much bigger spend than last cycle, and that’s a fair thing to be skeptical about.
The counter is that this isn’t maintenance capex, it’s growth capex aimed at the AI race.
Whether it works is what the entire thesis hinges on.
Meta’s revenue is a function of three inputs:
Family daily active people
Ad impressions
Average price per ad
Here’s how each moved year-over-year in Q1 2026:

More people, seeing way more ads, at meaningfully higher prices.
The DAP slowdown is the only real soft spot, and the reasons given are credible and not structural or lasting.
It’s also worth noting that Q1 is always Meta’s lowest revenue quarter, Q4 is the seasonal high (due to advertising budgets being heavier on the backend of the year).
Q1 2026 revenue was still higher than Q4 2024, so the underlying trajectory is healthy.
From a valuation perspective, forward looking returns are becoming quite attractive at current prices.
Even assuming a PE multiple that is below its historical average, with earnings growth that is below the average analyst estimate-
You’re still looking at 15%+ compounded returns through 2030.
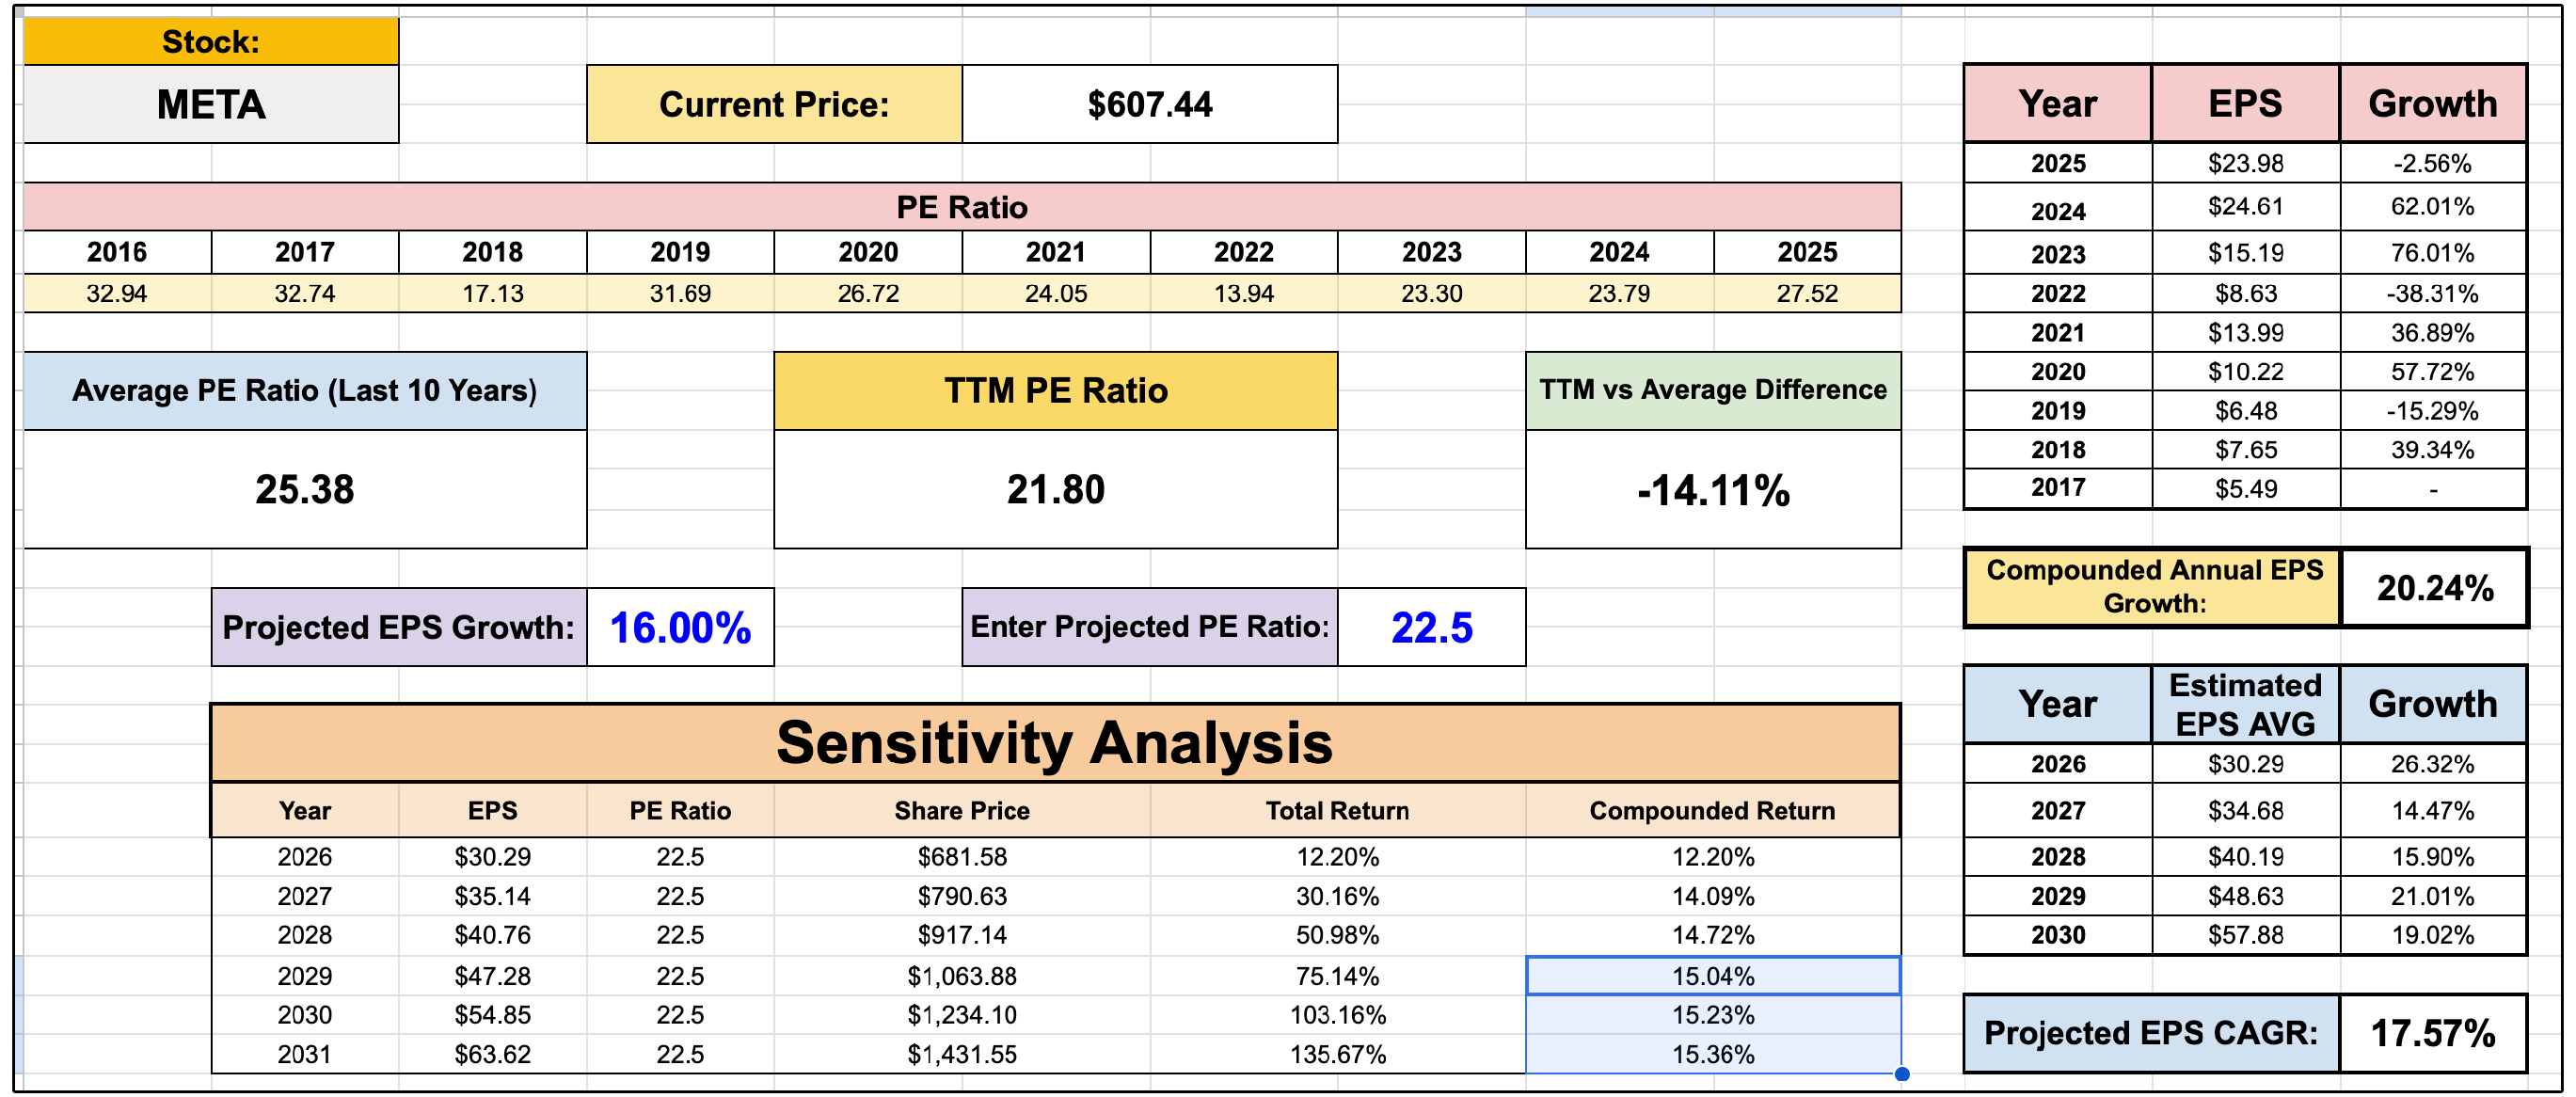
The dividend is small now, but will have the ability to grow substantially after the period of elevated capex spending.
I will say, over 50% of revenue going to capex is not something you ignore and adds real risk to the stock-
But the underlying ad business is firing with 19% more ad impressions, 12% higher prices, 33% revenue growth, 41% operating margins, net cash on the balance sheet, and the multiple just compressed to levels well below their historical average.
3. 🍕 Domino’s Pizza (DPZ)
After being one of the top performing stocks for over a decade, the past 5 years for DPZ has been brutal.
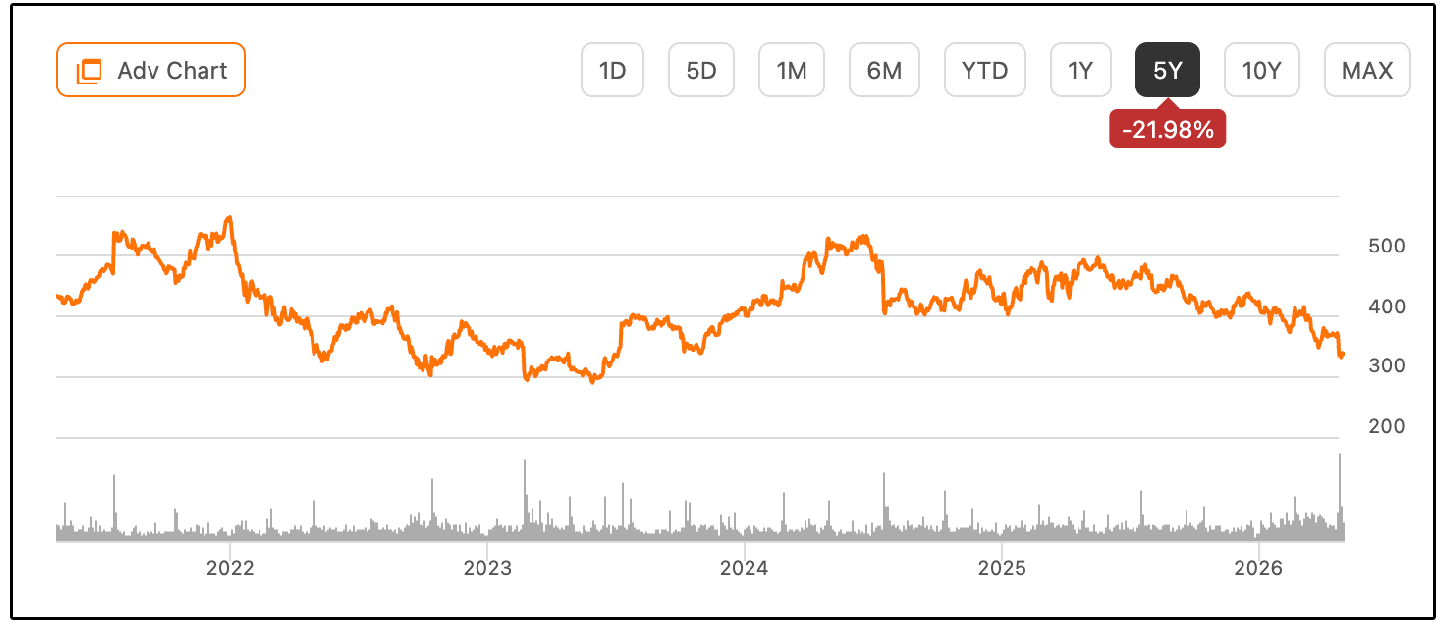
That’s a remarkable reversal for what was one of the best-performing stocks of the entire 2009–2021 run.
A $10,000 investment in DPZ in 2005 would have grown to roughly $876,000 by 2021, with not a single red year over that stretch.
So the question is whether the recent breakdown is the start of a permanent valuation re-rate, or the kind of dislocation that creates an opportunity.
The headline numbers from the recent earnings report were a clear miss:
GAAP EPS of $4.13 vs. ~$4.28 expected, a meaningful miss.
Revenue of $1.15B, up just 3.6% YoY, also a $10M miss
Management was honest about why. CEO commentary called out two issues:
Pressure intensified through the quarter, particularly in March, on growing consumer uncertainty.
Competition in the QSR pizza space ramped up, with national pizza players matching (or essentially copying) Domino’s value offers.
That second point is the one that should get attention.
Domino’s competitive edge has been built on being the most aggressively-priced national player.
The “pizza war” eroding that moat is potentially a structural concern, which is concerning.
Here’s where I push back on the bear case slightly.
Domino’s is one of the cleanest examples of a great business model in public markets:
Of ~7,200 US stores, only 262 are company-owned, about 98% are franchised
Franchisees pay royalties and fees, so DPZ doesn’t fund most new stores.
That’s why gross margins have actually expanded over the last decade and return on invested capital consistently runs above 50%, one of the highest figures you’ll find in the entire S&P 500.
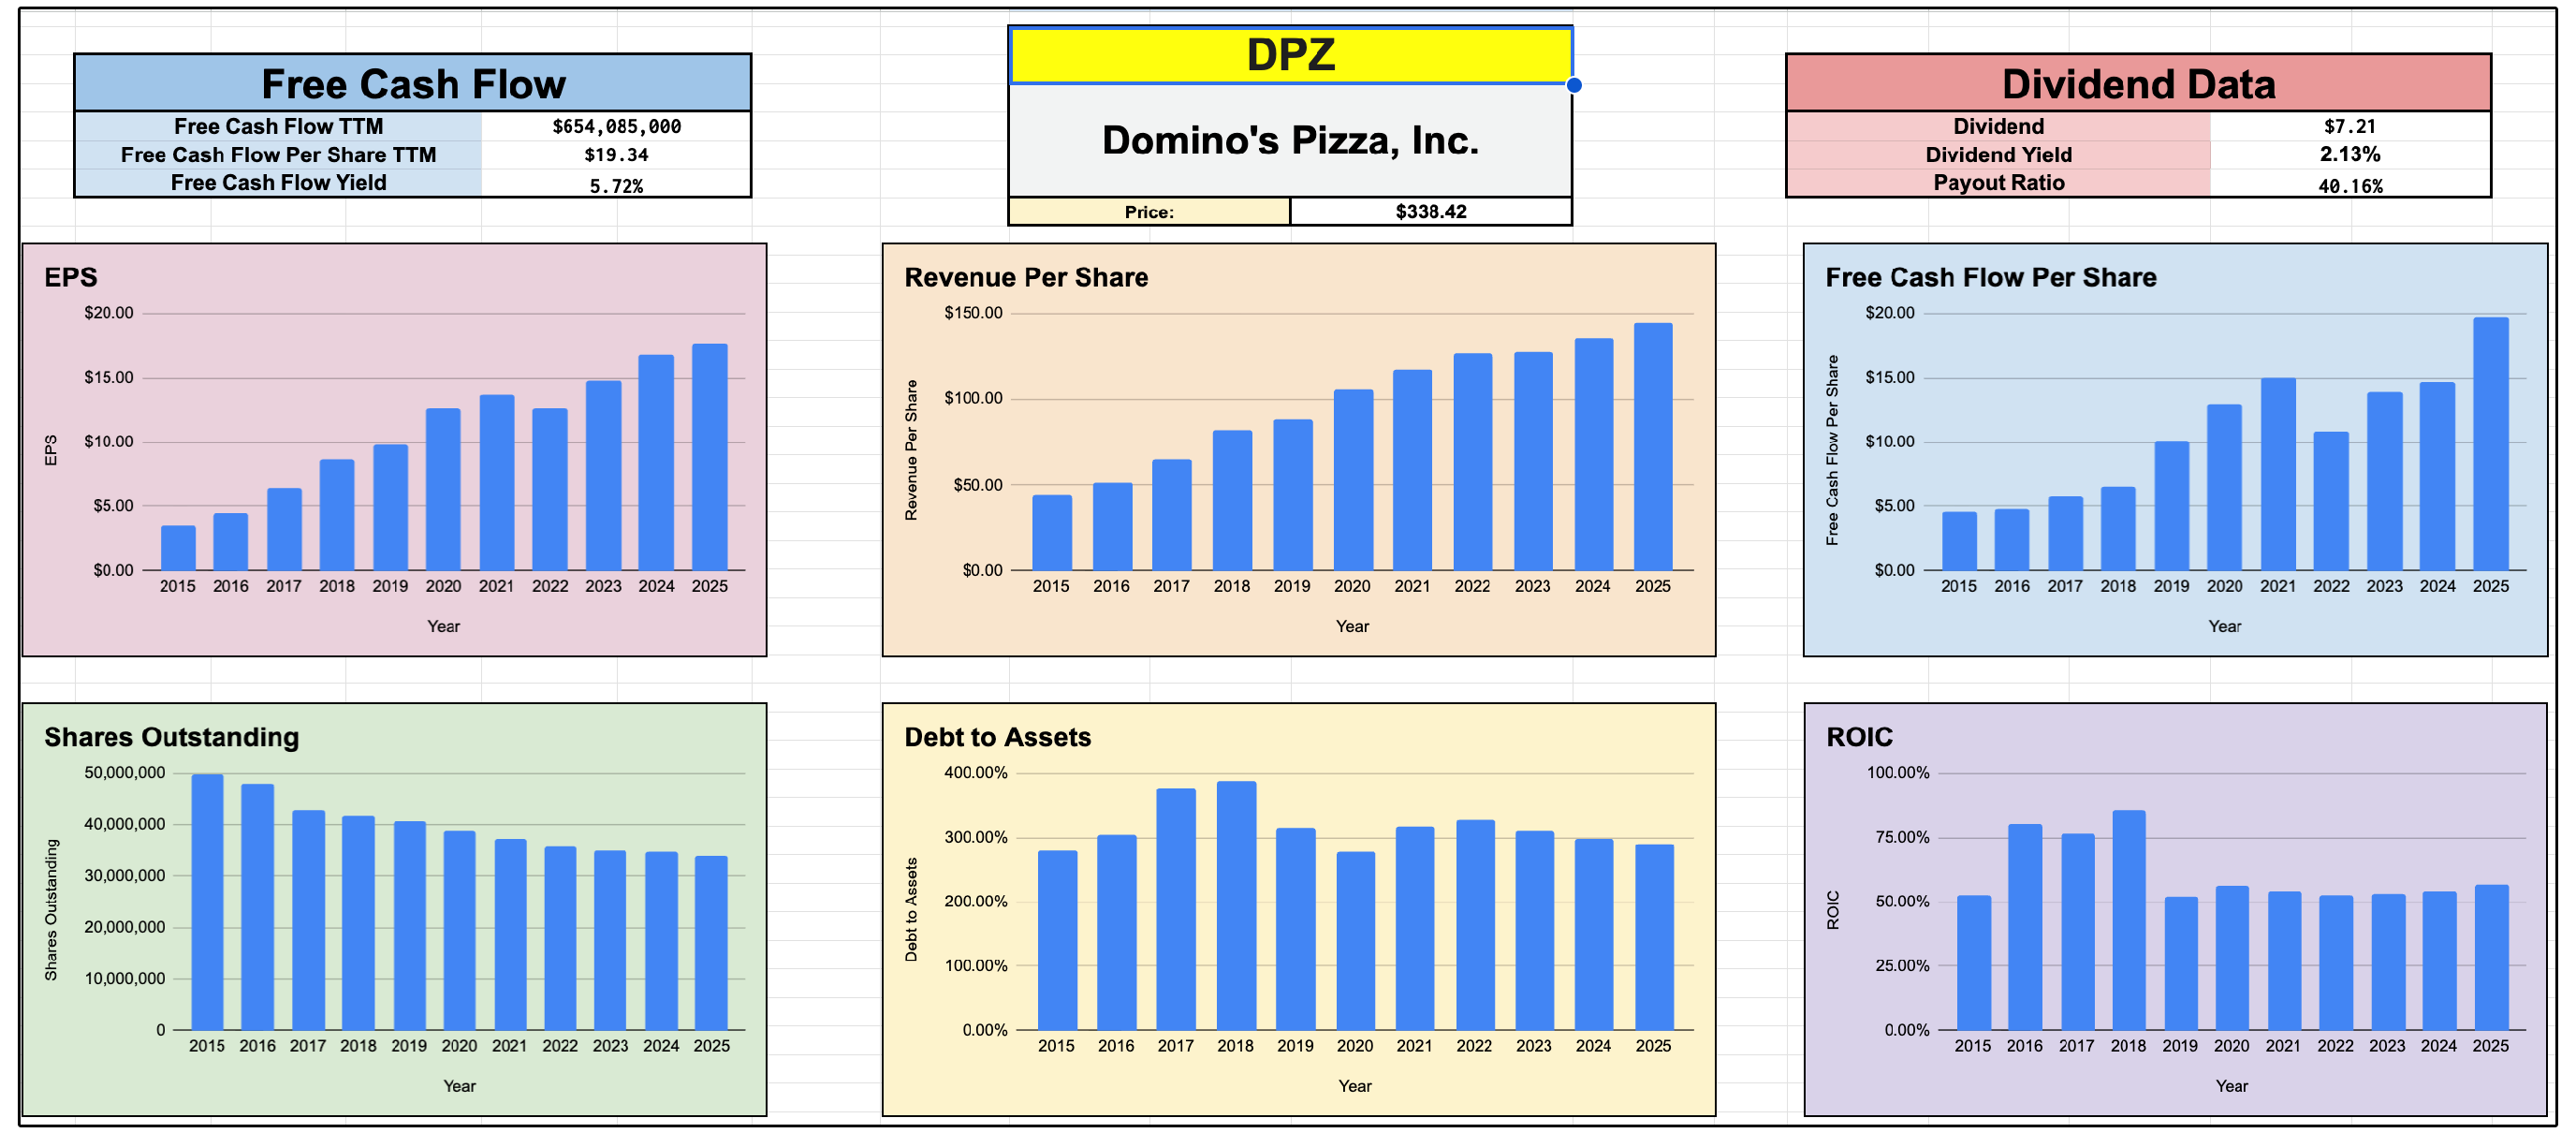
ROIC above 50% is the kind of number that, on its own, tells you this is a genuinely high-quality business.
But because the business is so capital-light, the things that move the needle are items like same-store sales growth and net new store openings (especially international).
Q1 was soft on both:
US same-store sales: +1.5% (company-owned), +0.8% (franchise).
US net new stores: ~19 (essentially all franchise).
International net new stores: 161, the real growth engine right now.
With that being said, the valuation makes DPZ interesting now.
Warren Buffett’s Berkshire Hathaway has now added shares of DPZ for six consecutive quarters.
This is what makes DPZ interesting.
Earnings have continued to grow even as the stock has fallen, so the P/E has compressed dramatically, now at its lowest level in well over a decade.
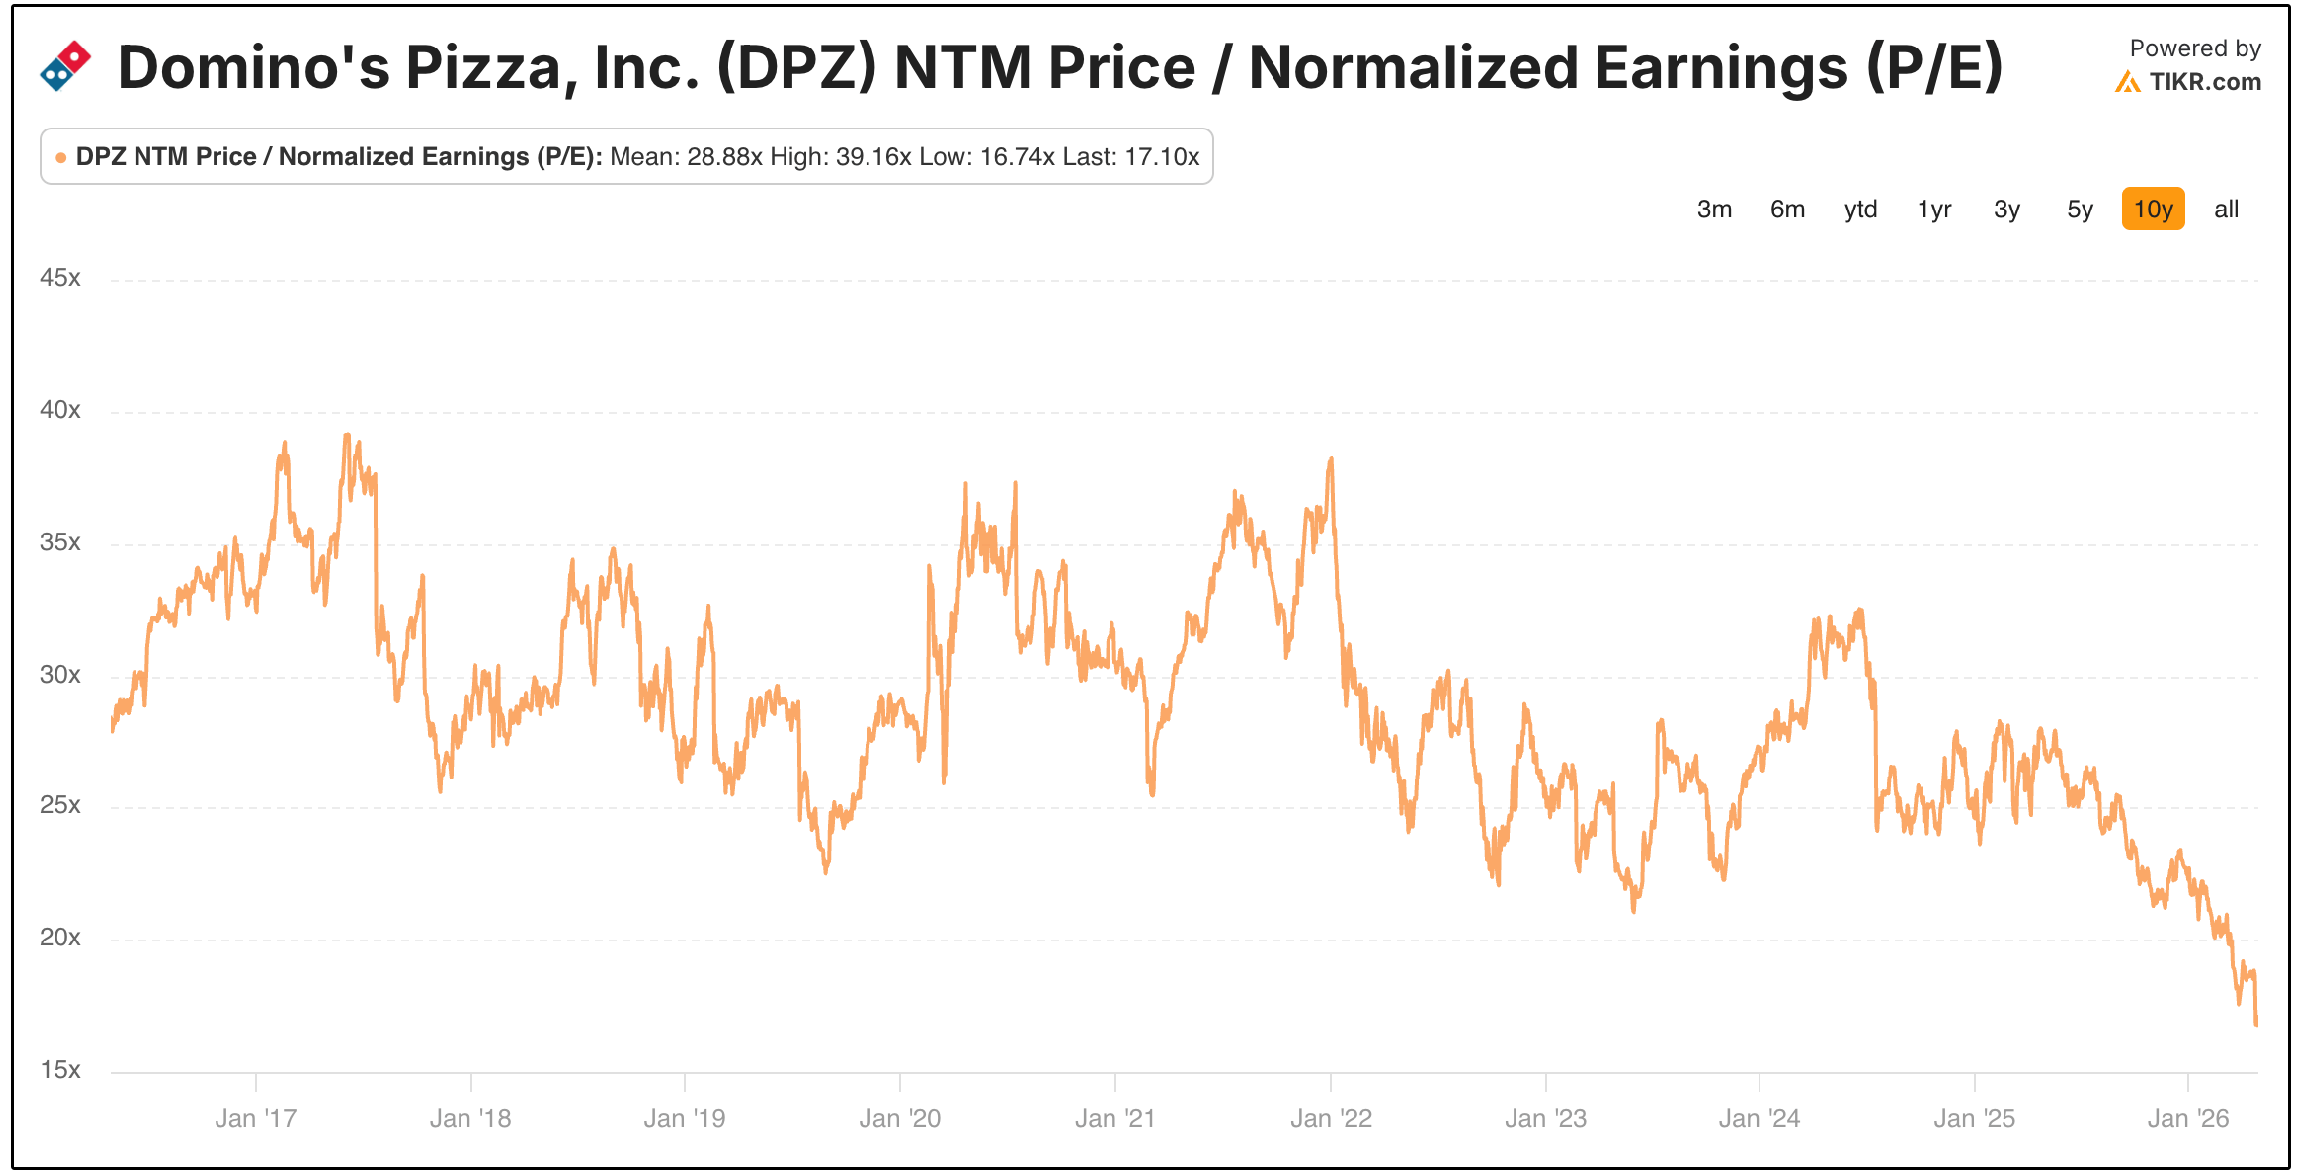
If we look at them through the lens of Bogle’s valuation (earnings growth + shareholder yield + multiple change):
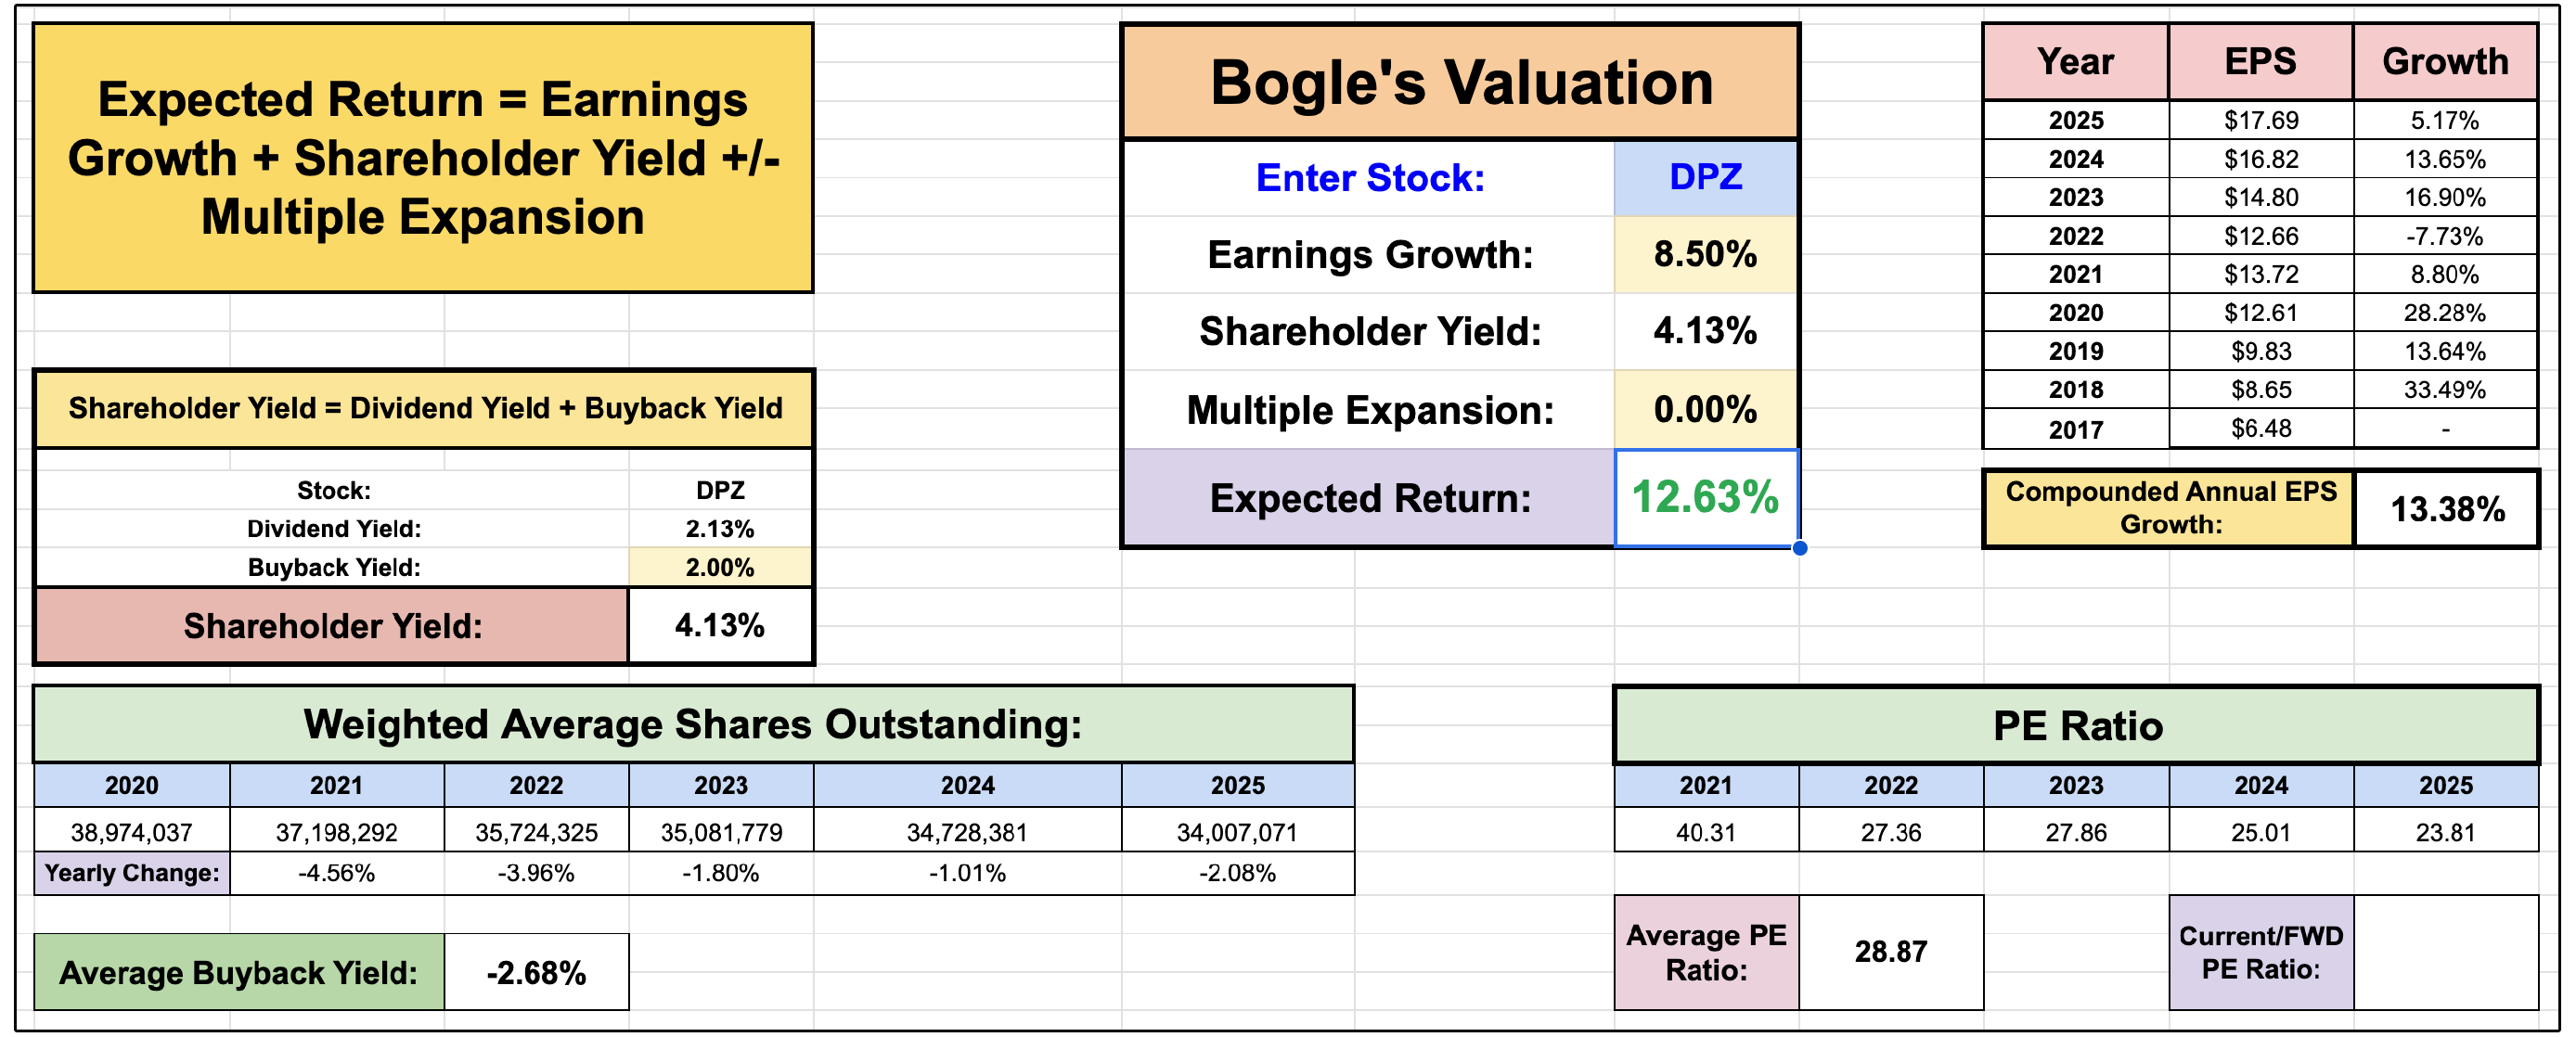
At ~8.5% EPS growth, a starting 2.4% dividend yield, and ~2% buyback yield, with no further multiple compression, you get expected returns near 12.63% annually.
If DPZ sustains EPS growth at around 8.5%, I do think over time some level of multiple expansion becomes likely, further adding to total returns.
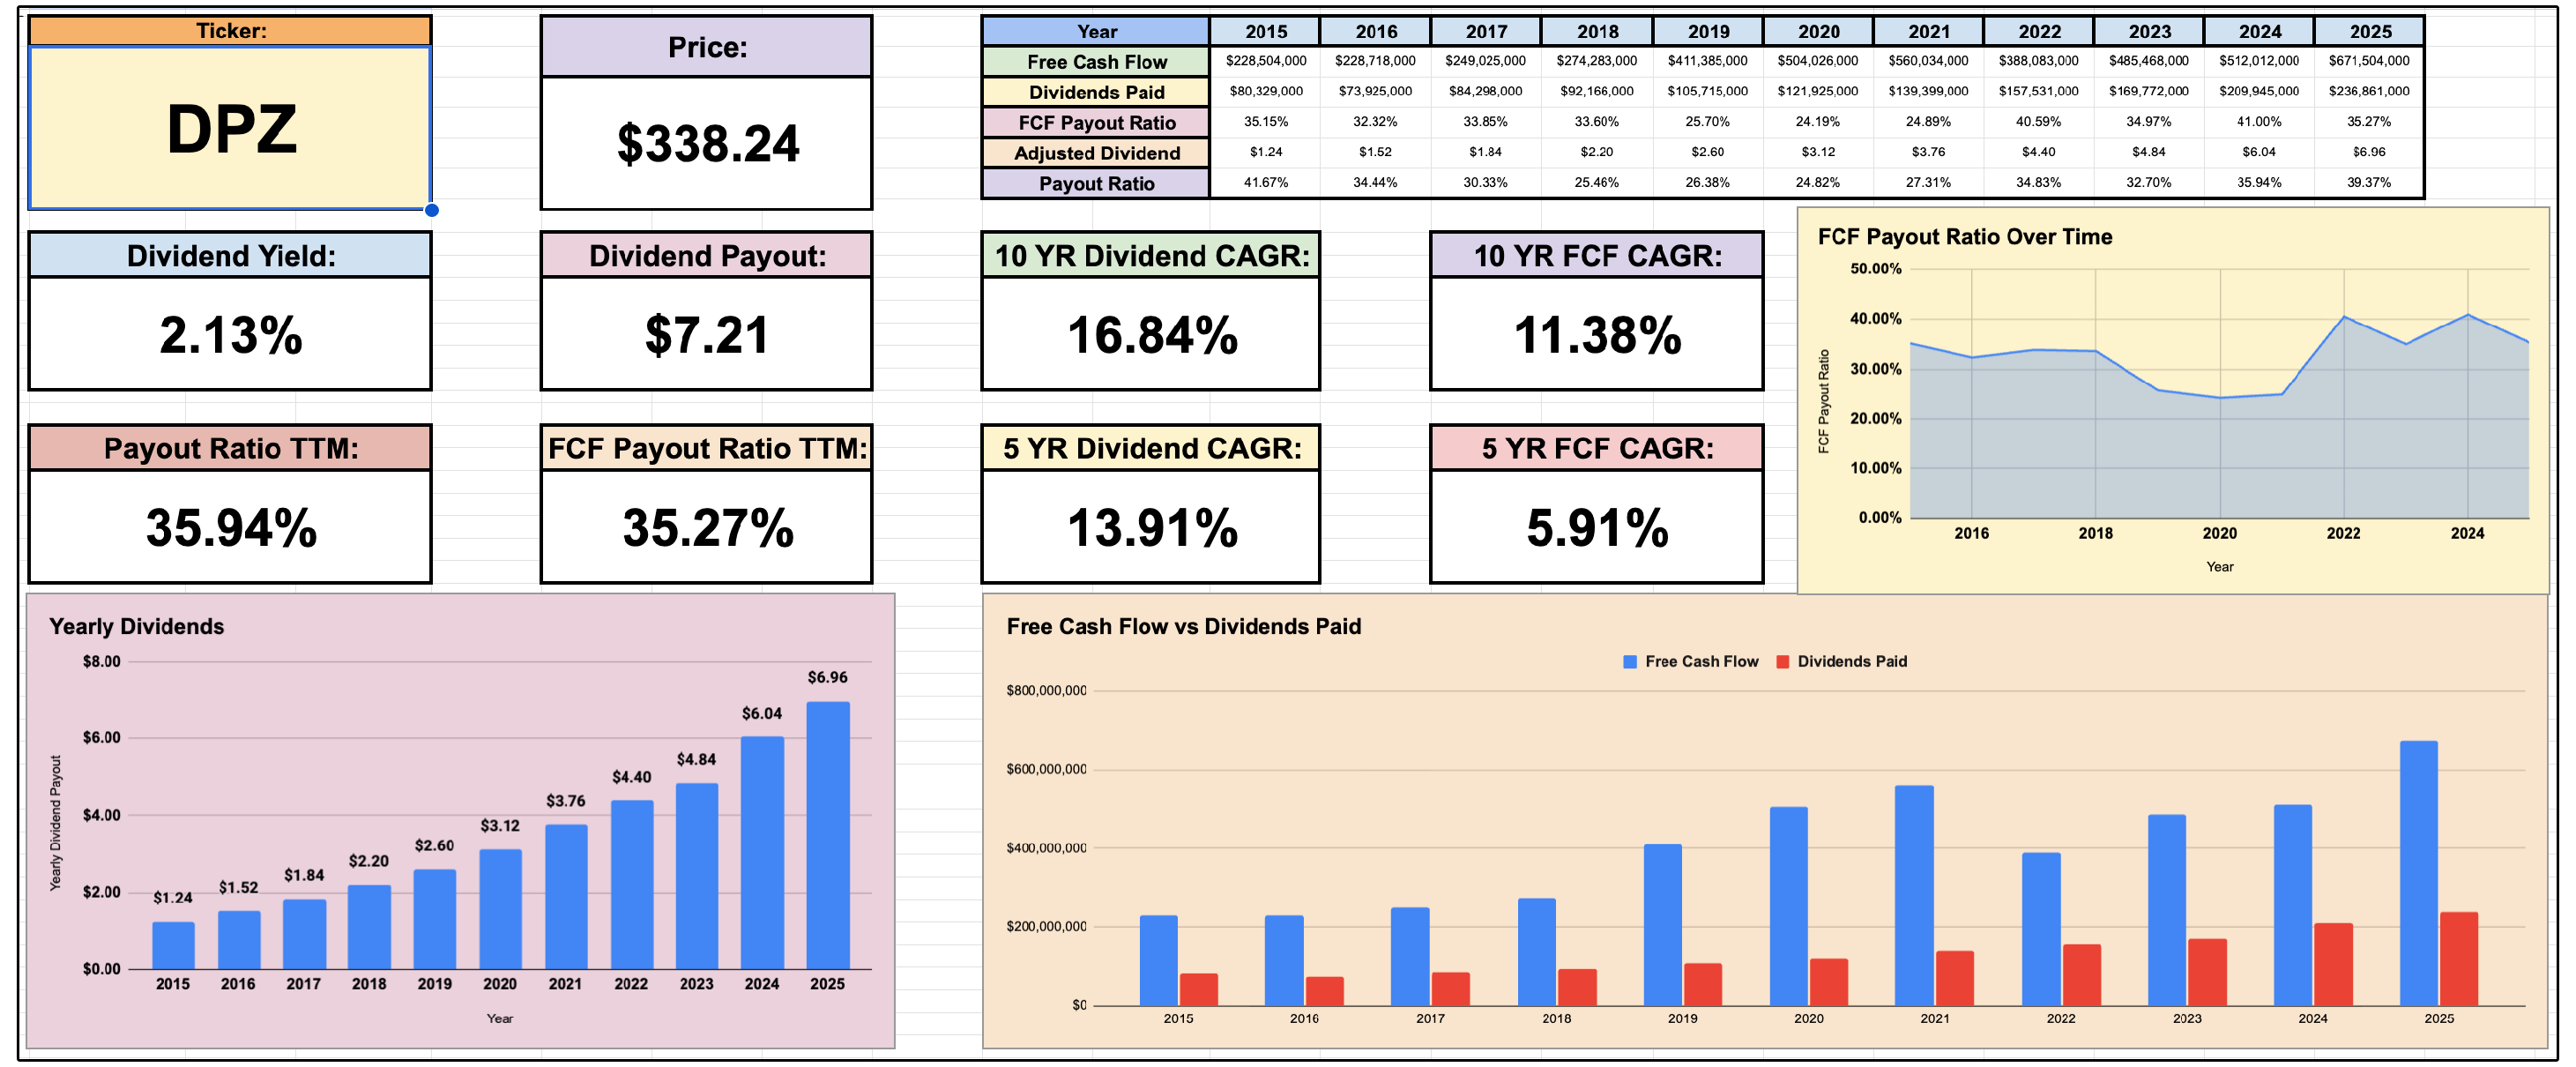
On top of this, DPZ has historically been an incredible dividend grower.
A starting yield of 2.13% with a 5 year dividend CAGR of 13.91% gives them a chowder score of over 16!
Chowder Score = Stock's current dividend yield + its 5-year compound annual dividend growth rate (CAGR)
For patient long-term dividend growth investors, the valuation and dividend metrics make DPZ interesting at these prices.
I'd add it to the watch list now and follow same-store sales and FCF closely over the next few quarters.
Now, let’s review the full list for March.