
⚡ Our Dividend Growth Portfolio is Outperforming!
Inside the Dividend Growth Portfolio 💎

The S&P 500 finished 2025 with a total return of 17.9%.
The past 3 years have simply been amazing.
2023: +26.3%
2024: +25.0%
2025: 17.9%
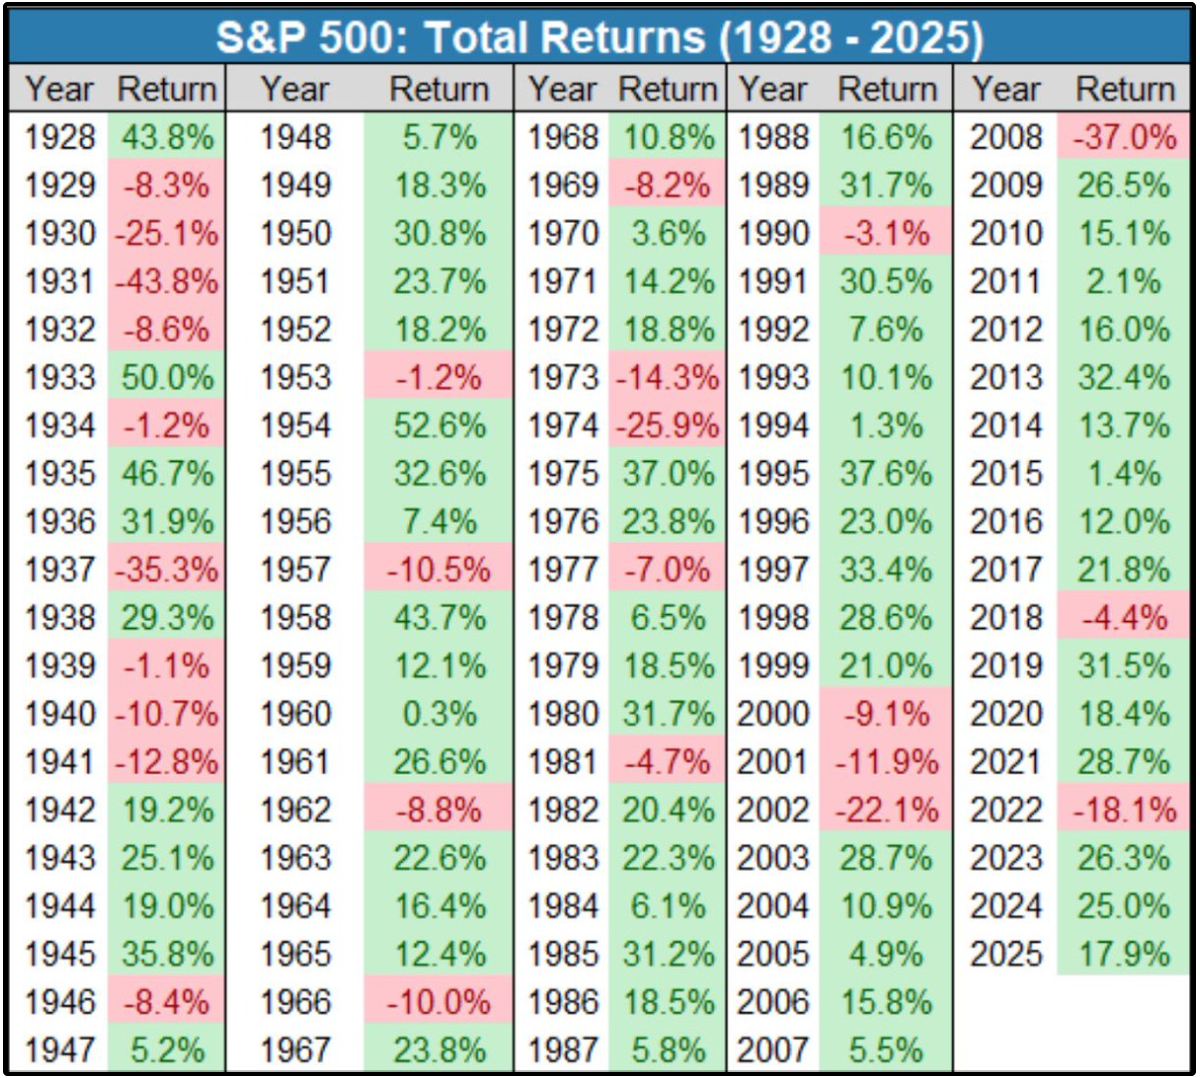
What an incredible run for the market.
However, we can’t talk about returns without acknowledging the market appears overvalued based on nearly any historical valuation metric.
Take a look at the Buffett Indicator for example:
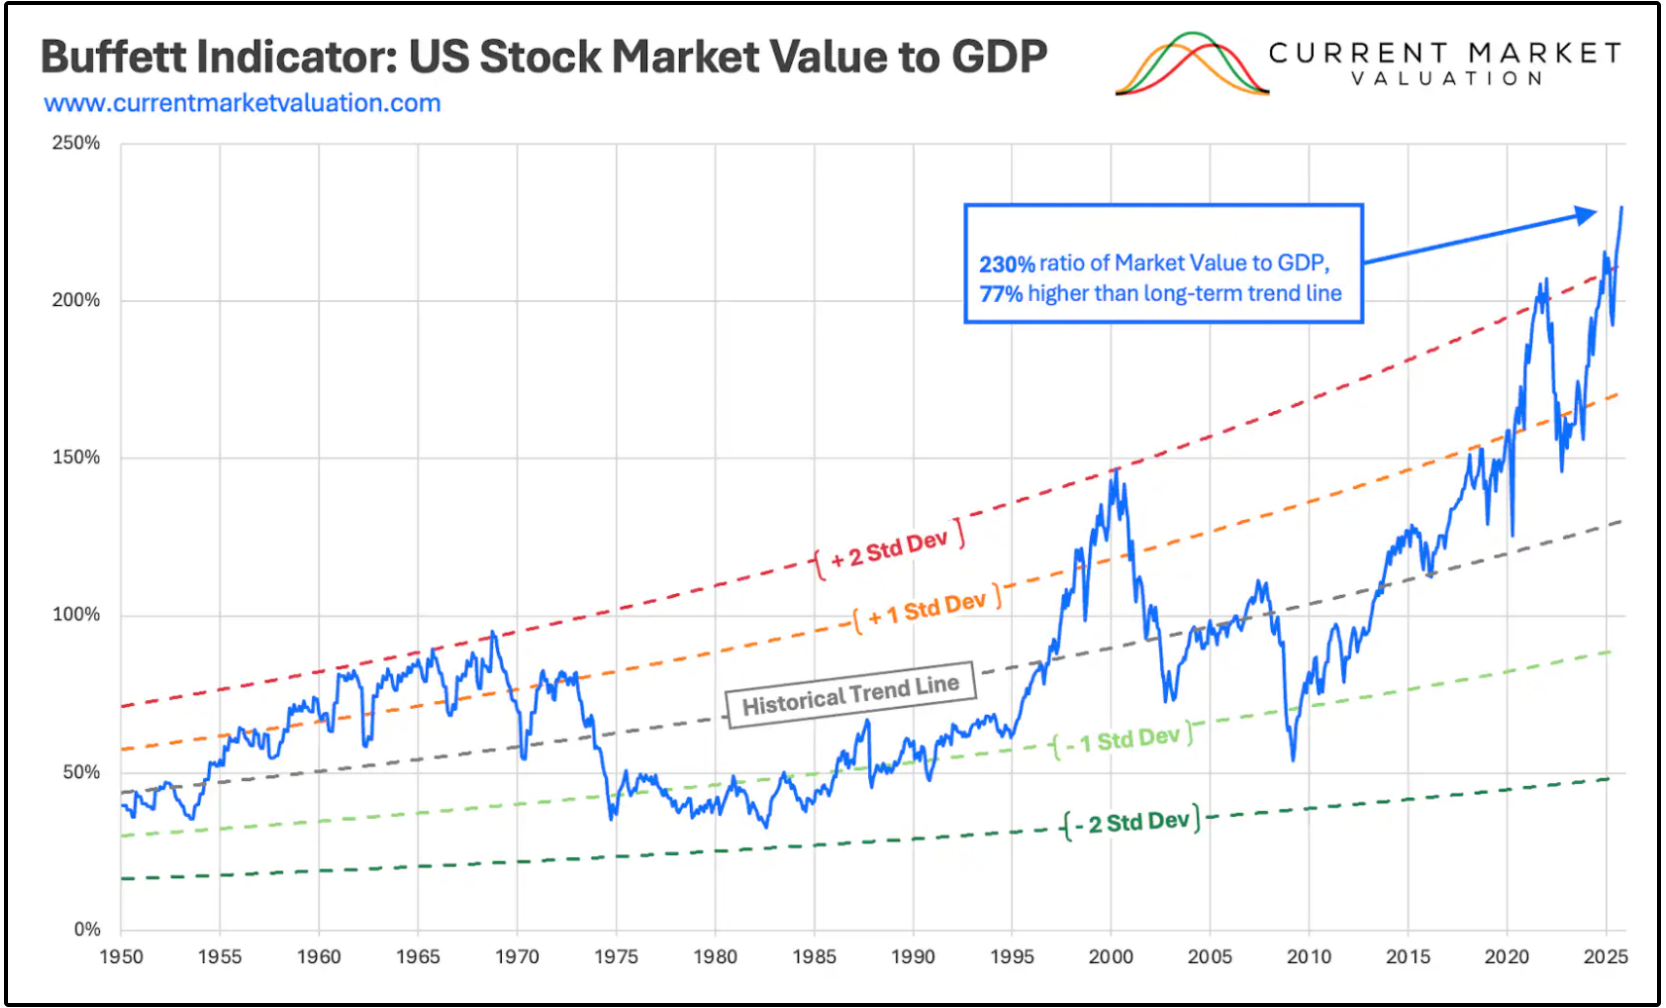
The Buffett Indicator tells us we’re at our most extreme valuation ever.
The Shiller PE valuation tells us we’re at our most stretched valuation since the Dot Com bubble.
📊 The Dividend Growth Portfolio
We initiated our first position in the Dividend Growth Portfolio on October 21st of 2025.
So how has our portfolio performed since then?
DG Portfolio (time-weighted return): 7.75%
S&P 500 (time-weighted return): 1.51%
Our portfolio has outperformed the S&P 500 by a wide margin in a short amount of time!
What does this mean?
In reality, not very much.
I care very little about the short-term price movement of the positions in the portfolio.
I’m much more concerned with the evolution of the quality and intrinsic value of the companies in the portfolio-
Especially with market valuations currently sitting so high.
So instead of assessing the returns over such a short time period, let’s assess the quality of the positions in our portfolio, as well as the growth in intrinsic value.
⚖️ DG Portfolio vs S&P 500
Over the last 5 years, our Dividend Growth Portfolio positions have grown revenue at a rate on average of 13.5%.
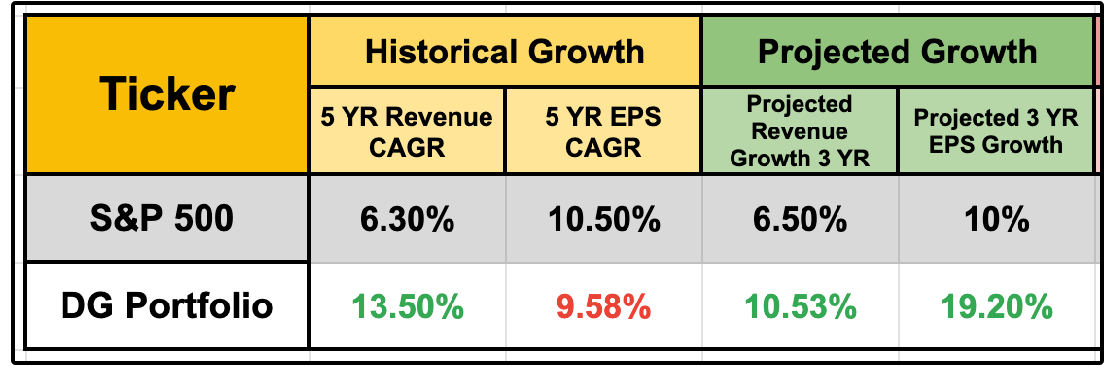
Perhaps even more importantly, our DG portfolio positions are projected to grow revenue at a compounded annual growth rate of 10.53%, which is significantly faster than that of the S&P 500.
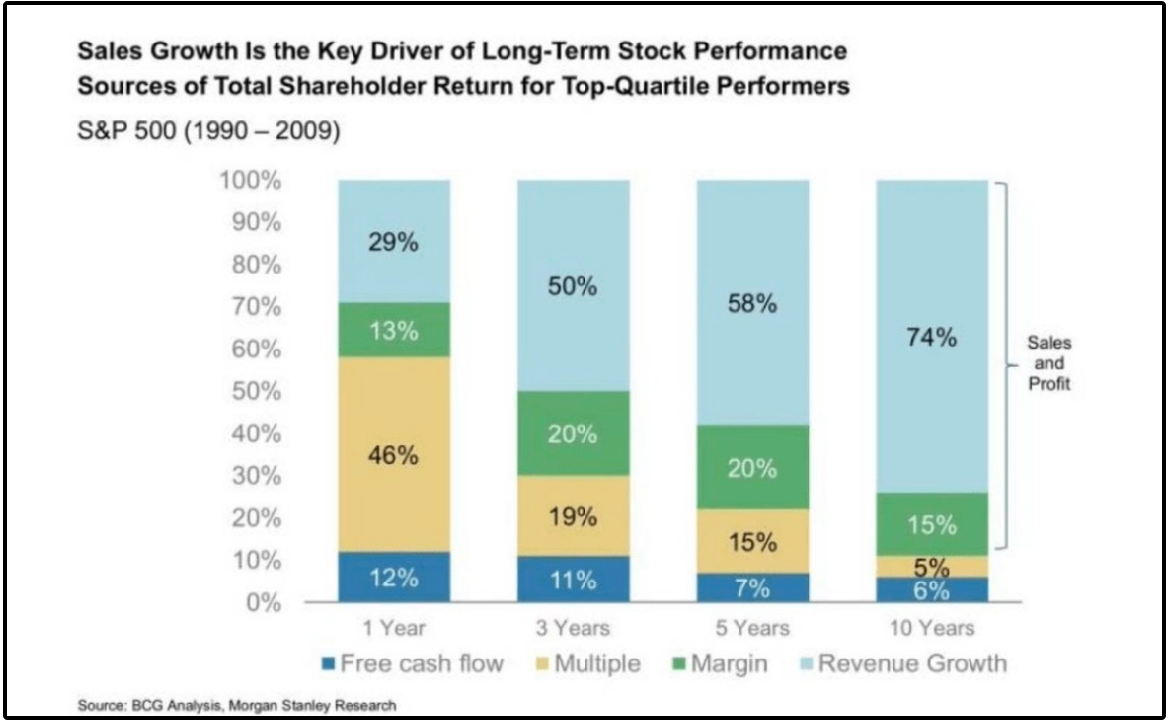
While EPS and free cash flow growth are the ultimate measures of intrinsic value over the long term, sales growth is the primary lever used to achieve growth of EPS and free cash flow.
While the average historic EPS growth of our positions falls slightly behind that of the S&P 500, projected EPS growth is significantly higher:
S&P 500 Projected EPS Growth: 10%
DG Portfolio: 19.20%
The intrinsic value of our holdings is growing much faster than the S&P 500.
While this is great, purchasing a company growing EPS rapidly can be offset if you purchase the company at too high of a price.
"A too-high purchase price can undo the effects of a subsequent decade of favorable business developments.” - Warren Buffett 1982 Letter to Shareholders
So how does the valuation of our portfolio shape up to the the S&P 500?
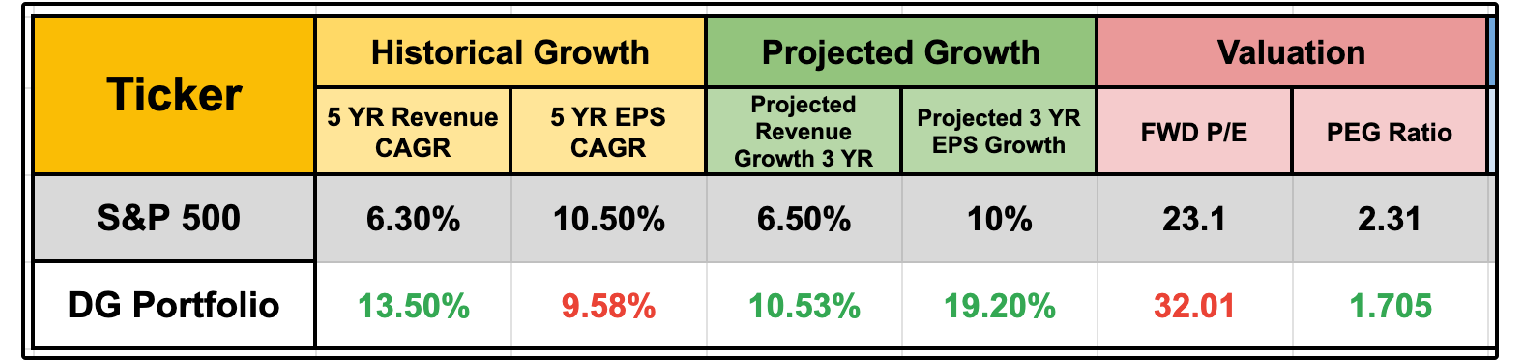
While the forward P/E multiple currently sits higher than that of the S&P 500-
We must remember that the P/E ratio by itself actually tells us nothing about the valuation of a company as it doesn’t account for future earnings growth rates.
When using the PEG ratio to account for the earnings growth of our positions, we see that the valuation of our portfolio is actually much more attractive than the S&P 500:
S&P 500 PEG Ratio: 2.31
DG Portfolio PEG Ratio: 1.705
Not only that, but it’s clear that the business quality of the holdings in the DG portfolio is substantially better than that of the S&P 500.
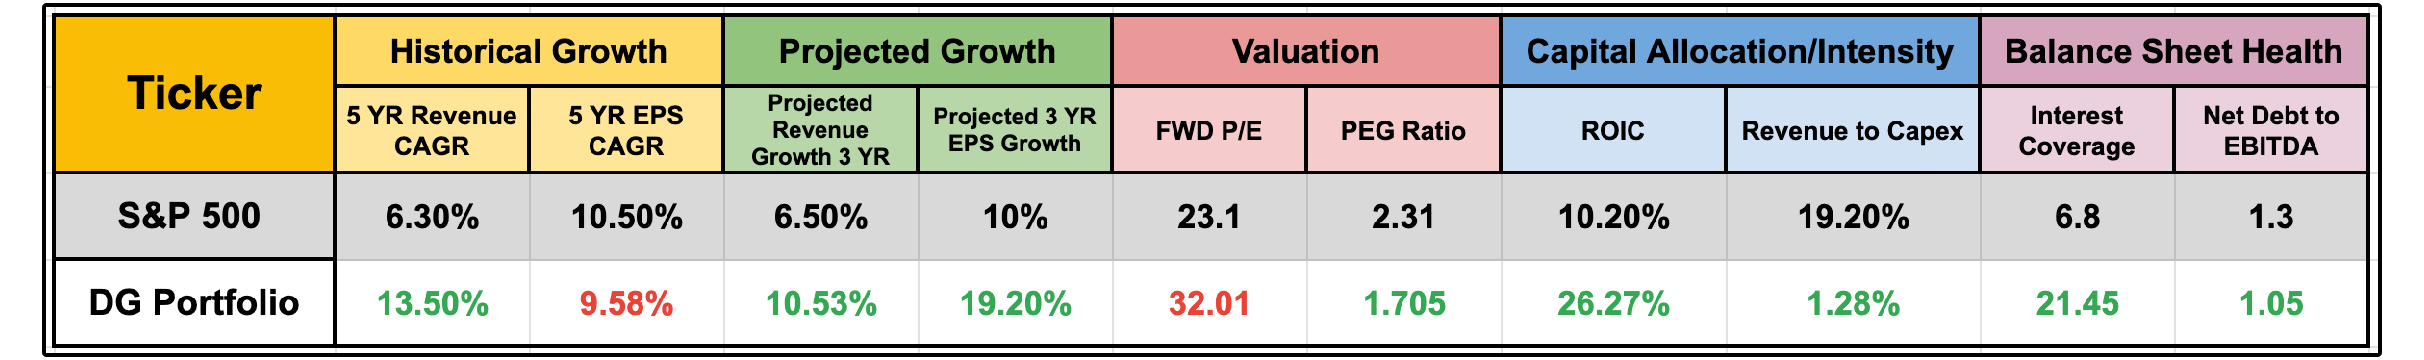
We own incredibly capital-light businesses that generate high returns on invested capital, with excellent balance sheet health.
In a market that many would argue is overvalued, we’ve been able to add positions to our portfolio that:
Are fundamentally healthier than the S&P 500
Are growing revenues and EPS at a faster rate than the S&P 500
Trade at a more attractive valuation than the S&P 500
And of course, our positions are growing dividends at a double-digit rate on average.
We feel we are incredibly well positioned as we head into 2026, and will continue to seek out positions that fit the same criteria above.
Let’s review the positions in the portfolio: