
📊 Outperforming With BIG Dividends From REITs!
The Top 9 REITs Revealed! 💎

Top 10 AI-proof SaaS Stocks
Constellation: -47%. ServiceNow: -55%. Figma: -81%.
Everyone is now expecting vibe-coded solutions to replace legacy companies with tens of thousands of employees and millions of customers. This is what peak pessimism looks like.
The market is wrong. Under the hood, a few of these “AI victims” are accelerating revenue with AI. We now have a brief moment where sentiment is overshadowing fundamentals.
Rebound Capital has spent months identifying these software beneficiaries — what went wrong, how they hold up against AI, and their current valuation — all in a 33-page, 5,000-word PDF.
Dividendology readers can now unlock this report for free!

Thanks to Rebound Capital for sponsoring.
📊 Generating BIG Dividends With REITs!
Entering into 2026, I made it clear that I was quite bullish on the REIT sector as a whole.
While we could point to a multitude of reasons as to why this was, the overall thesis was simple:
REITs were trading at one of their lowest valuations relative to equities in over 20 years.
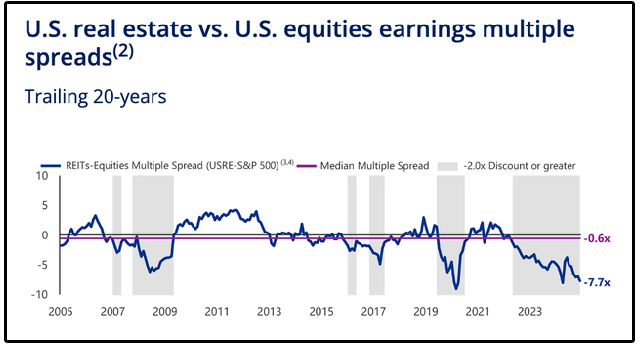
When REITs have traded at a discount of -2.0x or greater to U.S. equities, the average forward returns have been impressive:
1 year later: +25.6% for REITs vs. +21.0% for U.S. equities
2 years later (annualized): +18.7% vs. +12.7%
3 years later (annualized): +13.9% vs. +12.8%
As we entered into 2026, they were trading at a 7.7x discount, which is one of the steepest discounts in history.
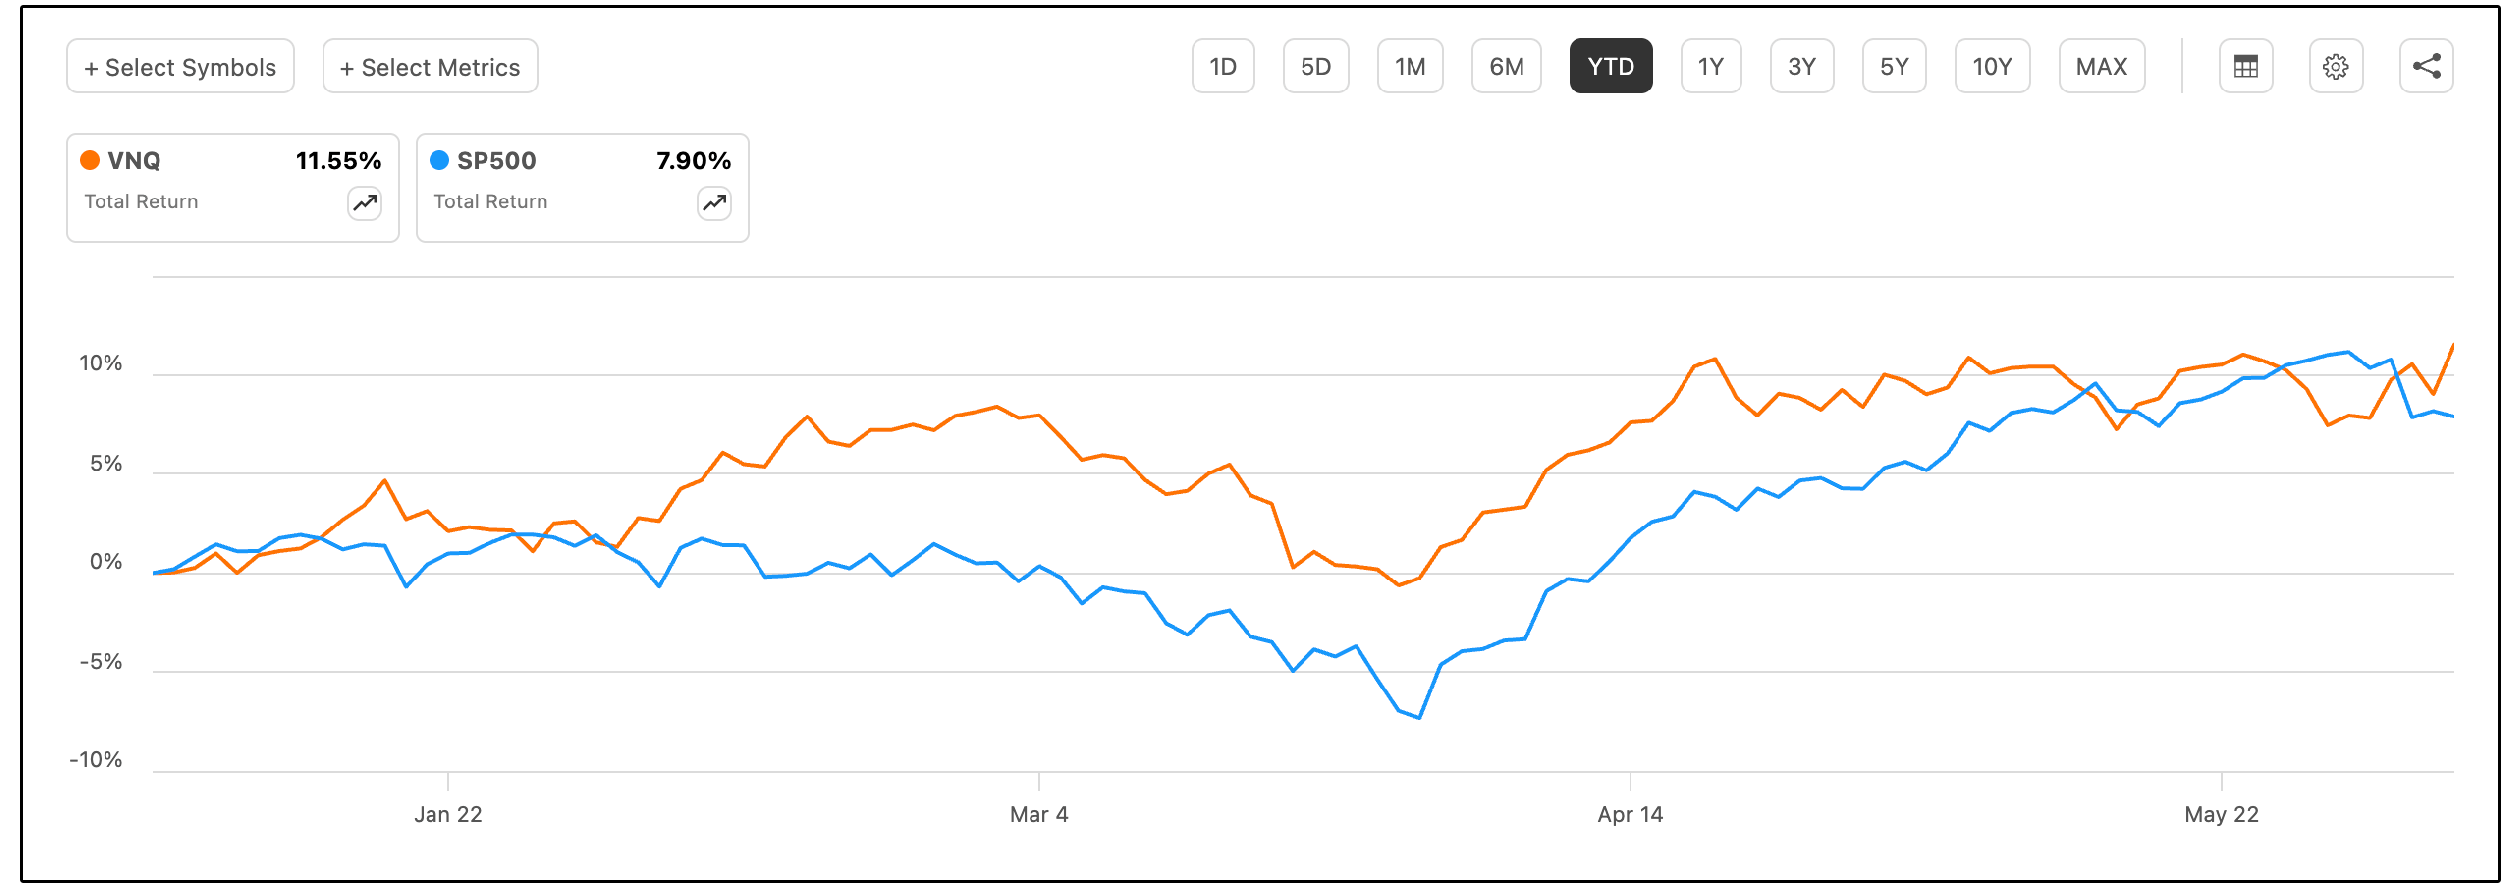
So far, the thesis has played out quite well, as the VNQ (the Vanguard real estate index) has outperformed the tech heavy S&P 500 year to date.
With that being said, the REIT sector is still trading at a substantial discount relative to equities and relative to historical REIT valuations.
This outperformance trend may not be over yet.
However, the market environment REITs are operating in has shifted dramatically, and not all REITs are set to benefit.
📈 Shifting Market Environment
Every year, we invest well over $10,000 to get in depth research, reports, and data to provide for members of Dividendology.
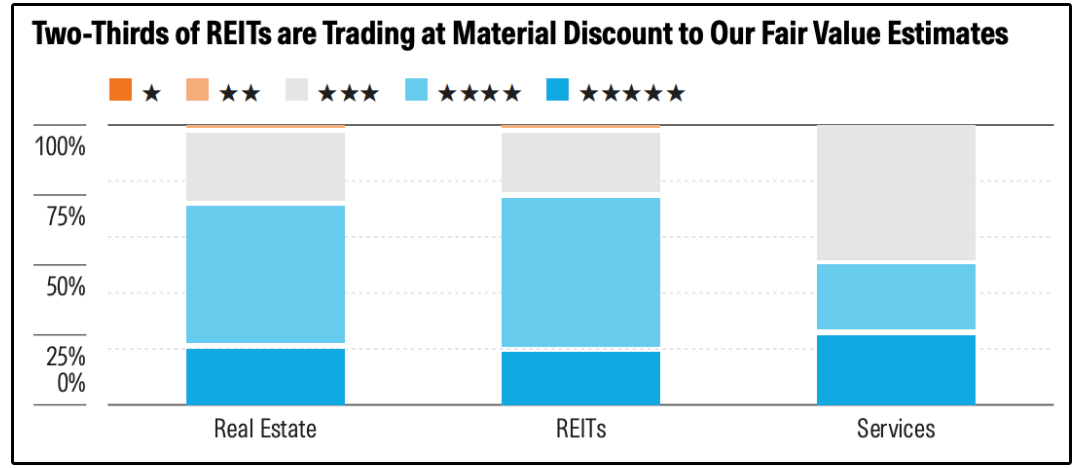
Entering into 2026, Morningstar reported that two-thirds of REITs were trading at a matieral discount to their fair value estimates.
It’s important to note that historically, REIT performance has closely followed movements in the 10-year Treasury yield.
The chart below shows two important things.
The red line is the market yield on the 10-year U.S. Treasury.
The blue line is the inverse relative performance of U.S. REITs compared to the broader U.S. stock market.
When the blue line is moving lower, REITs are generally outperforming the market.
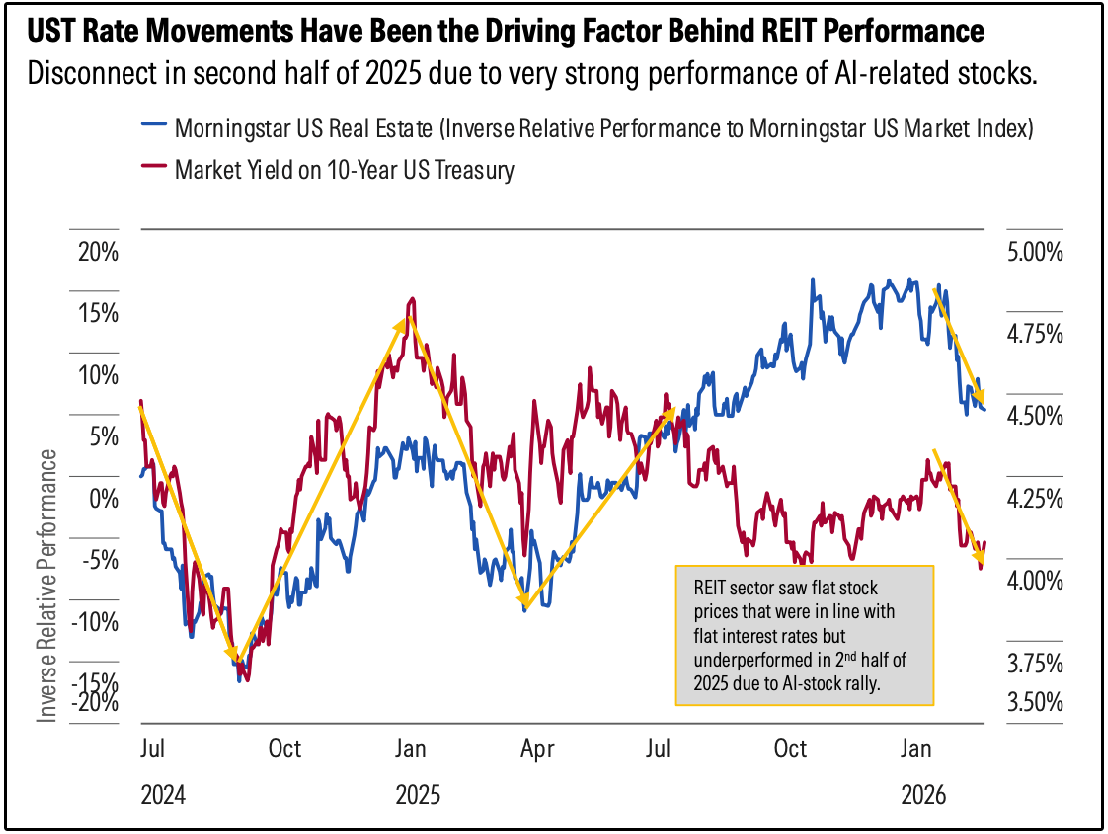
When the 10-year Treasury yield rises, REITs typically come under pressure. Higher rates can increase borrowing costs, make acquisitions less attractive, and create more competition from bonds and cash-like instruments.
But when the 10-year Treasury yield falls, the opposite tends to happen.
Lower rates can reduce the pressure on REIT balance sheets, make their dividend yields more attractive, and support higher valuations across the sector.
However, as I’ve pointed out many times this year, target rate probabilities for 2026 have shifted radically in the last few months.
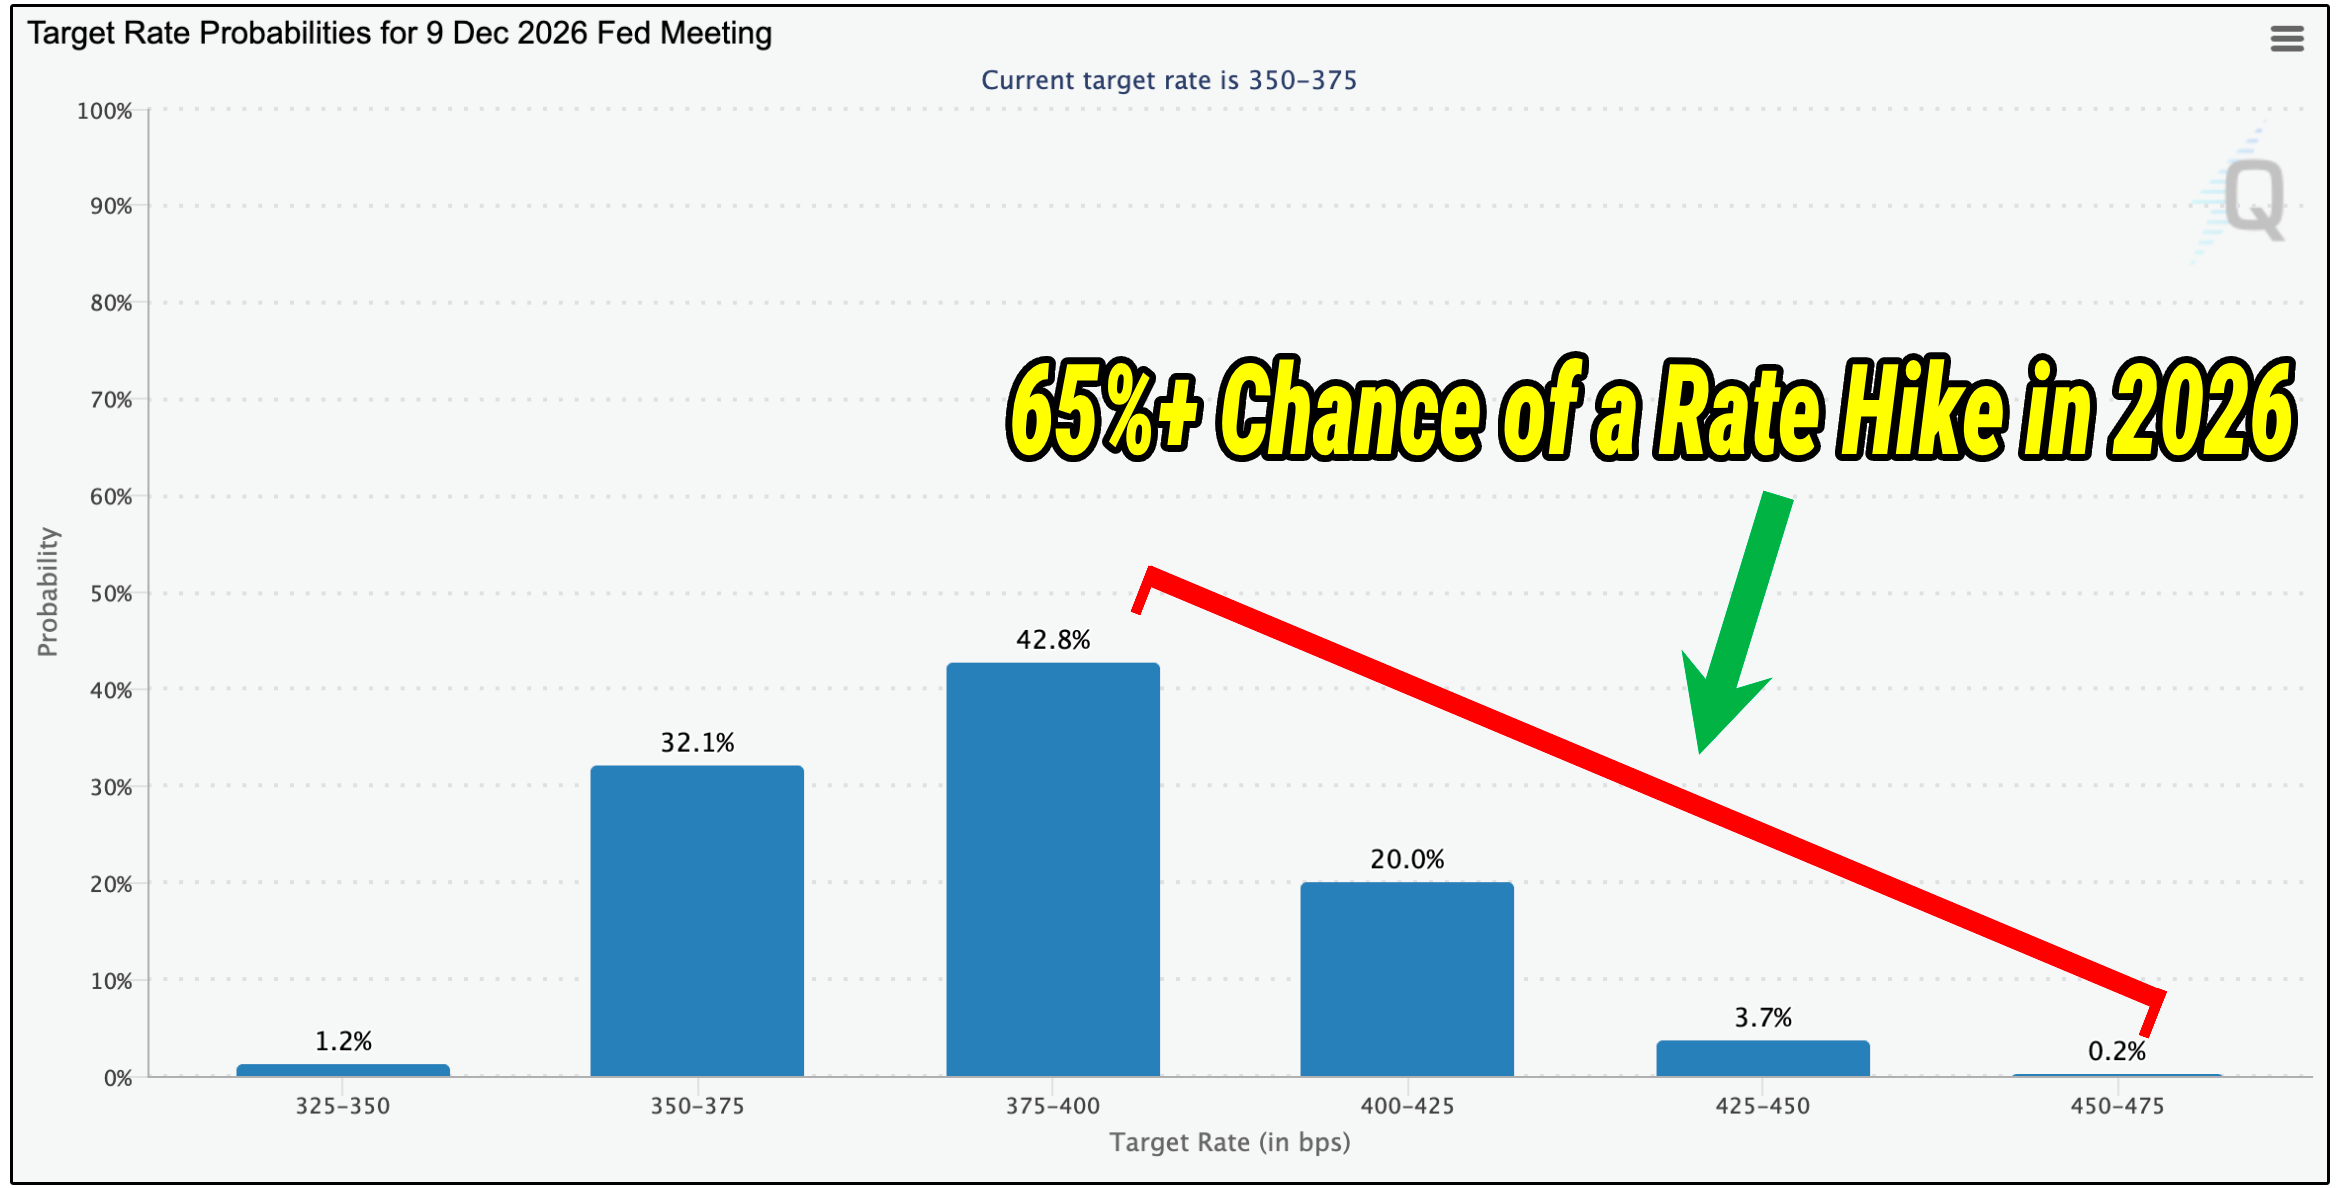
We entered into the year with the market expecting three rate cuts-
But probabilities now show a 65% chance of a rate hike.
This shift creates a strong gravitational effect that pulls equities (particularly REITs) downward.
However, quality REITs continue to grow AFFO per share during these periods, meaning the company becomes stronger, while the valuation becomes more attractive.
Let’s create a simple REIT investable universe to take advantage.
📌 Dividendology REIT Database
The Dividendology Database is available for members of Dividendology.
But today, I’m sharing a portion of it with everyone.
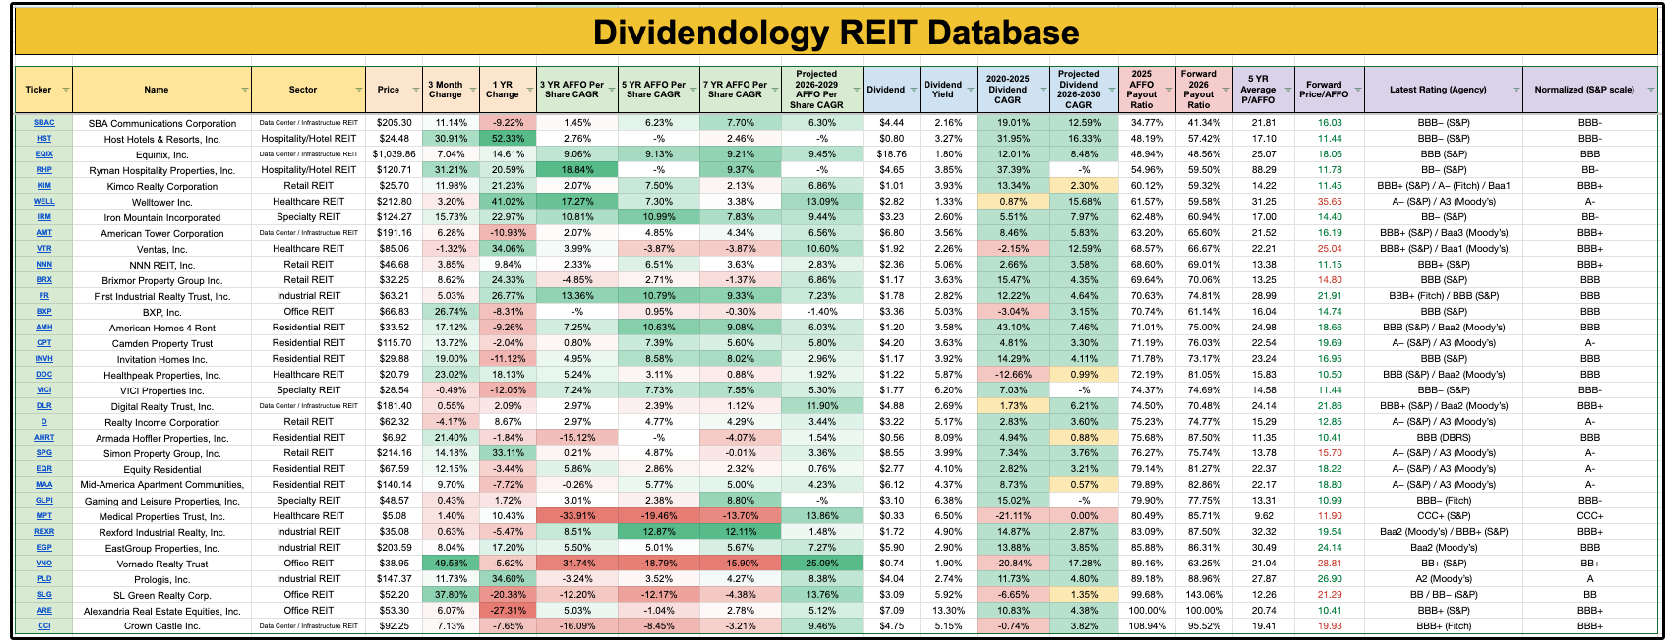
There are currently 33 REITs being tracked in the REIT Database.
Let’s see if we can use our investable universe screen to narrow this down.
We want to look for REITs that are fundamentally strong, so to start, we look for AFFO per share growth.
🗂️ 1. Growing AFFO Per Share
When we want to see if a stock is growing intrinsic value, we see if they are growing free cash flow.
When we want to see if a BDC is growing intrinsic value, we see if they are growing tangible book value per share.
And if we want to see if a REIT is growing intrinsic value?
We see if they are growing adjusted funds from operations per share.
AFFO per share is the ultimate metric for REITs.
Let’s filter out all REITs that do not have positive AFFO per share growth over the past 7 years AND filter out any REIT not projected to grow AFFO per share at least 2.5% annually moving forward.
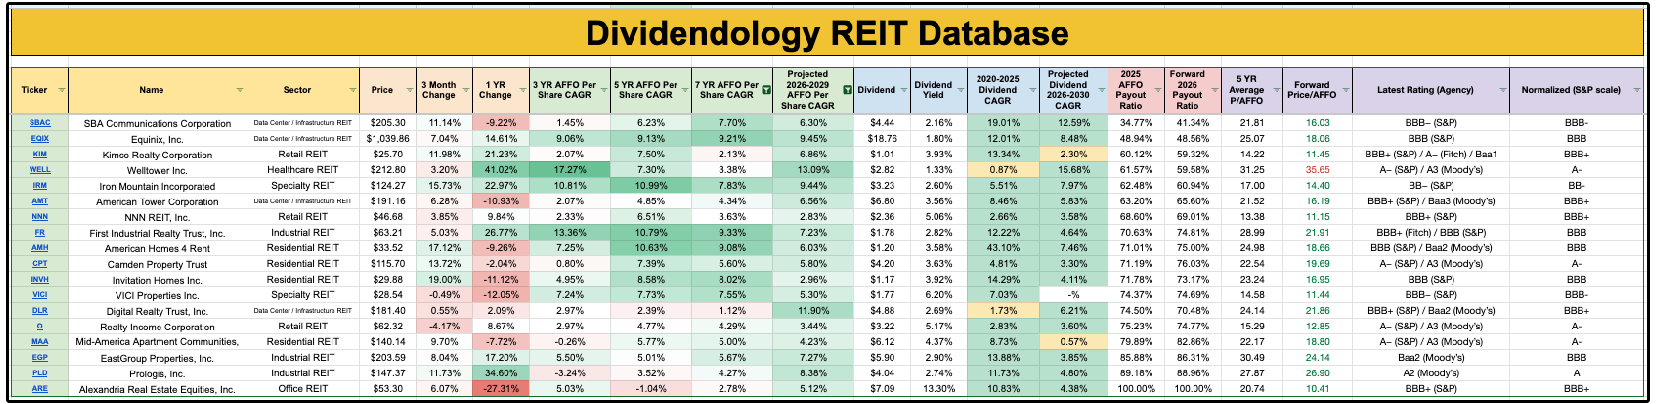
All of a sudden, we went from 33 REITs down to 18.
💸 2. Growing Dividends
The majority of people investing in REITs are buying them for their high yields.
So naturally, we need to make sure those dividends are sustainable.
Let’s filter out all REITs that have a forward AFFO payout ratio of above 85% AND a yield of at least 3%.
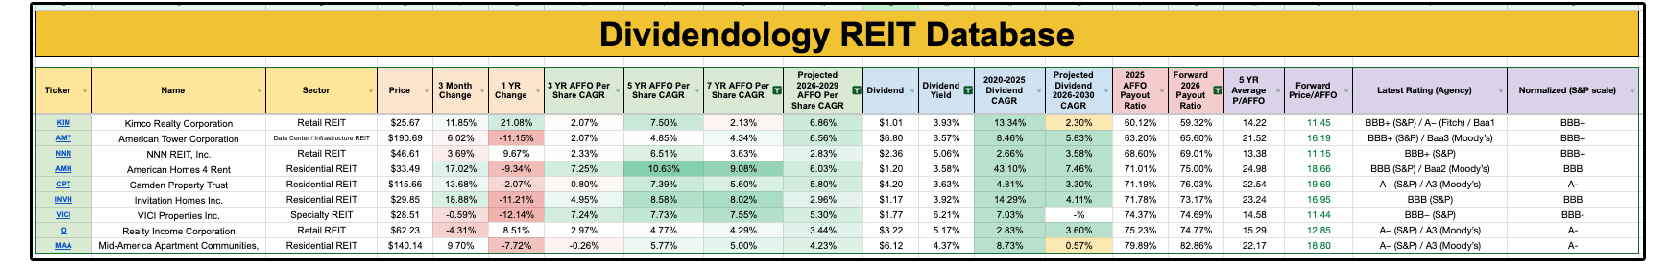
Now, we are left with just 9 REITs!
📑 3. Balance Sheet Health
Finally, we must assess the health of the REITs balance sheet.
In reality, this would require analyzing things like:
Total debt vs. market cap
Secured vs. unsecured debt
Fixed-rate vs. variable-rate mix
Weighted average interest rate
Debt ladder
Leverage ratios
These are things I discuss in my 46 minute video on how to analyze REITs.
But since we’re simply running screens, we will use our credit ratings.
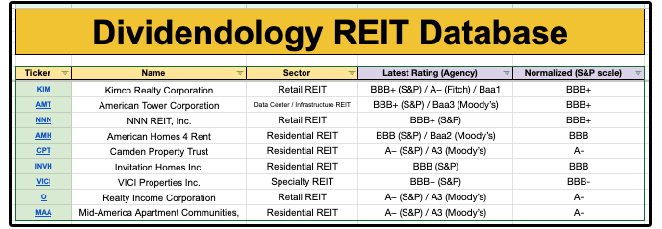
We can see that all the REITs we’ve filtered down to already have an investment grade credit rating.
💥 4. Valuation
Finally, we must assess the valuation.
Valuations for REITs have been so compressed, that every single REIT in our investable universe is trading below its 5 year average P/AFFO multiple!
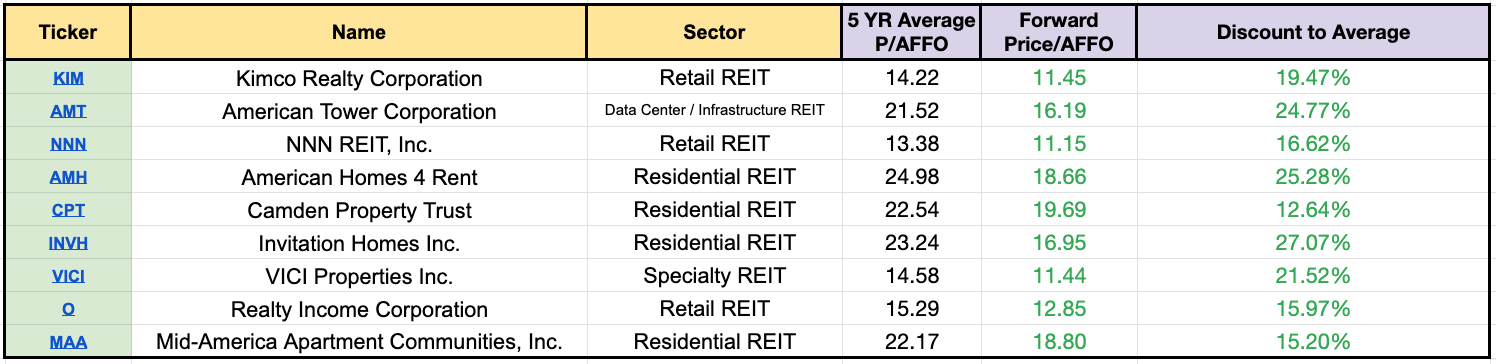
The average discount is 19.9%.
Obviously there is more to assess when it comes to valuations, and the rate at which they can grow AFFO per share heavily impacts the multiple that REITs deserve to trade at.
But with that being said…
It’s clear valuations are vastly more attractive now than they have historically been.
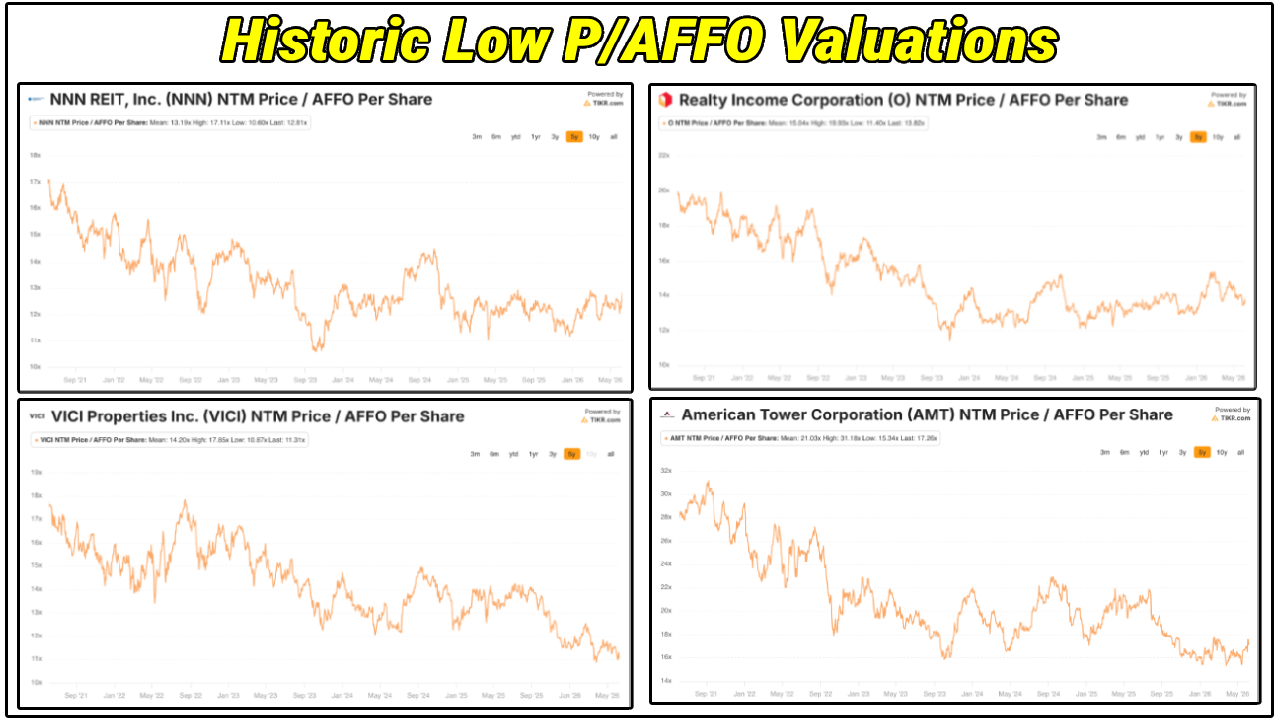
If we look at just a few of the more popular REITs on the list, we can see despite the fact the REIT market has climbed 11.5% year to date, their valuation multiple is still at historic lows.
🔑 Our Universe
With the help of the Dividendology Database, we were able to quickly spot where some of the best potential opportunities in the REIT market are by creating an investable universe.
The trends are easy to spot for most people.
Taking advantage of them is not always quite as easy.
Creating an investable universe removes roughly 80% of the work required.
As we continue to build out our Dividend Growth and High Yield Portfolios, we will filter out the weeds and look for quality.
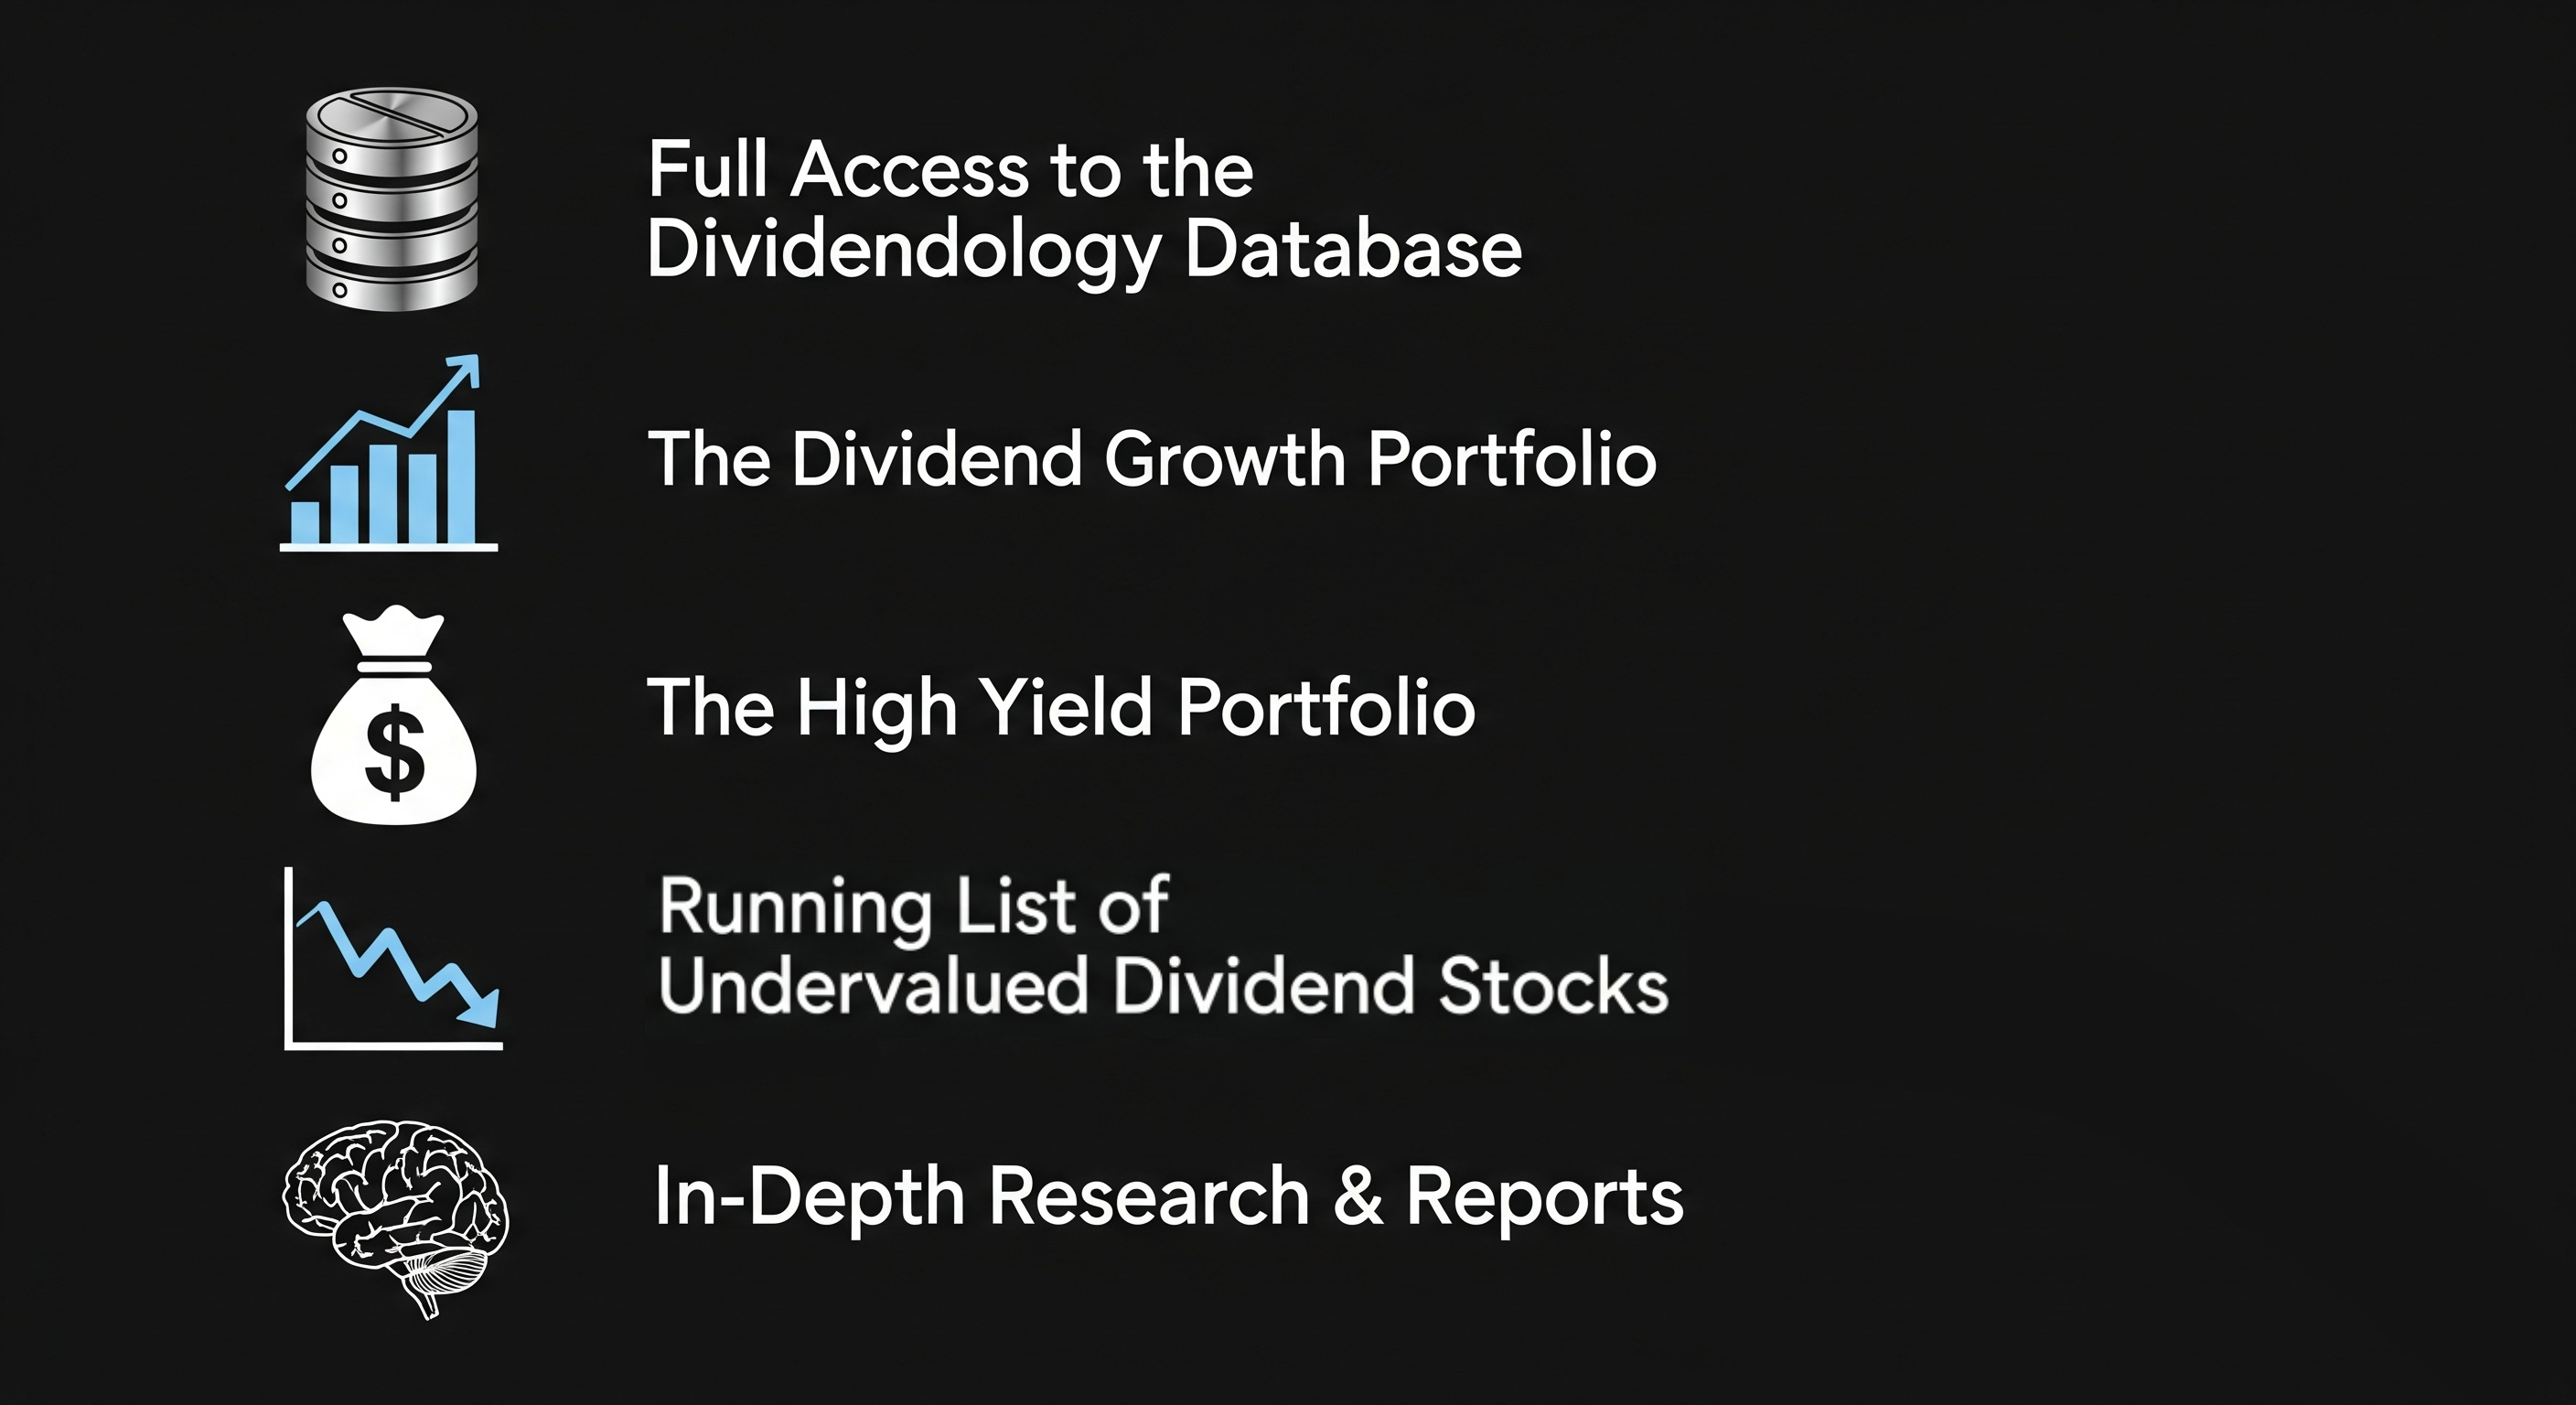
If you want to be a part of the process of building these portfolios and also get access to everything mentioned below, you can join here:
Here’s everything you’ll get as a Dividendology member 👇
Check out these resources:
Tickerdata 🚀 (TICKERDATA SUMMER SALE (CODE: 'HEAT' FOR 30% OFF)
Interactive Brokers 💰 (My favorite place to buy and sell stocks all around the world!)
Seeking Alpha 🔥 (Now currently running their Summer sale ($30 off! + 7 day free trial)
The Dividend Report 📊 (Free Newsletter for Straightforward Dividend Stock News)