
🔥 Super Investors Bought These Dividend Stocks!
Free Spreadsheet Inside! 🚀

Top 10 Rebound Stocks for 2026 From Rebound Capital
Meta once dropped 70%. Netflix: 50%. Amazon: 40%. Every investor had ruled them out, citing “the companies were done”.
But they all rebounded - Meta: 690%. Netflix: 540%. Amazon: 153%.
Every world-class company suffers deep drawdowns. Rebound Capital identifies high-quality companies undergoing drawdowns to capitalize on their eventual rebound.
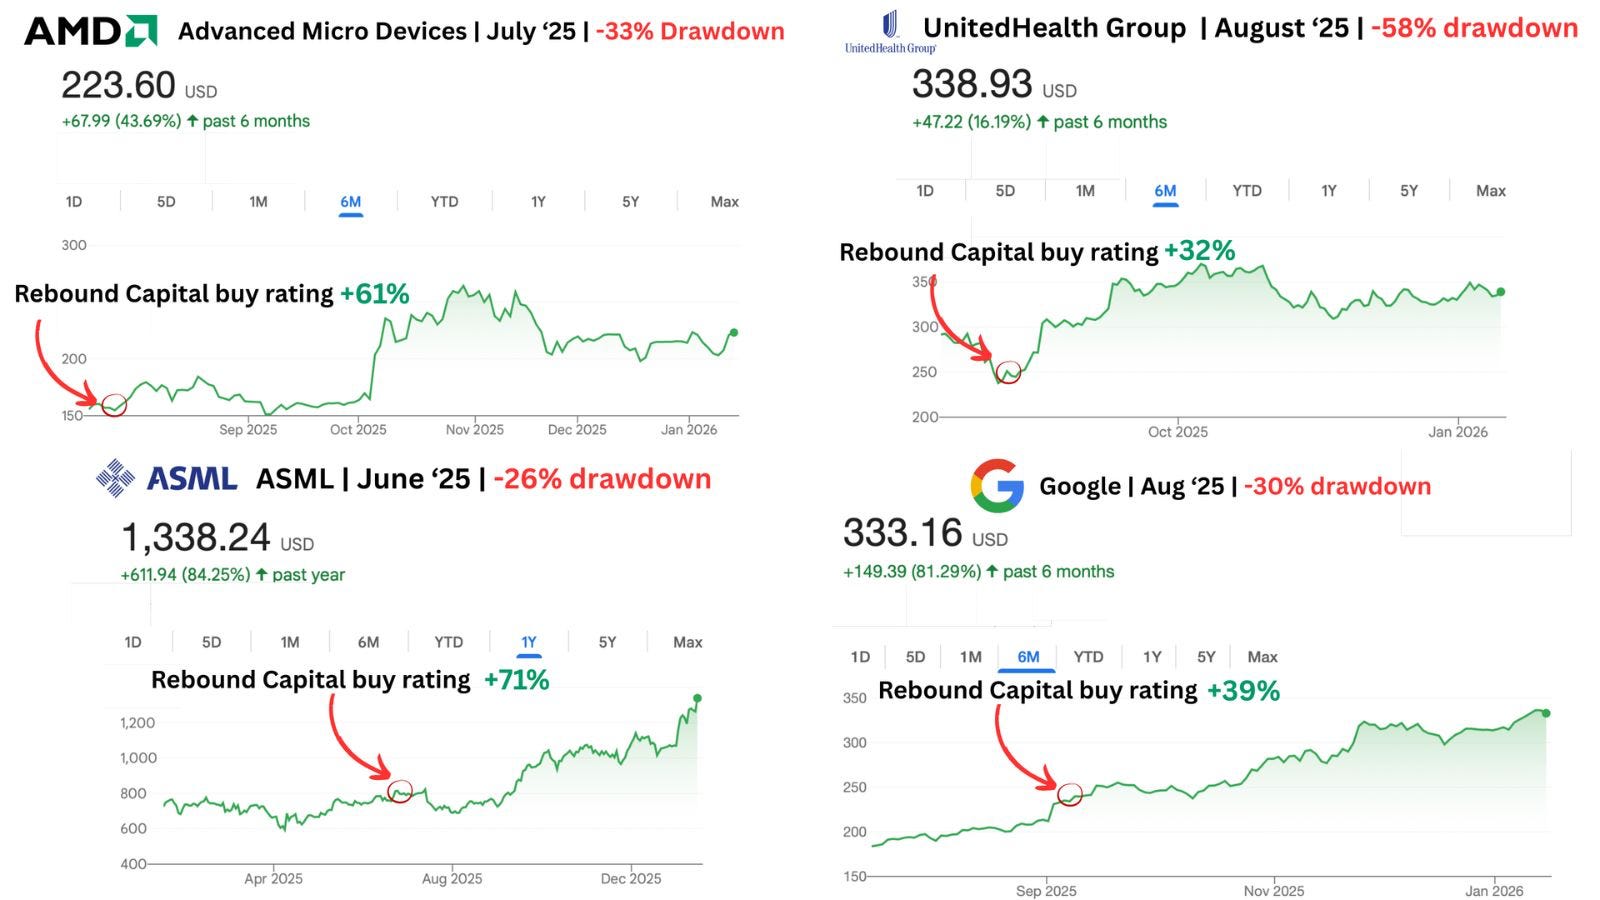
Just last year, they identified ASML (up 58%), Google (up 40%), and AMD (up 61%) as ideal rebound prospects. Dividendology readers can now unlock their exclusive 25-page report on the top 10 rebound opportunities for 2026 for free!
Thanks to Rebound Capital for sponsoring.
🎯 Stealing From Supers
One of my favorite ways to find investment ideas?
Stealing from Super Investors.

Super investors are investors with over $100M in assets under management.
Every quarter, they are required by law to reveal all of the moves they’ve been making in their portfolio.
🔍 Dividendology Database
Last year, we launched the Dividendology Database.
While we primarily use this database for alternative income asset classes, like:
REITs
BDCs
Covered Call ETFs
One of the things we also track in this database is the buying history of dividend stocks for Super Investors.

To my knowledge, this is the only resource for tracking these types of purchases on the internet.
While each quarter gives us insight into where capital is moving-
More importantly, it reveals the underlying trends of where the smart money has been moving over longer periods of time.
This is where the real insights come from.
📊 Grow The Dividends
I compiled insights on the top 50 most bought dividend stocks by Super Investors.
The trend we see nearly every quarter?
Super Investors have a huge bias towards dividend growth stocks.
Stocks that grow free cash flow at a high rate, and as a result, typically grow dividends at a high rate.
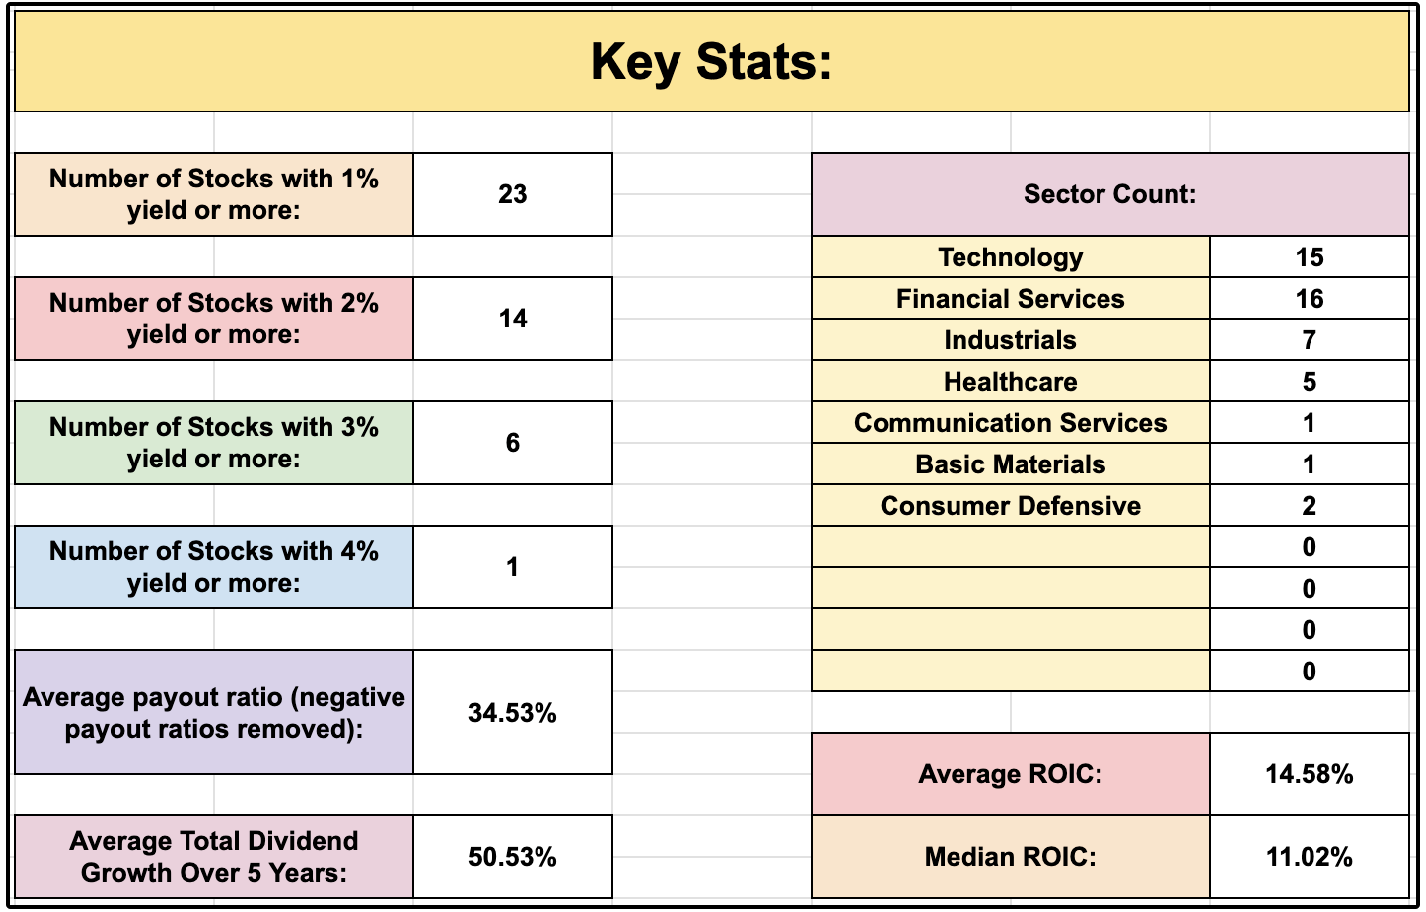
The average total dividend growth over the last 5 years from these stocks was above 50%, while the average payout ratio was just 34%.
💰 Super Investors: Top 10 Buys
You can see the top 10 list of Super Investors buys here:
🪟 MSFT — Microsoft Corporation
📱 META — Meta Platforms, Inc.
💳 V — Visa Inc.
🔬 TSM — Taiwan Semiconductor Manufacturing Company Limited
🔎 GOOG — Alphabet Inc.
🔎 GOOGL — Alphabet Inc.
⚡ TXN — Texas Instruments Incorporated
🏗️ FERG — Ferguson plc
🚂 UNP — Union Pacific Corporation
🧪 TMO — Thermo Fisher Scientific Inc.
The full top 50 list is below:
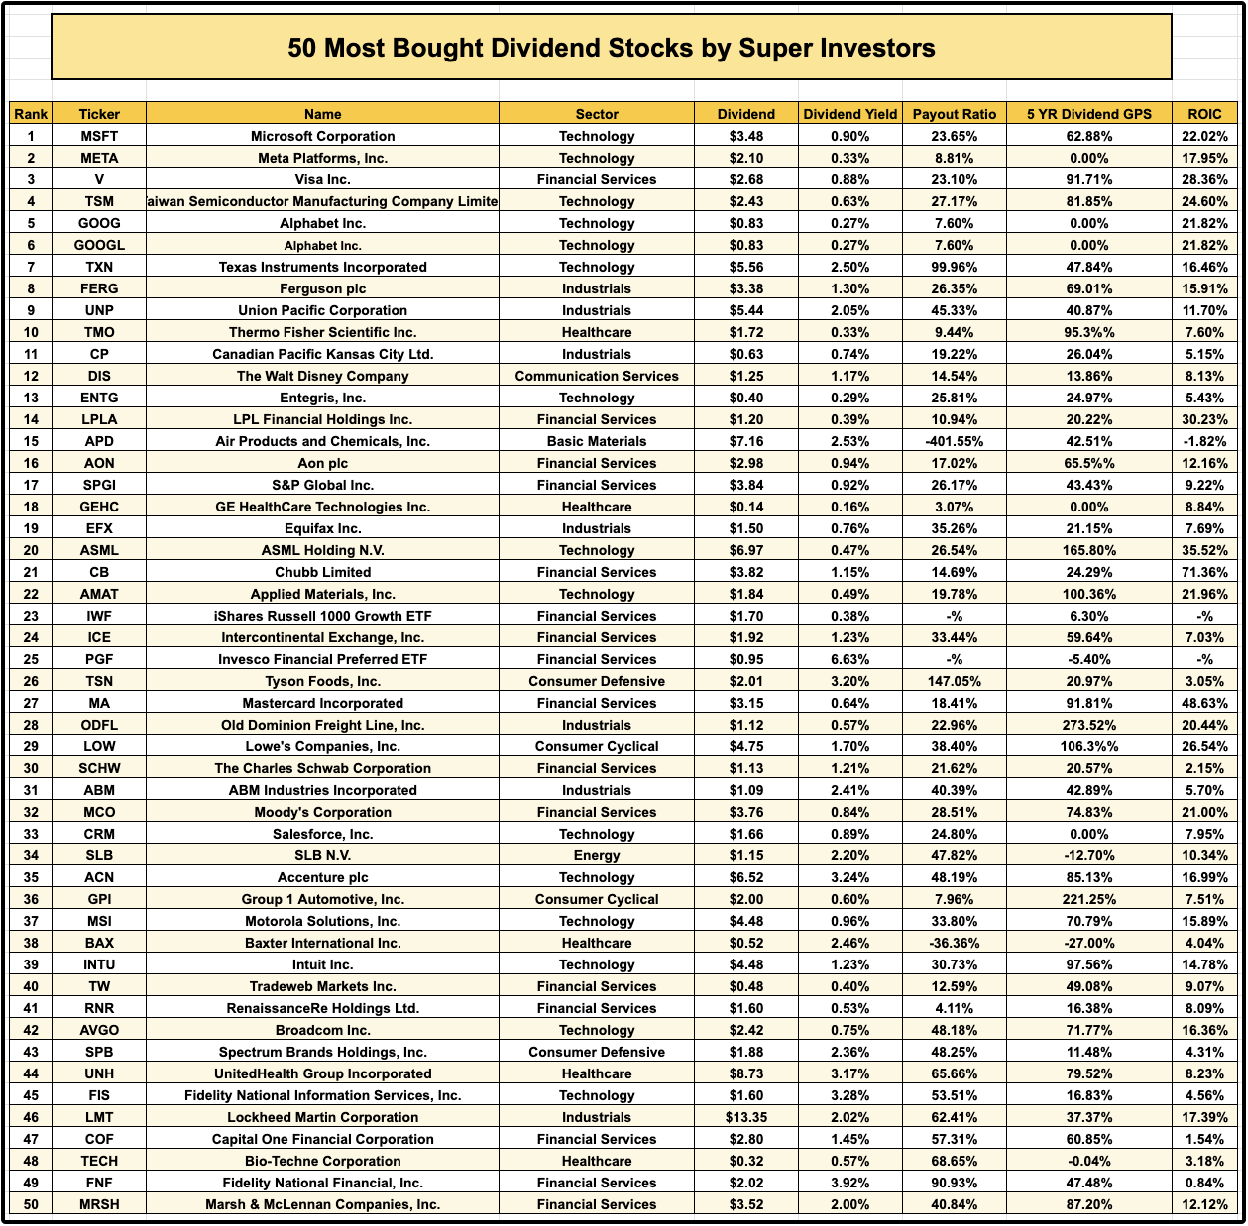
You can download this sheet here.
📚 Follow The Smart Money
I would never recommend copying any other investors’ trades.
Everyone has different risk profiles, goals, and time horizons.
However, I’m a big believer in stealing ideas.
And with the Dividendology Database, you can easily track valuation ranges that Super Investors find attractive for certain stocks.
Texas Instruments is a great example.
Texas Instruments was:
The 7th most frequently bought stock in Q4 2025
The 12th most frequently bought stock in Q2 2025
The 6th most frequently bought stock in Q1 2025
However, it didn’t make the list in Q3.
This information becomes quite interesting when we look at the price movement of TXN over the duration of 2025.
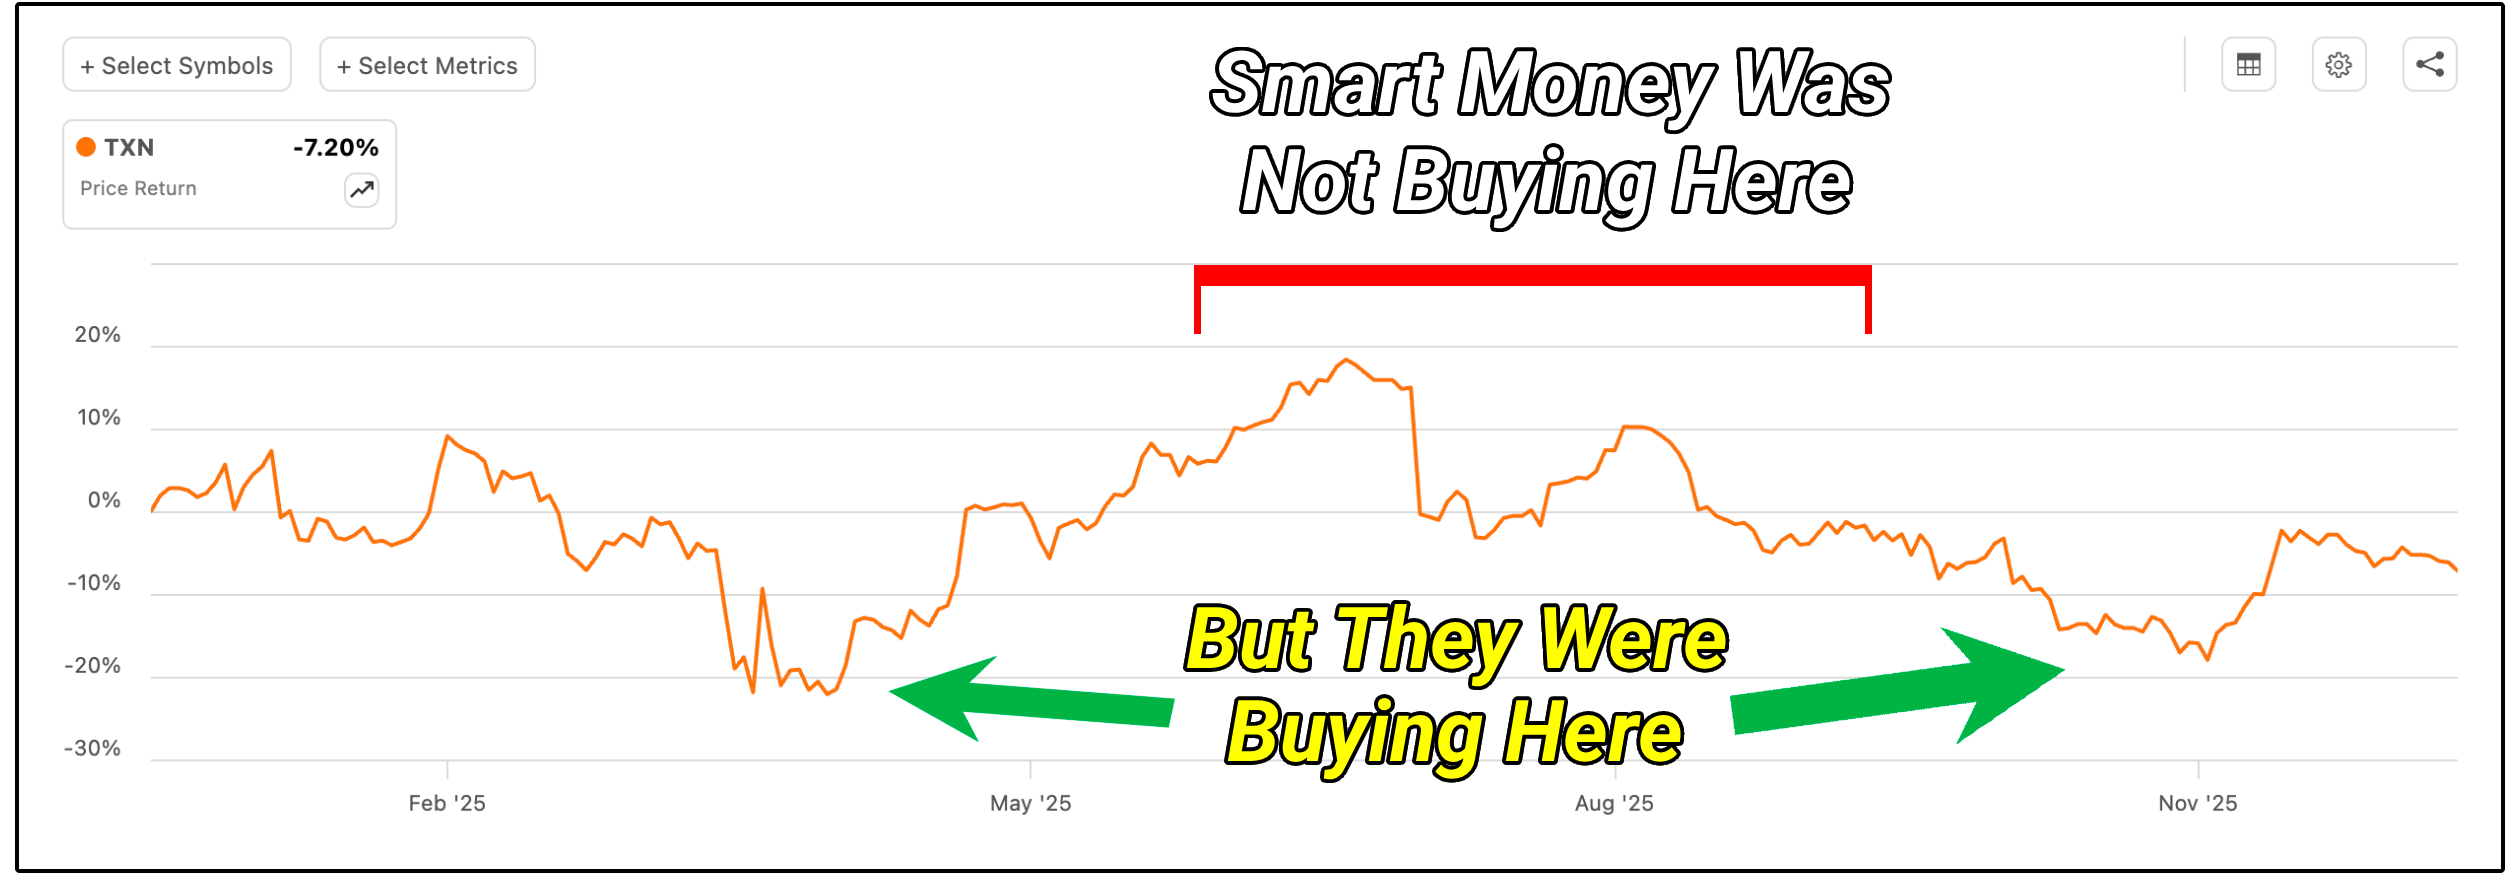
Super Investors was heavily adding TXN in the $150 to $170 range, and then backed off as it climbed above $200.
Ironically enough, this was the same sentiment I expressed around TXN over the last year.
I covered TXN in my monthly list of undervalued dividend stocks in October, and the stock has climbed well over 20% in just the last 5 months since.
TXN has been a very misunderstood and out of favor business over the last 3 years, but sentiment has shifted.
They serve a wide variety of customers, but operate in 2 main business segments:
Analog – chips that convert real-world signals (like sound, temperature, or pressure) into digital data. This is TXN’s largest and most profitable segment, representing roughly three-quarters of revenue.
Embedded Processing – microcontrollers and processors that provide intelligence and control for systems in industries such as automotive and industrial applications.
The stock was out of favor for primarily one reason:
By shifting production from 200mm to 300mm wafer fabs, TXN radically increased capex spending in the short term, but now expects to structurally reduce chip costs and lift gross margins over time.
Texas Instruments is now nearing the end of a 6-year, capex-heavy reinvestment cycle to build out 300mm chip capacity.
Management says this will:
Cut chip costs by ~40%
Boost gross margins
Set up long-term FCF growth starting in 2026+

This investment is nearing completion (about 75% of the way through)-
With free cash flow per share projected to rebound to $8–$9 in 2026 on the low end, and as high as $11–$12 if revenue grows faster.

For reference, the previous high of FCF per share was in 2021 when they generated $6.82 per share.
The market has started to recognize the value.
🗂️ Use The Database!
By using the Dividendology Super Investor Database, we were essentially able to fund the valuation range for TXN that Super Investors found attractive.

As you go through the database, look for trends that may answer questions, like:
What software stocks were previously being heavily added, but no longer are (potentially due to AI)?
What tech stocks do Super Investors continue to add to in light of declining valuations?
Which sectors are seeing capital rotation?
Which stocks can we identify clear valuation ranges for?
The real advantage truly isn’t just analysing the recent quarters buys-
It’s in identifying the trends.
If you want to get access to the Dividendology Database, as well as all the features mentioned below, you can do so here:
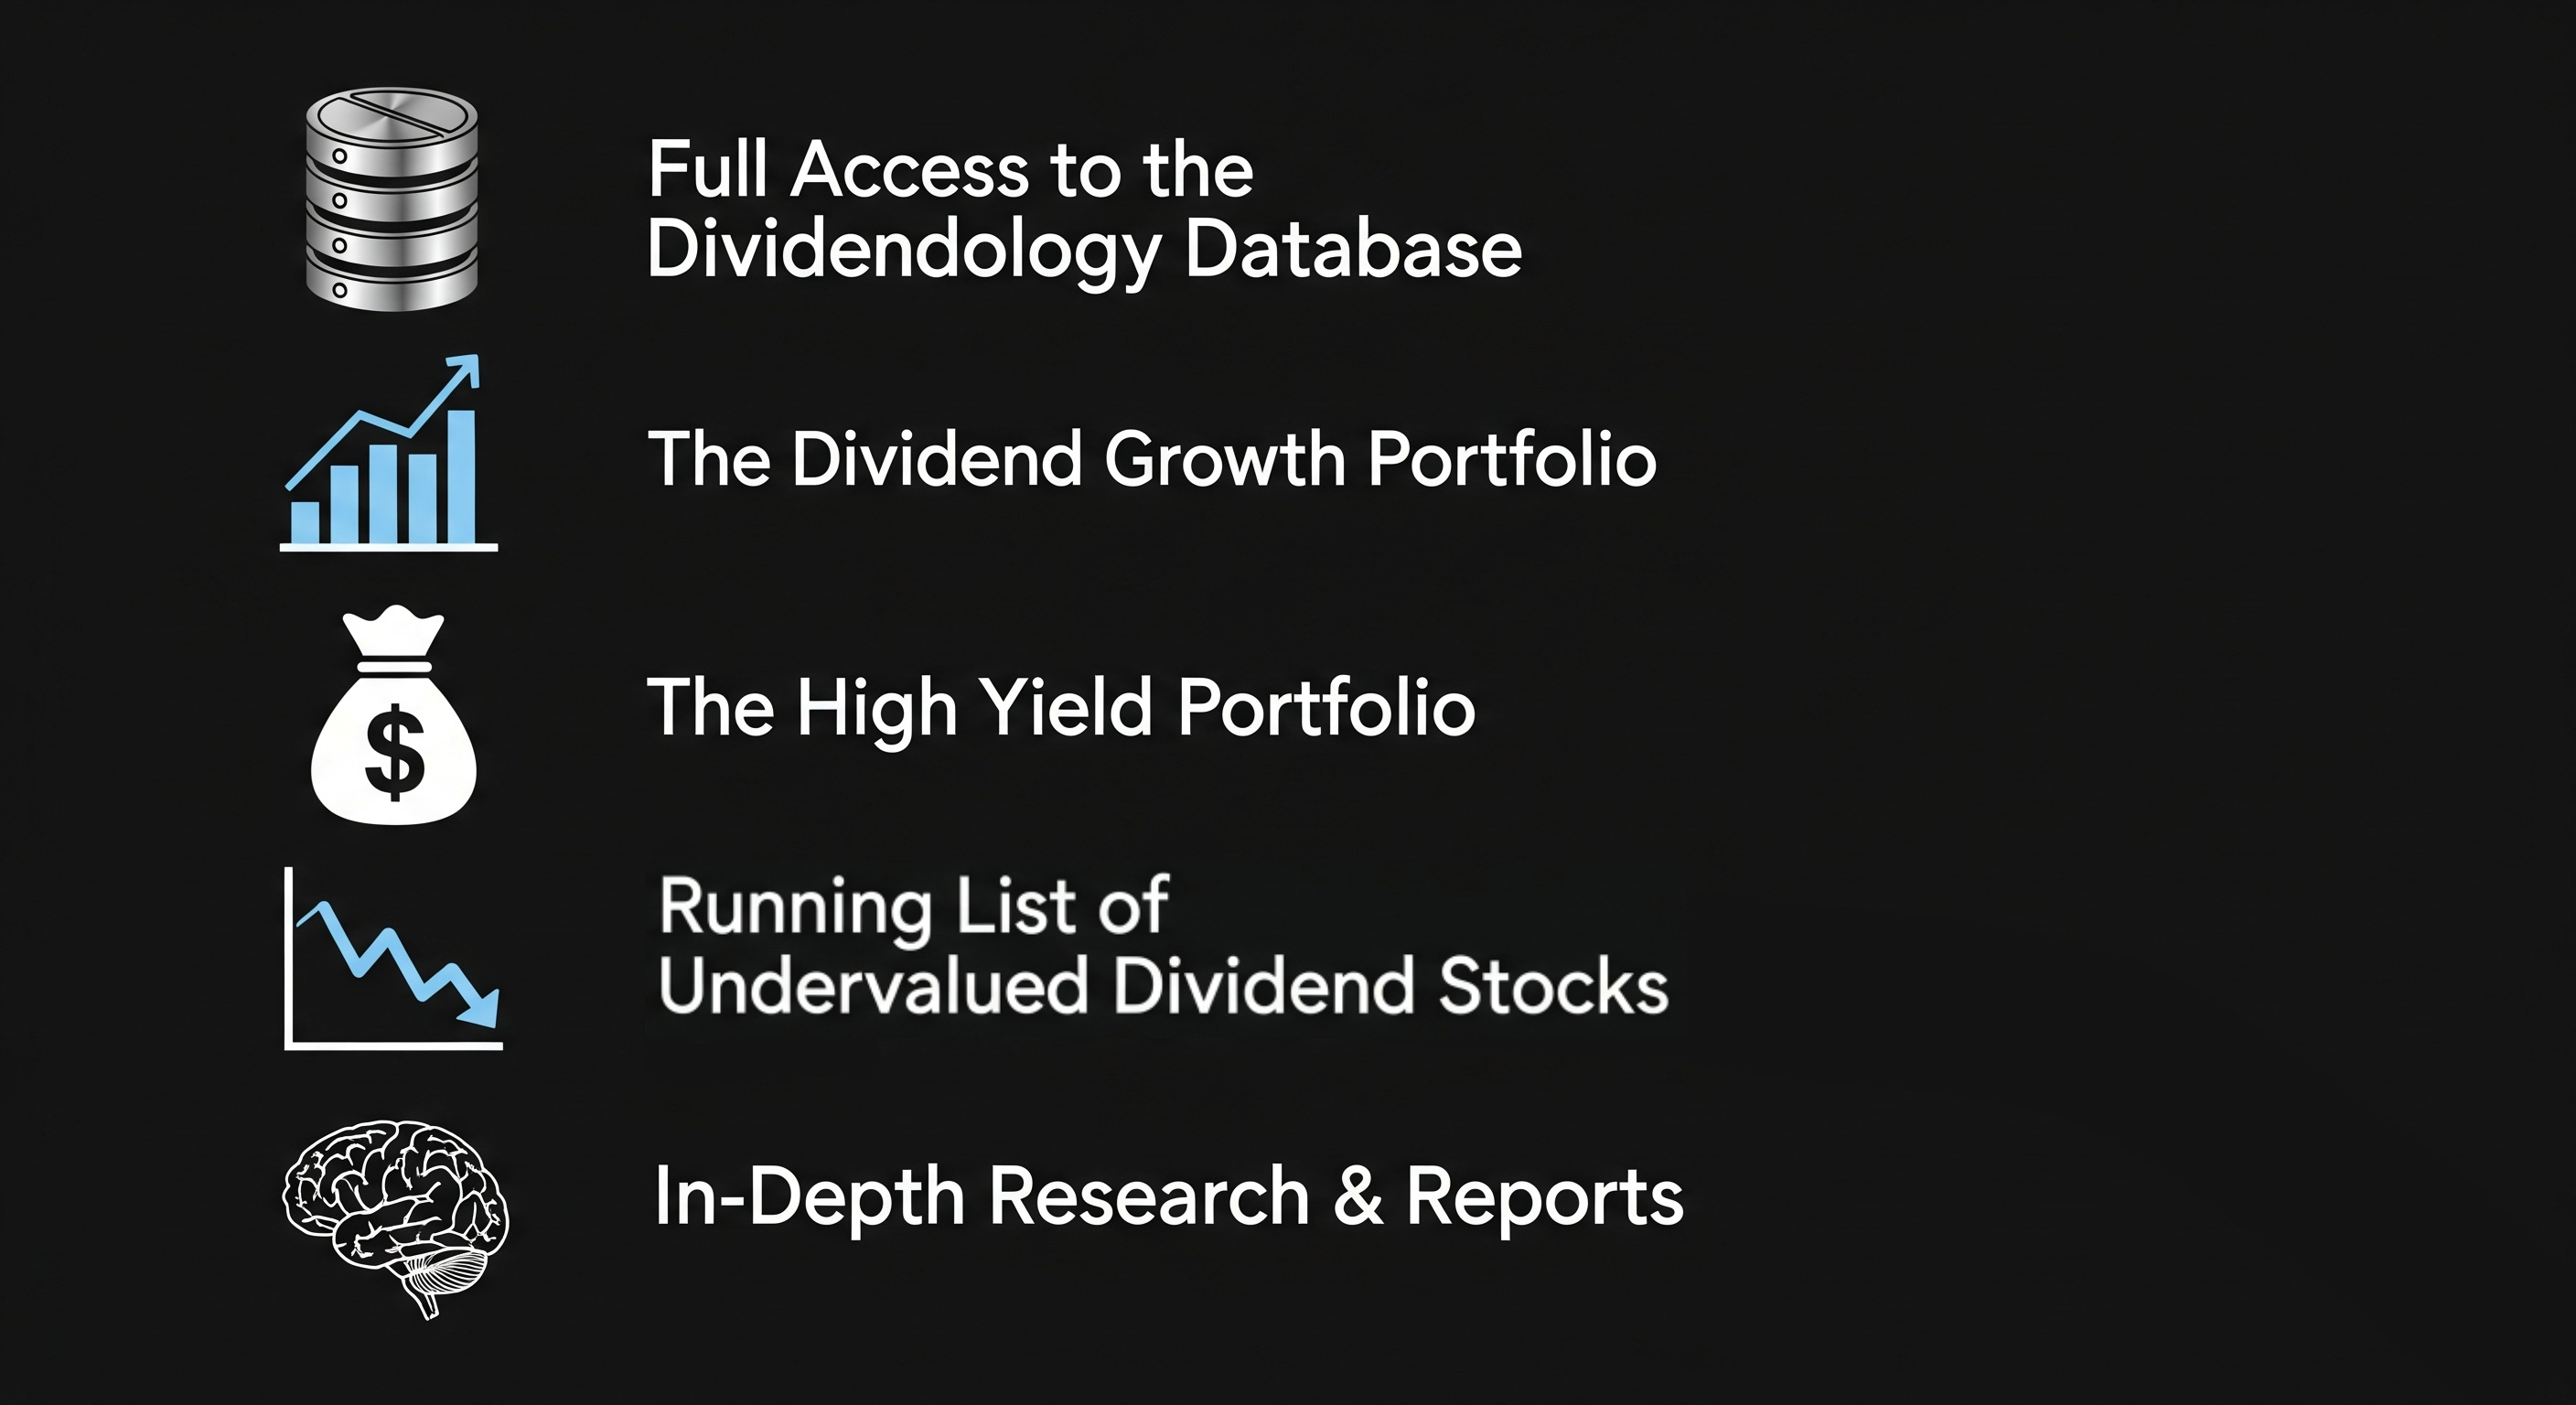
Check out these resources:
Tickerdata 🚀 (My automated spreadsheets and instant stock data for Google Sheets!)
Interactive Brokers 💰 (My favorite place to buy and sell stocks all around the world!)
Seeking Alpha 🔥 (Research stocks $30 off! + 7 day free trial)
HYSA 📊 (Get Access to the Best High Yield Savings Accounts!)