

The Billionaires are Buying. Are you Watching?

Every quarter, the world’s best investors quietly reveal exactly what they’re buying.
Most people never see it until it’s already too late.
Carbon Finance turns those filings into clean infographics you can read in five minutes, so you finally see where the money is going before the crowd catches on.
Over 50,000 investors already do. And it’s completely free, every Sunday.
Join them → Subscribe here now
Thanks to Carbon Finance for sponsoring.
🕵️ Stealing From Super Investors
Do you know what one of the biggest winners in my portfolio was a few years ago?
A stock many have never heard of.
Jefferies Financial.
I was up over 125% in just over a year, with a yield on cost of over 5.10%.
The reason I discovered this stock?
Stealing ideas from Super Investors.

Super Investors are investors with over $100M in assets under management.
Every 3 months, they are required by law to reveal all of the moves they’ve been making in their portfolio.
This most recent quarter, they made some shocking moves.
🔍 Dividendology Database
One of the best features of Dividendology.com?
The Dividendology Database
While we primarily use this database for alternative income asset classes, like:
REITs
BDCs
Option Income ETFs
One of the things we also track in this database is the buying history of dividend stocks for Super Investors.
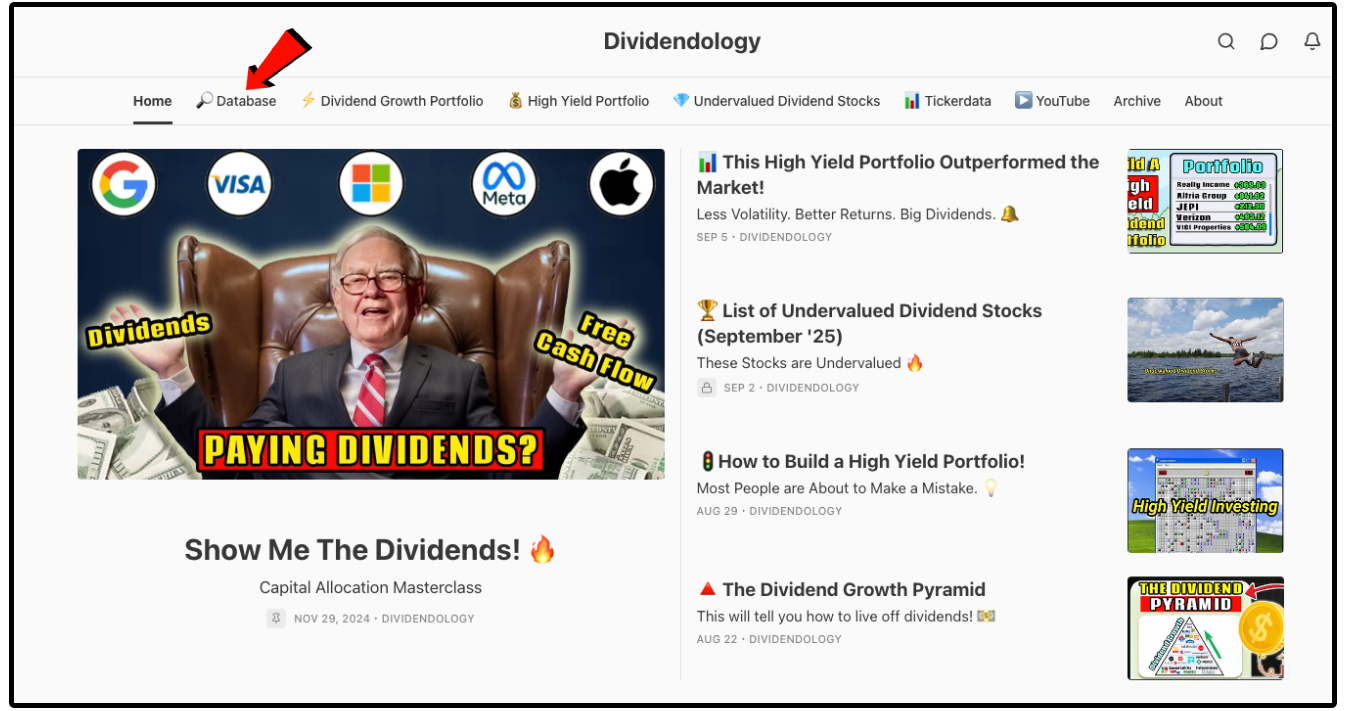
To my knowledge, this is the only resource for tracking these types of purchases on the internet.
While each quarter gives us insight into where capital is moving-
More importantly, it reveals the underlying trends of where the smart money has been moving over longer periods of time.
This is where the real insights come from.
Texas Instruments is the perfect example, and this quarter the story finally has an ending.
Texas Instruments was:
The 6th most frequently bought stock in Q1 2025
The 12th most frequently bought stock in Q2 2025
The 7th most frequently bought stock in Q4 2025
Super Investors were accumulating it quietly while the financial media was busy talking about the MAG7 stocks.
Then they stopped… After the stock had an incredible run.
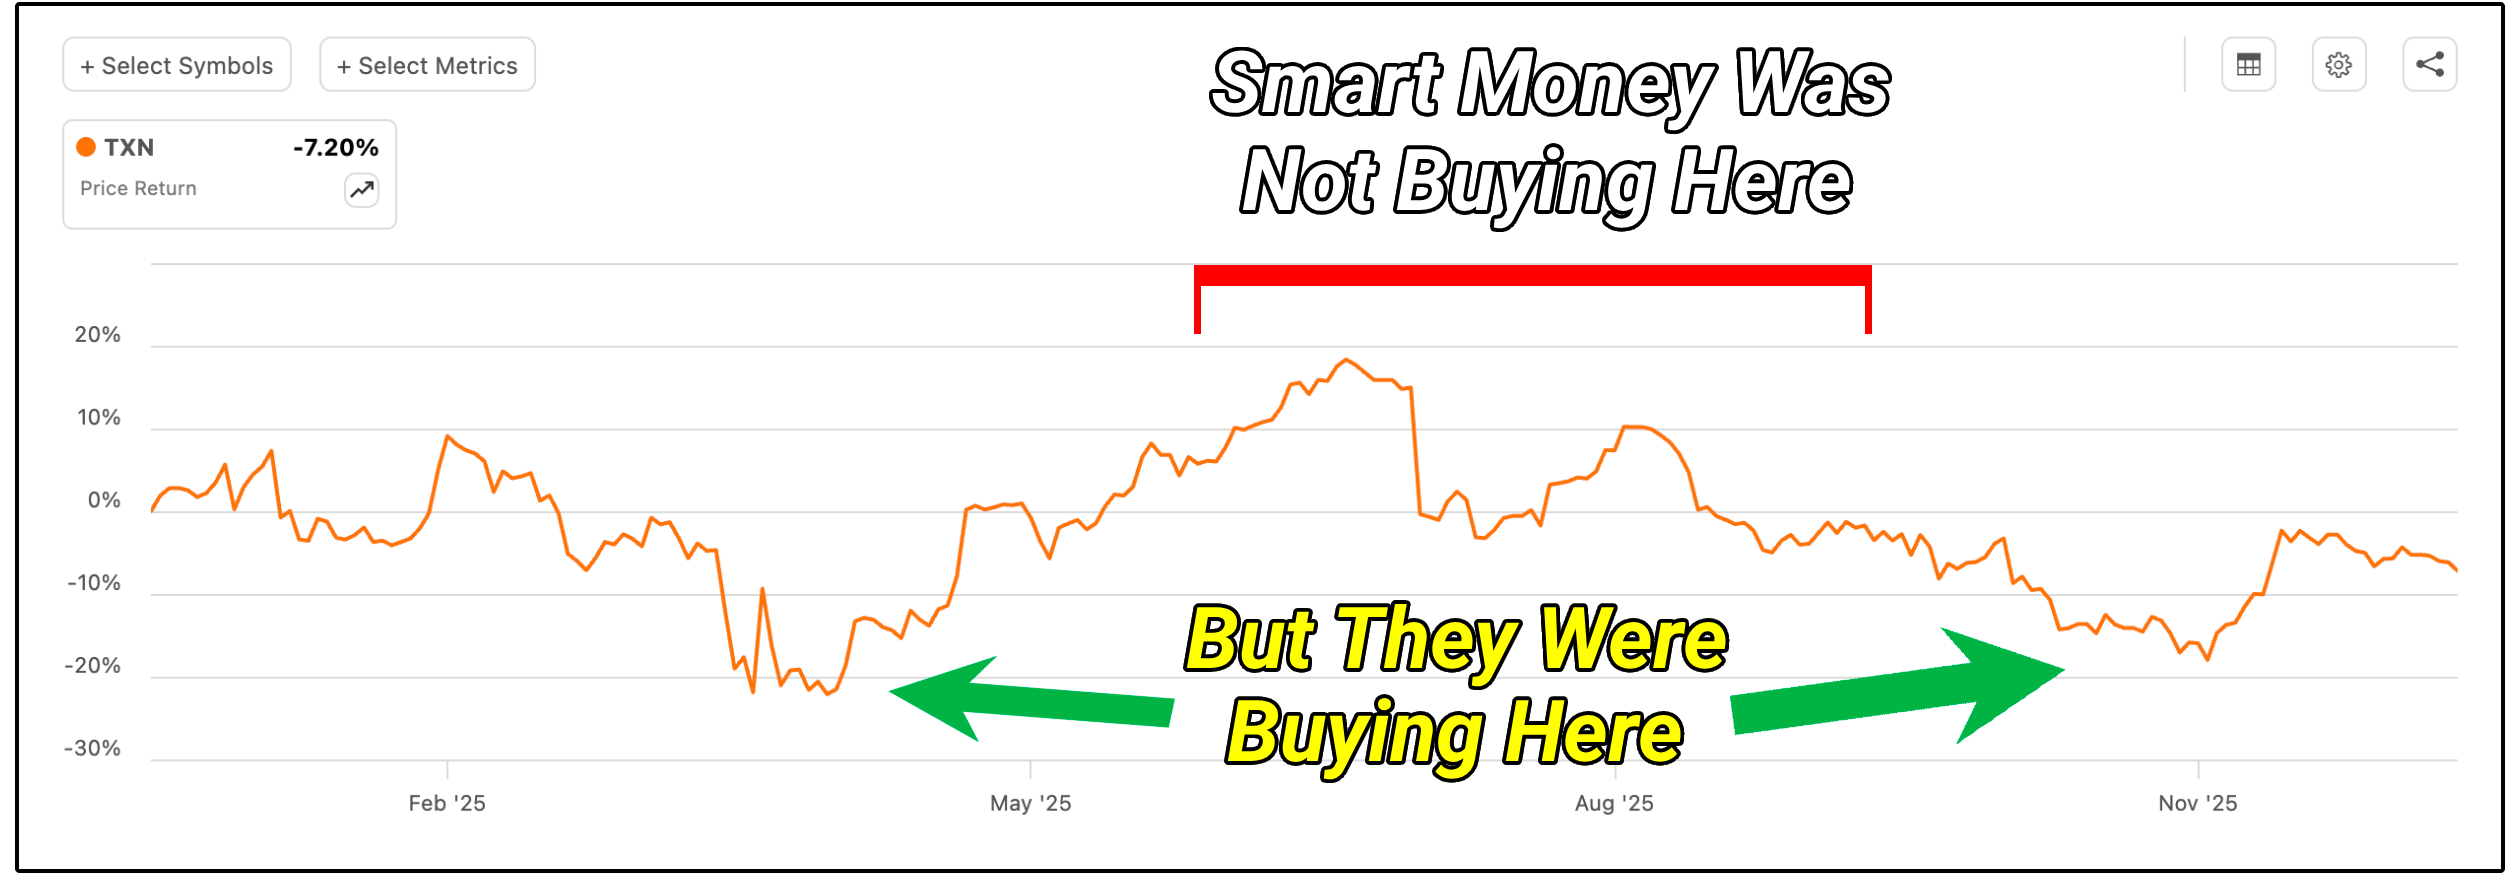
TXN has now failed to make the list for two consecutive quarters.
And look at what the stock did after they walked away.
TXN ripped over 53% in the second quarter alone, peaking at $332.
They accumulated it between roughly $150 and $200.
📉 Buying What Everyone Hates
In 1939, with Europe collapsing into war, a 26 year old named John Templeton did something that looked insane.
He borrowed money.
Then he bought 100 shares of every single stock on the U.S. exchanges trading below one dollar.
104 companies, most of which the market thought were headed for bankruptcy.
Four years later, that basket was up roughly 400%.
He went on to run the Templeton Growth Fund from 1954 to 1992, compounding at 14.5% annually versus 11.6% for the S&P 500.
A $10,000 investment became roughly $2 million.

He believed in buying during peak pessimism.
Keep that in mind as you read this quarter’s data…
Because this is exactly what Super Investors did in the recent quarter.
💰 Super Investors Top 10 Buys
Before we dive into the trends in where money is moving, let’s review the top purchases.
These were the top 10 most bought dividend stocks by Super Investors in the most recent quarter:
MSFT — Microsoft 🖥️
META — Meta Platforms 📱
V — Visa 💳
SPGI — S&P Global 📈
GOOG — Alphabet 🔎
DIS — The Walt Disney Company 🏰
COF — Capital One Financial 🏦
TMO — Thermo Fisher Scientific 🔬
DHR — Danaher 🧪
CMCSA — Comcast 📺
Below is the full list of the 50 Most Bought Dividend Stocks by Super Investors:
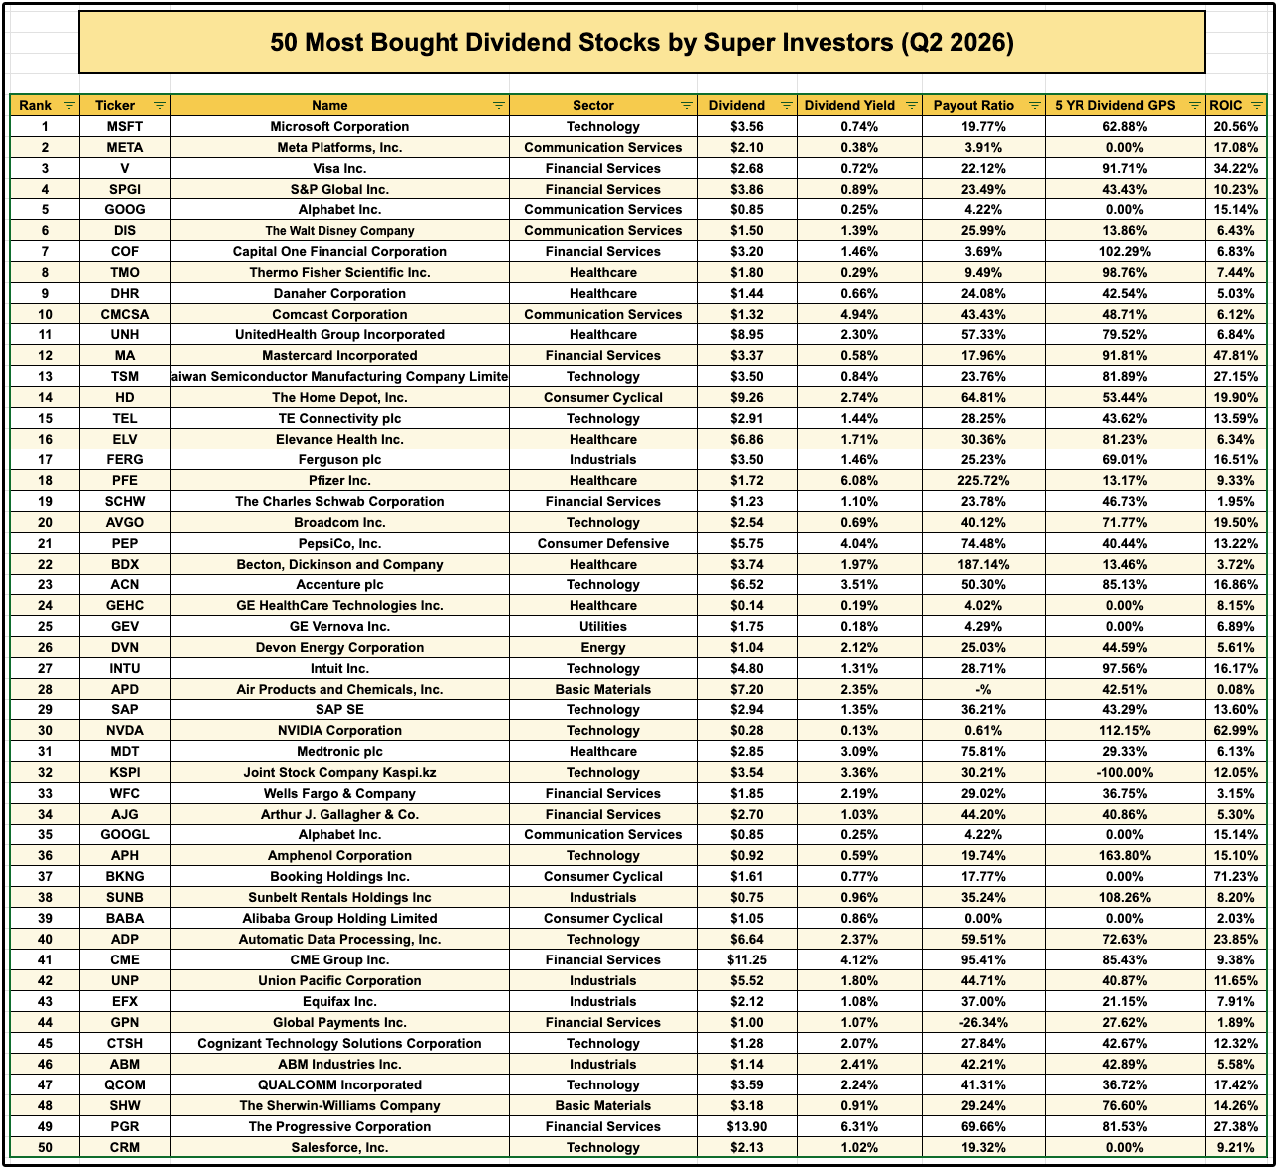
Members of Dividendology can access the entire database history at anytime on Dividendology.com.
Now, let’s look at the trends.
📊 Where the Money is Moving
Let’s review where capital is flowing right now.
The most widely bought sector by Super Investors this quarter was technology, with 14 of the top 50 names.
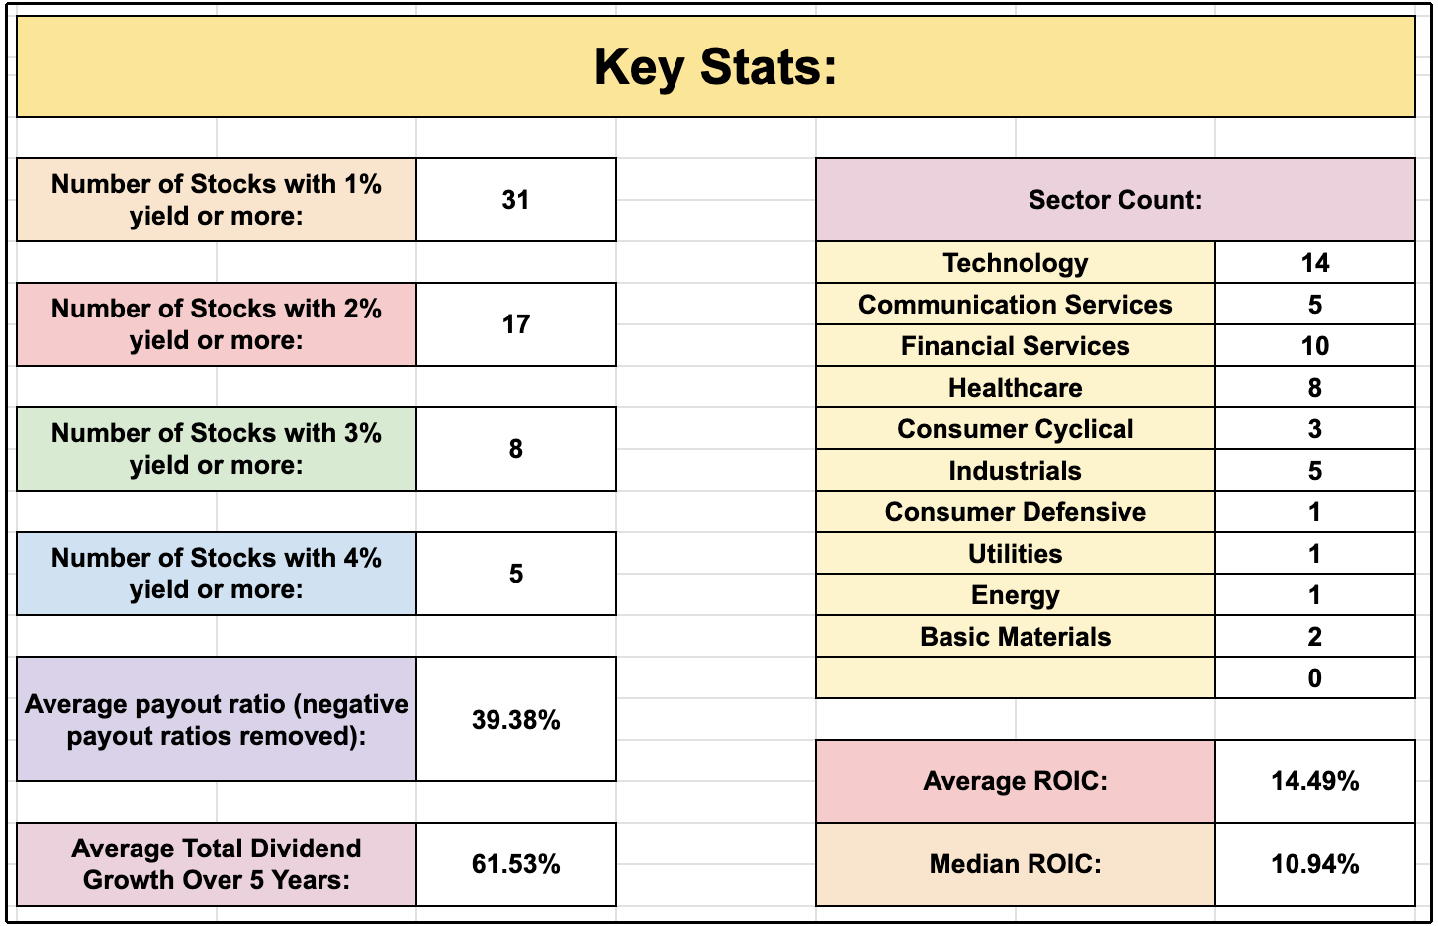
This breaks a two quarter streak of financials leading the list.
But the headline number is misleading.
Because this is not the technology you think it is.
Nvidia fell from the 7th most bought stock last quarter all the way down to 30th
ASML dropped off the list entirely
Apple, which was the 3rd most bought stock two years ago, is now nowhere to be found
Super Investors were not buying the popular AI winners that everyone has had on their watchlist over the last year.
Instead, they were buying the companies the market has deemed is at risk of disruption due to AI.
Look at this list:
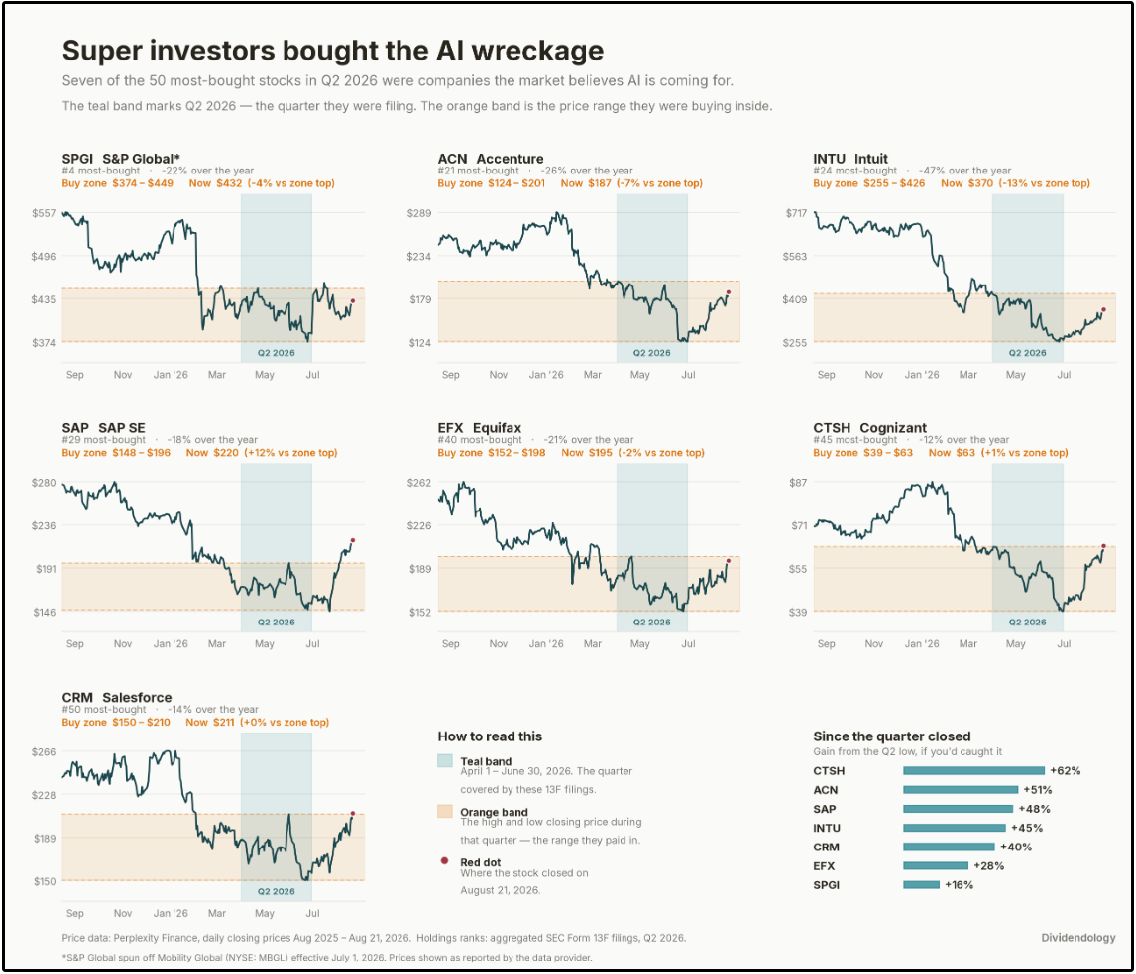
SPGI — S&P Global, the 4th most bought stock, down over 21% in the last year
ACN — Accenture, down over 26% in the last year (down 50% at one point)
INTU — Intuit, down nearly 47% in the last year
SAP — down over 18%
EFX — Equifax, down over 20%
CTSH — Cognizant, down nearly 12%
CRM — Salesforce, down over 14% (down 39% at one point)
All of these are companies in software, IT services, and financial data.
This is certainly not a one quarter fluke either.
I went back and looked at the database and noticed an interesting trend.
The amount of these “AI victim” stocks on the top 50 list has climbed for four straight quarters now:
Q2 2025: 3 names
Q3 2025: 6 names
Q4 2025: 7 names
Q1 2026: 9 names
Q2 2026: 9 names
Three of them were bought at the highest ranking they have ever held in this database.
S&P Global at 4th place, when its previous best was 17th.
SAP at 29th.
Cognizant appearing for the very first time.
Every single one of these stocks has seen a major bounce back in their share price from their Q2 bottom.
You can see the time period Super Investors were adding these stocks highlighted in the blue below:
The most notable climb was Accenture.
We highlighted Accenture as a unique opportunity in late June, when the stock was trading at $127 a share.
We used a reverse DCF model to reveal the fact the market was pricing in -9.8% free cash flow growth over the next decade.
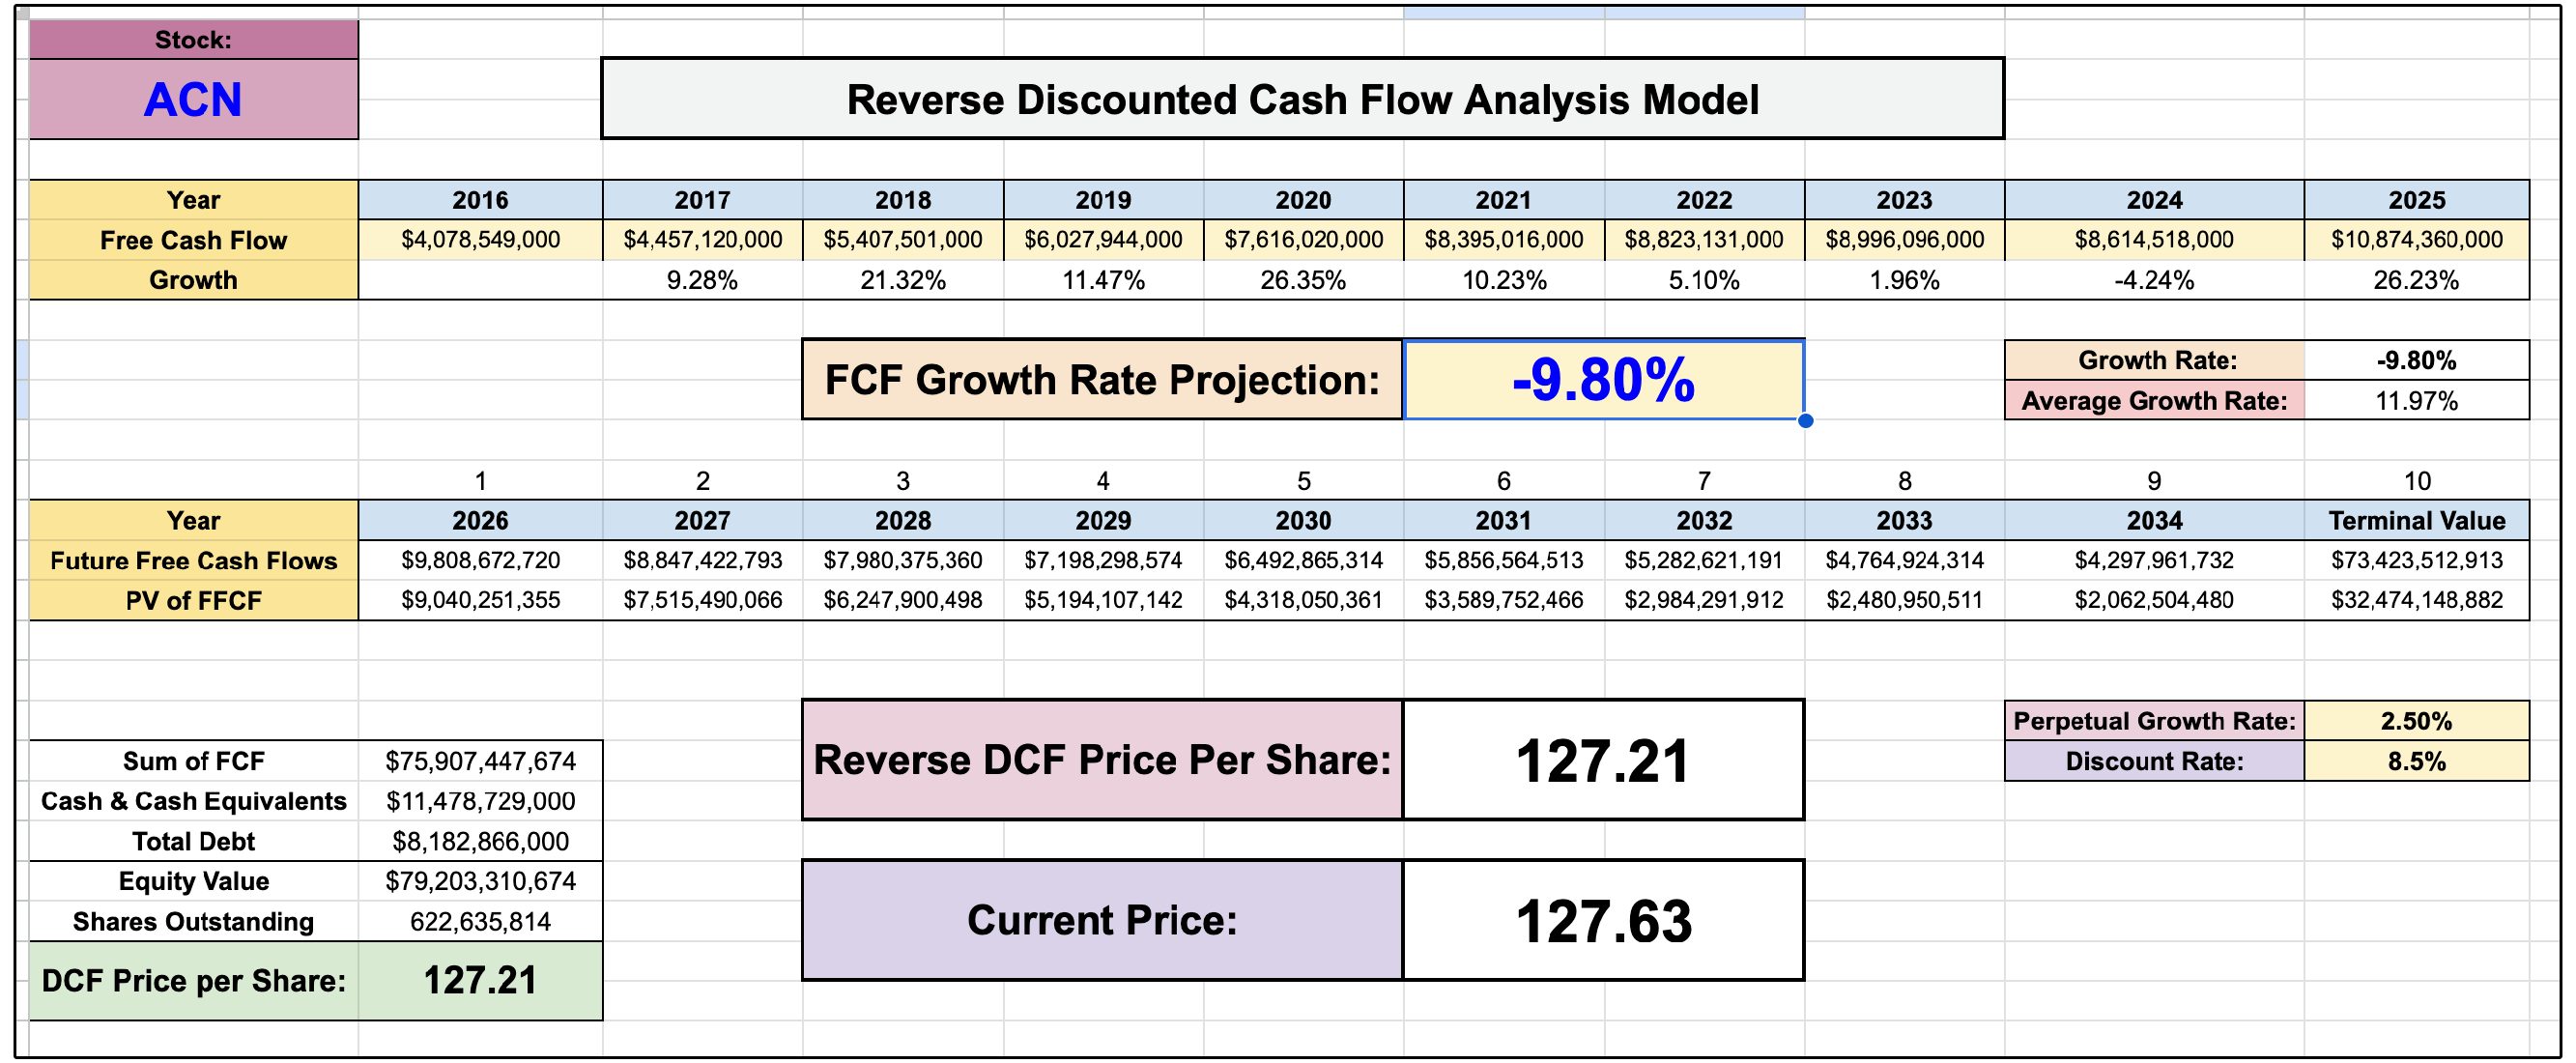
This was peak pessimism.
The stock is now up over 50% since.
Intuit is up over 41% since quarter end.
Salesforce is up over 34%.
ADP is up nearly 26%.
S&P Global is up over 12%.
Over that same stretch, the S&P 500 returned roughly 2% and the technology sector was actually down.
💻 Big Tech
There is also something happening at the very top of this list that has never happened before.
The top 3 most bought dividend stocks are not just identical, but in identical order, for the third consecutive quarter:
Microsoft
Meta Platforms
Visa
I went back through nine quarters of data and there is no other instance of the same three names holding the same three spots twice in a row, let alone three times.
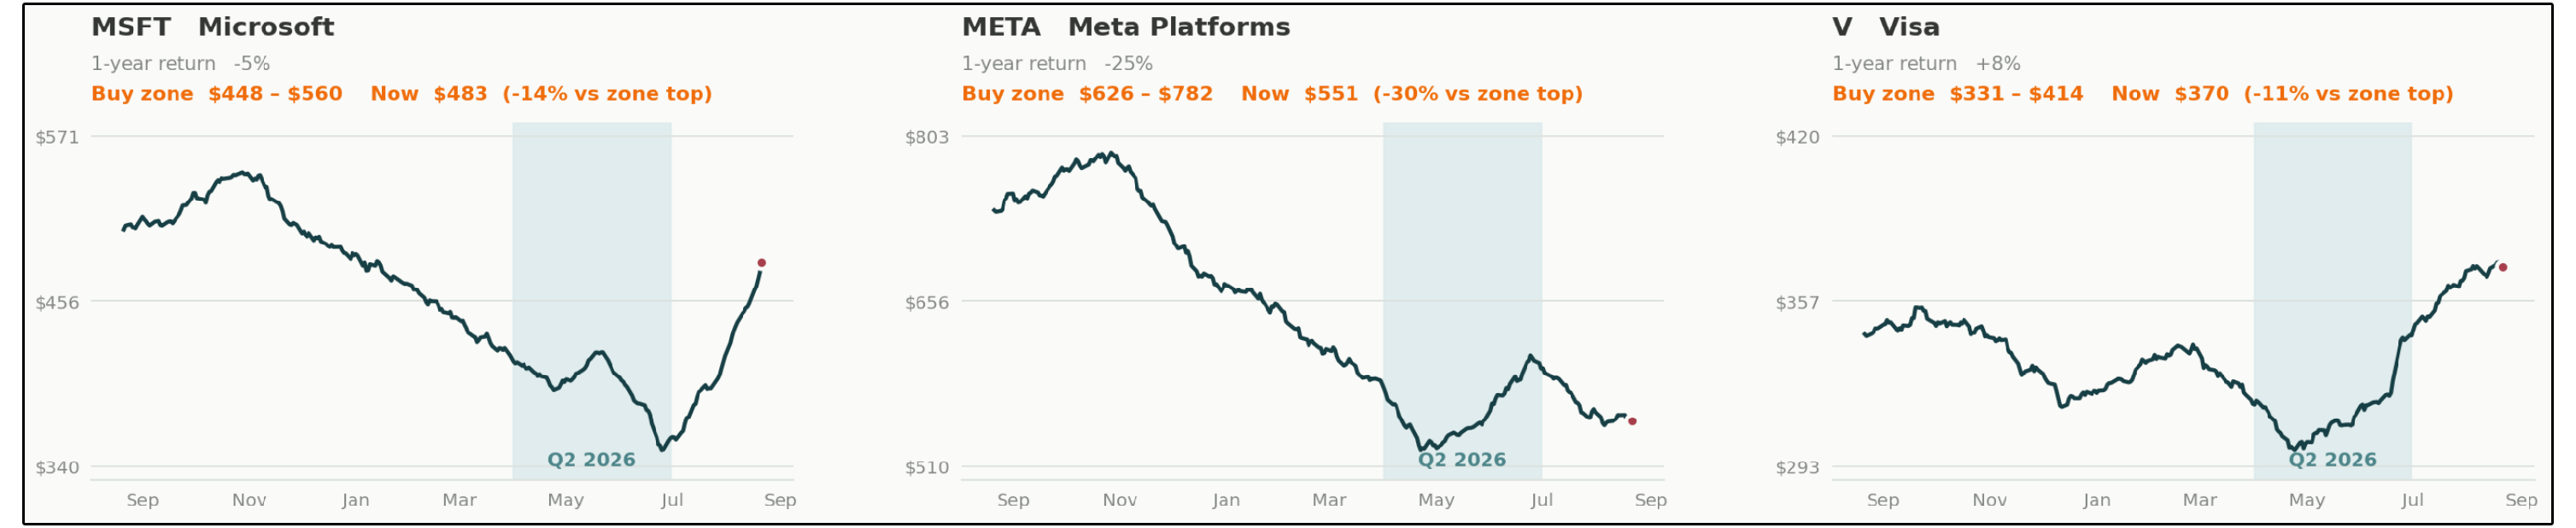
Super Investors were certainly averaging down, as Microsoft fell over 23% during the first quarter of this year while sitting in the number one spot.
The issue investors previously had was despite the fact MSFT had a massive backlog, most of that backlog was tied to OpenAI, creating customer concentration risk.
But Microsoft’s AI growth is now becoming more diversified.
Nearly 90% of its full-year cloud revenue came from customers outside frontier-model companies such as OpenAI.
Microsoft is now a much more diversified company.
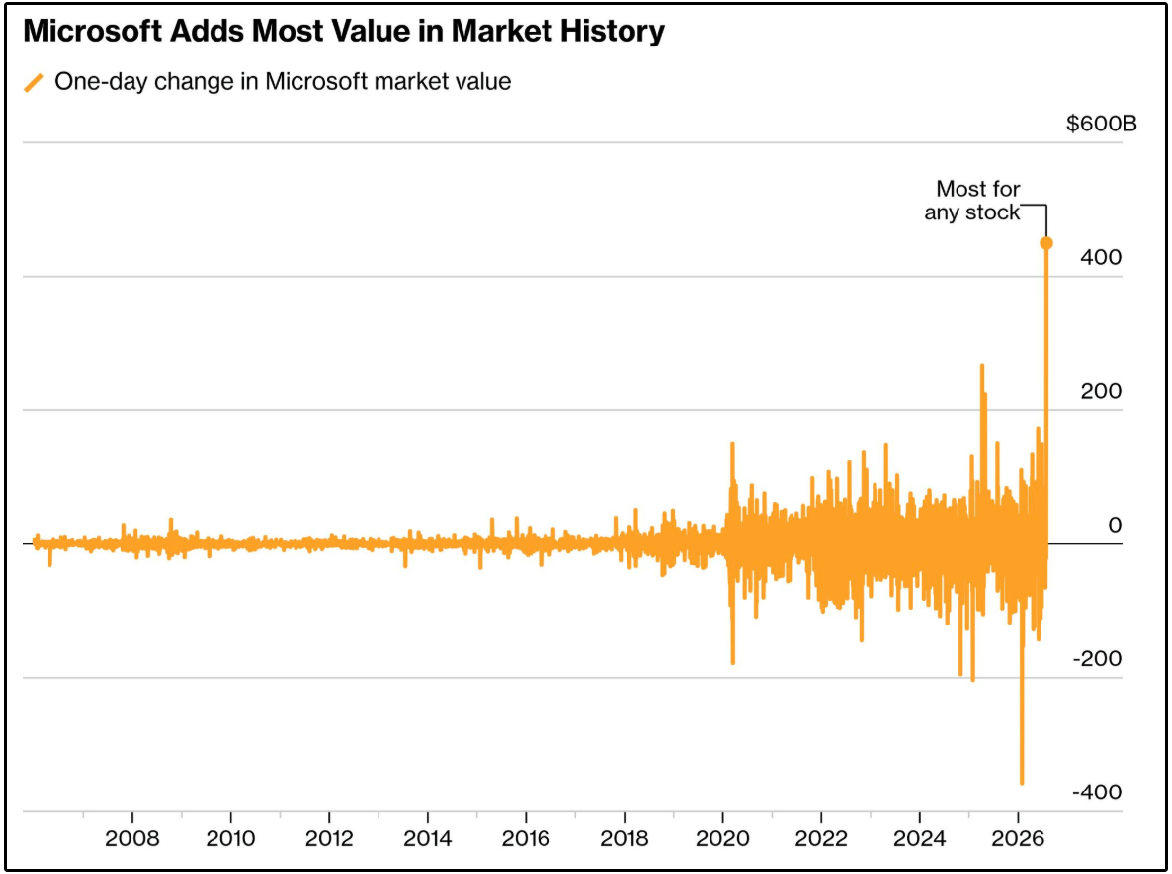
Microsoft is up nearly 29% since quarter end, the best move of anything in the top 10.
Visa is sitting at a fresh 52 week high.
Meanwhile, Meta is the one that hasn’t worked (yet).
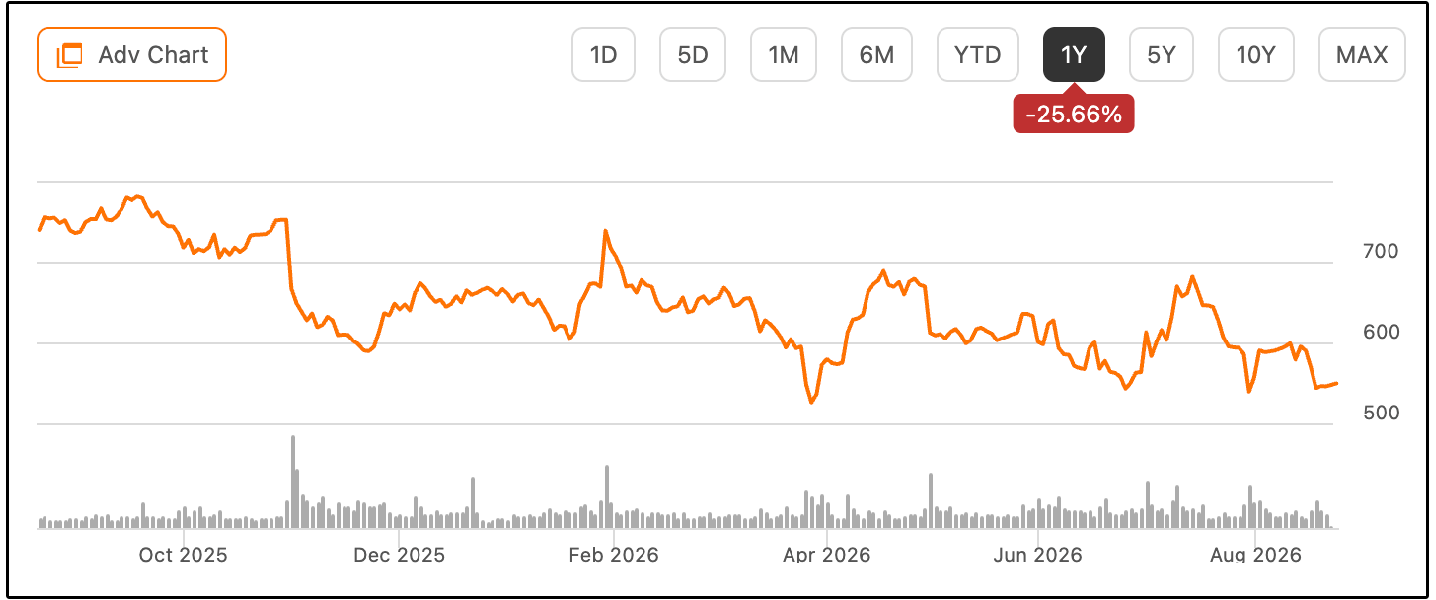
It’s down over 25% in the last year, nearly 30% off its high, and it has kept falling even after quarter end.
Also worth noting, there are only six companies that have appeared in all nine quarters of this database:
Microsoft, Meta, Visa, Alphabet, Taiwan Semiconductor, and UnitedHealth.
Only 27 of the 50 names carried over from last quarter.
🗂️ Use The Database!
By using the Dividendology Super Investor Database, we were able to identify the exact valuation range for TXN that Super Investors found attractive-
And we were able to watch what happened when they stopped buying.

As you go through the database, look for trends that may answer questions, like:
Which “AI victim” stocks are Super Investors quietly accumulating before the narrative turns?
Which stocks have appeared in every single quarter, and what does that tell us about durability?
When Super Investors abandon a top holding, is that a warning or an opportunity?
Which sectors are seeing capital rotation?
Which stocks can we identify clear valuation ranges for?
The real advantage truly isn’t just analyzing the recent quarters buys-
It’s in identifying the trends.
If you want to get access to the Dividendology Database, as well as all the features mentioned below, you can do so here:
Check out these resources:
Tickerdata 🚀 (My automated spreadsheets and instant stock data for Google Sheets!)
Interactive Brokers 💰 (My favorite place to buy and sell stocks all around the world!)
Seeking Alpha 🔥 (Research stocks $30 off! + 7 day free trial)
HYSA 📊 (Get Access to the Best High Yield Savings Accounts!)
Always interesting to see what the “greats” are buying. Can be a great source of ideas, but beware confirmation bias is a powerful drug.
They stopped buying Texas Instruments after it ripped 53%. That's the part of the 13F nobody copies.
https://paretoinvestor.substack.com/p/pareto-aggressive-compounders-and-dividend-machines-2026