
📉 The BDC Market is Bleeding!
Here are the Top BDC Opportunities Right Now 🔎

The BDC market has been in turmoil over the last year.
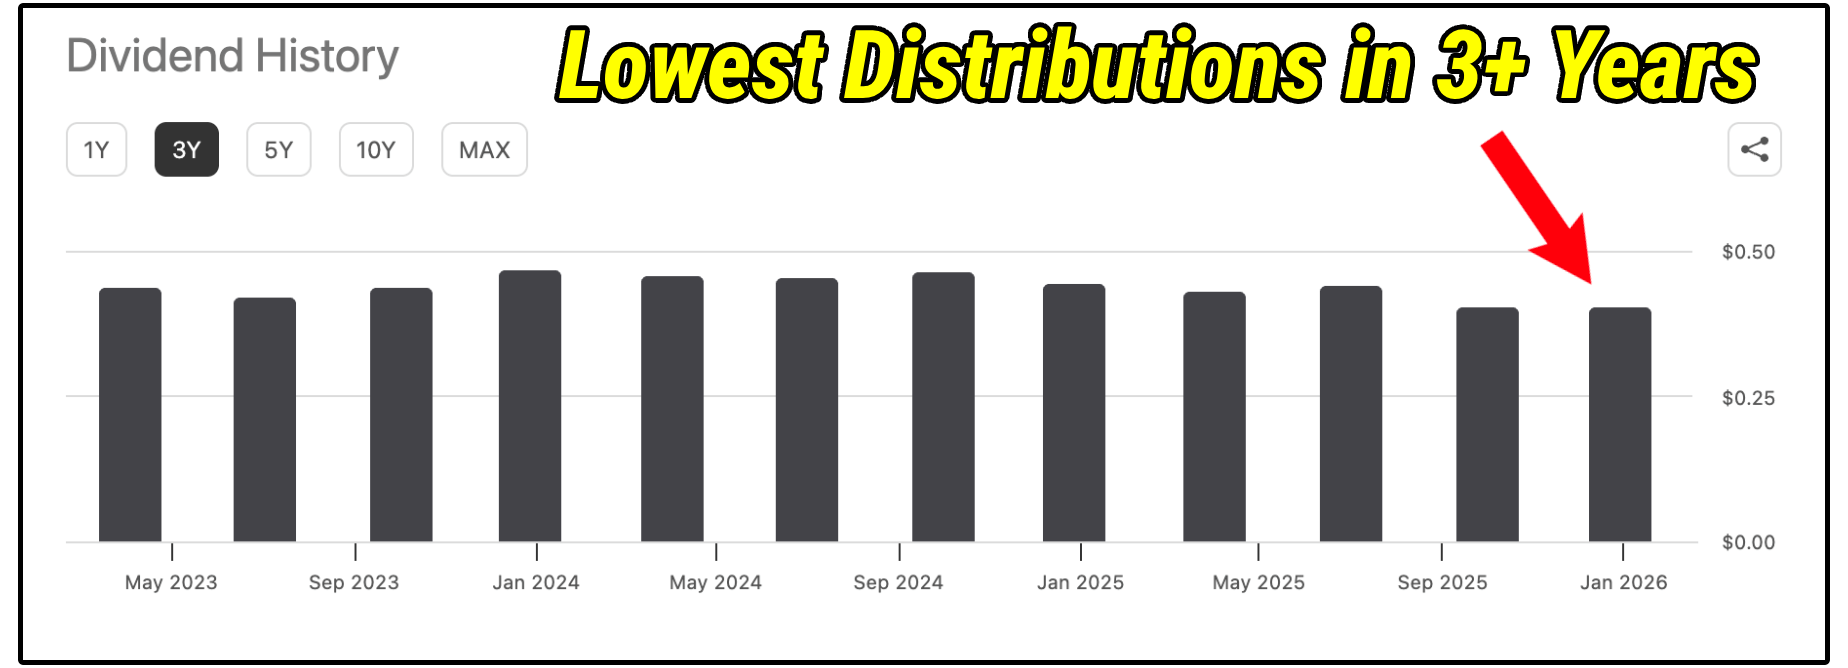
In fact, even the VanEck BDC Income ETF is down 23% in the last year!
Not only that, but their recent distributions were the lowest the ETF has paid since early 2022.
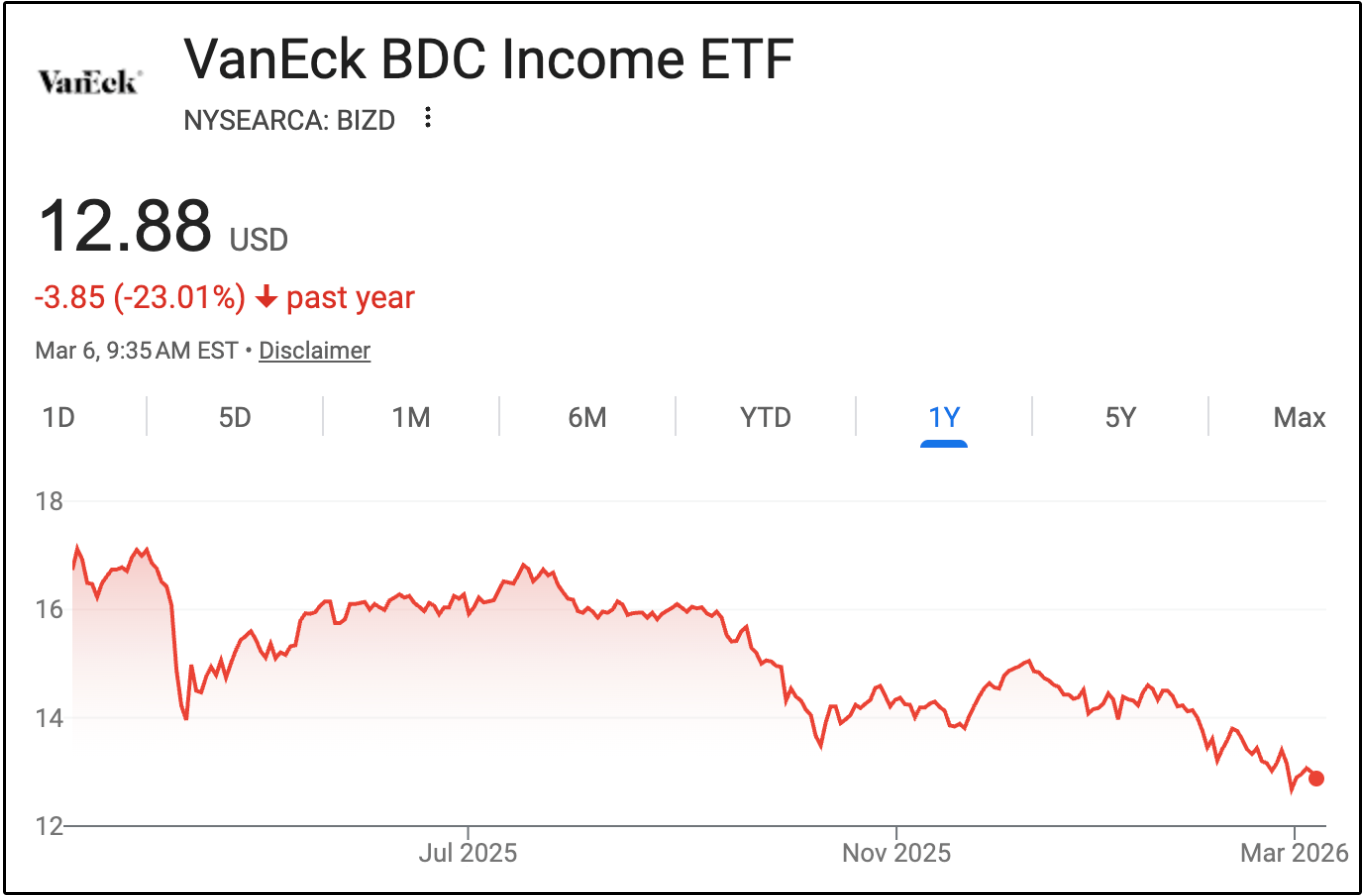
For an asset class designed to distribute large dividends, those numbers are obviously quite concerning.
But the story behind why this has happened will ultimately reveal the truth behind which BDCs now present high yield opportunities.
Many BDCs are now trading at large discounts to net asset value while still producing strong net investment income.
We need to find out:
Are BDCs becoming structurally riskier?
Are investors being handed one of the best entry points in years?
Which BDCs are currently the best opportunity for high yield dividends?
Let’s dive in.
Sponsor:
A Structured Approach to Inflation.
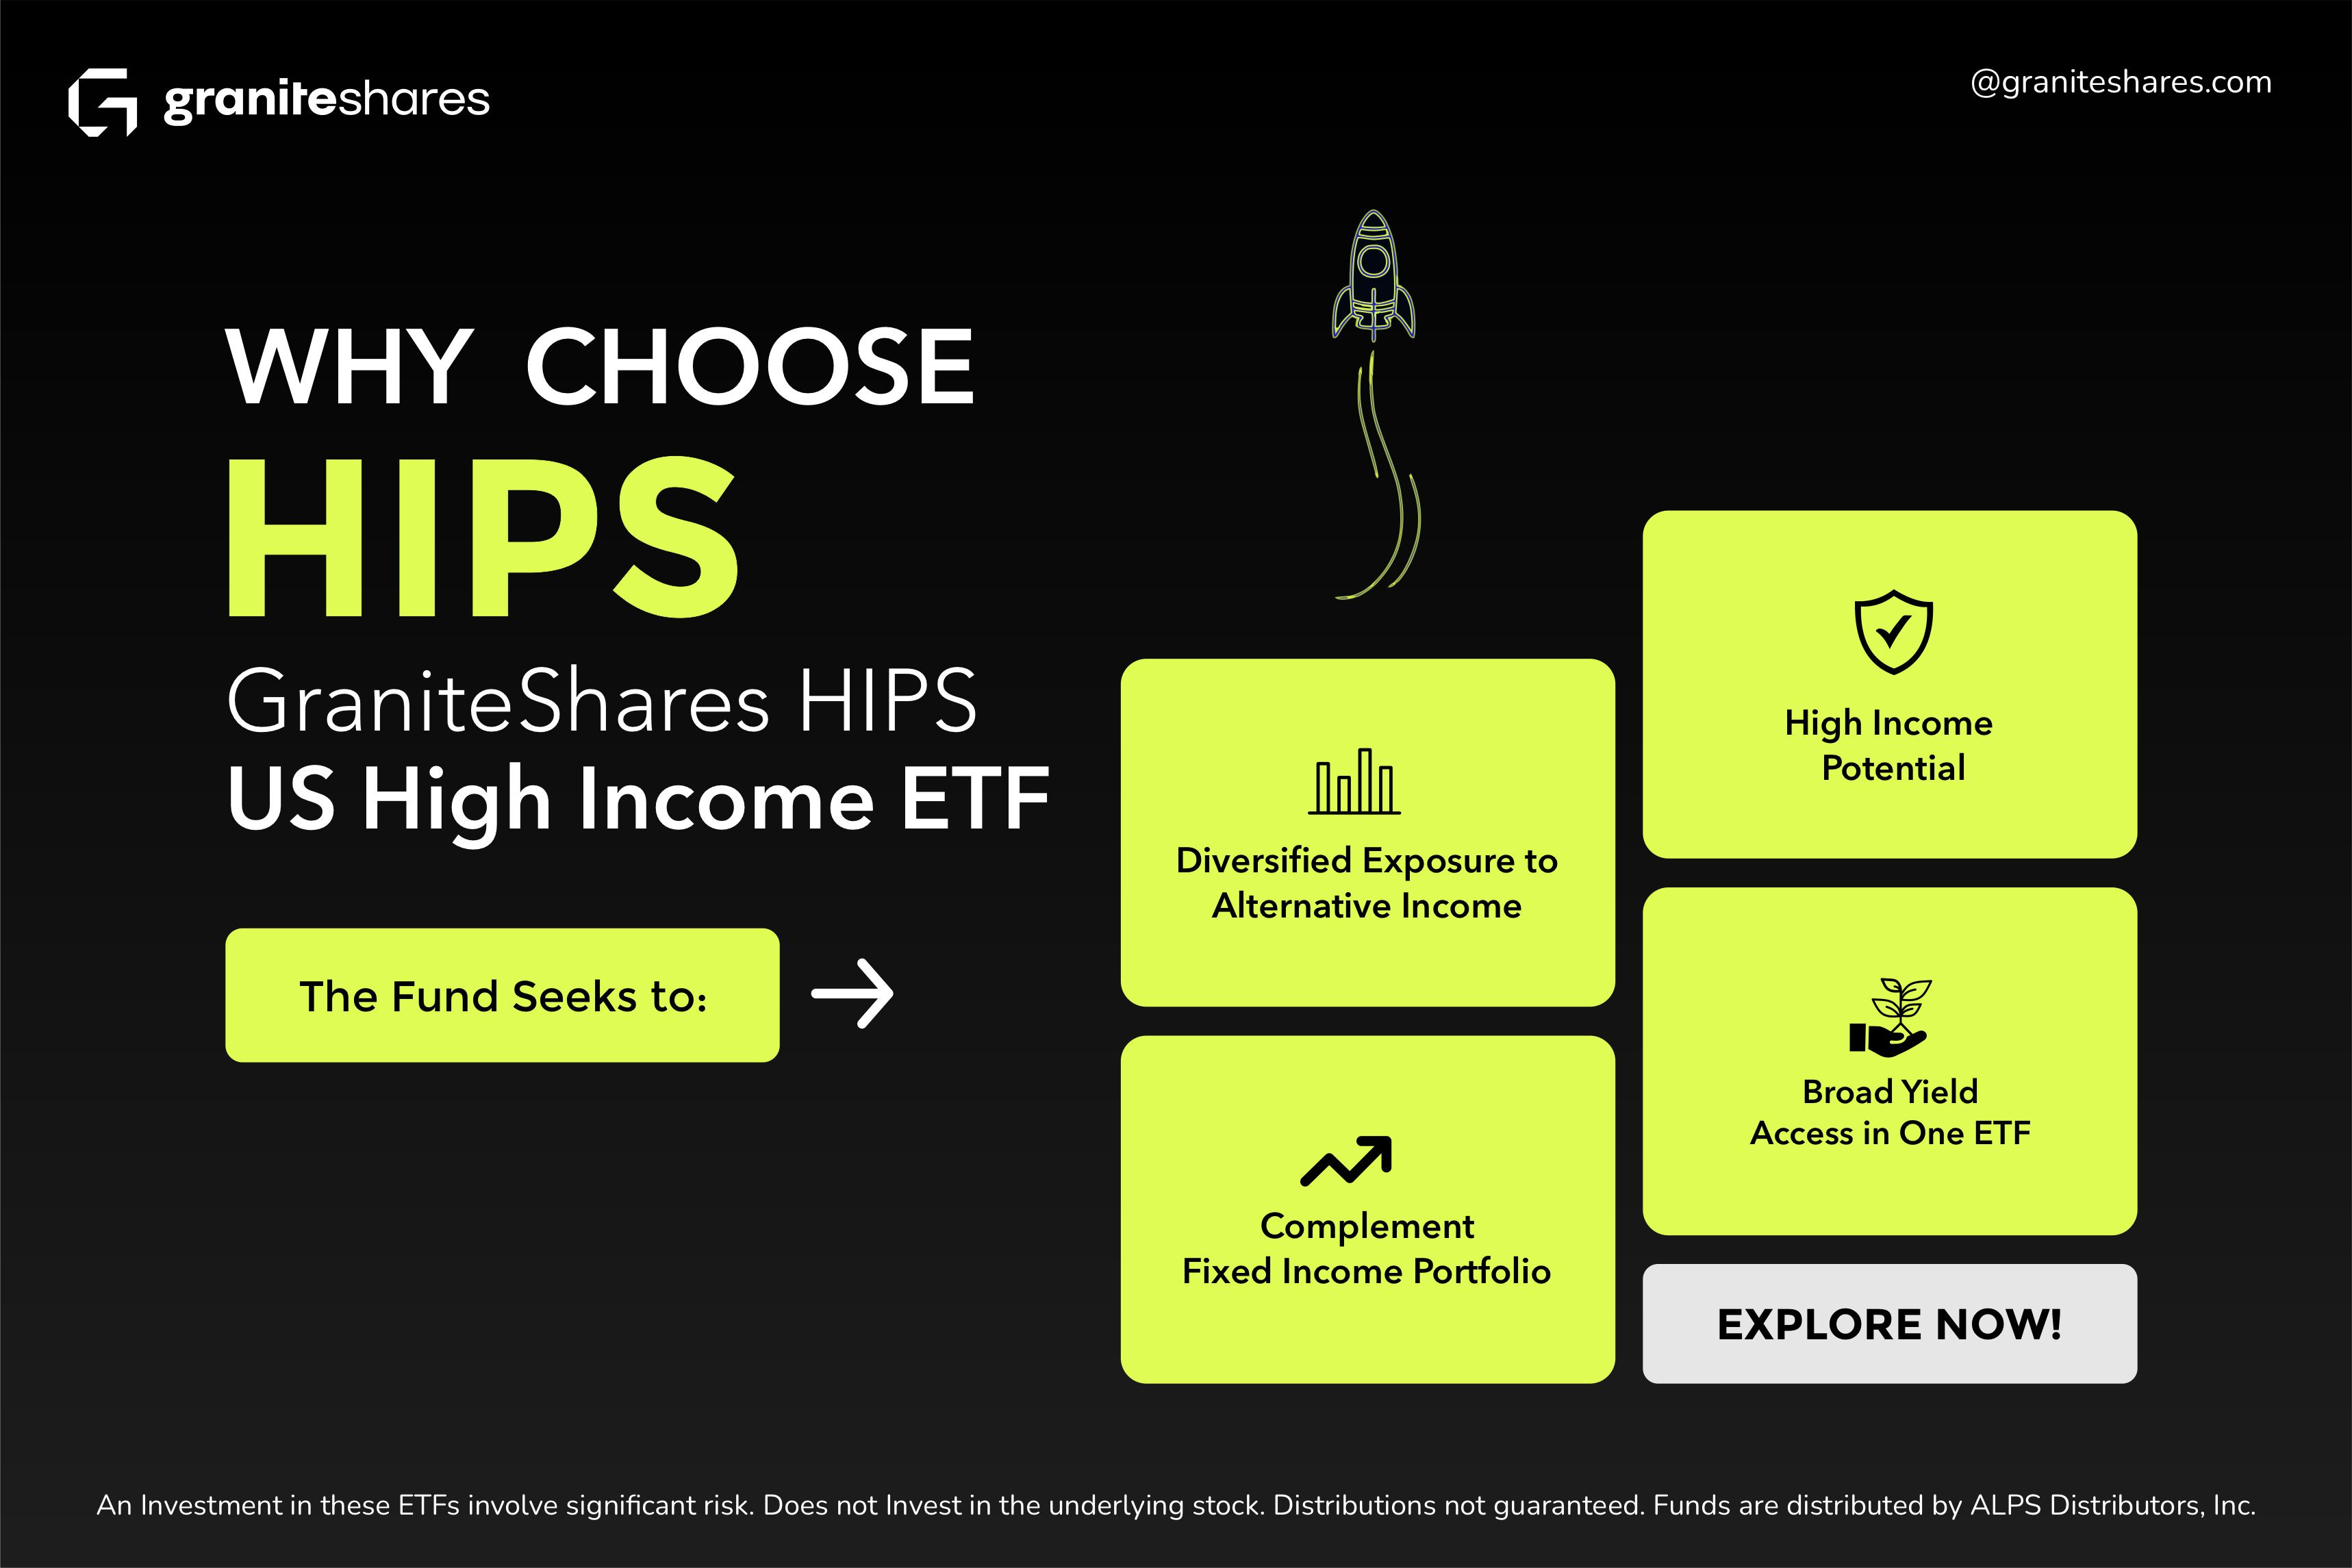
HIPS uses a diversified, rules-based strategy for inflation-sensitive markets.
It allocates across asset classes to help reduce reliance on any single inflation hedge.
Learn more below.
Disclosure
The fund does not invest in the underlying stock. Investment in these funds is not an investment in the underlying stock. These ETFs involve significant risk and are a short-term trading vehicle. Please go through the prospectus and risk information before investing. For important risk disclosures, learn more at https://graniteshares.com/institutional/us/en-us/
💰 Why BDCs?
For investors searching for high yield, the BDC landscape makes quite a bit of sense.
For example, members of Dividendology get access to the Dividendology BDC Database.
The average yields for the BDCs in the database are:
13.79% Base Yield
14.56% Total Yield
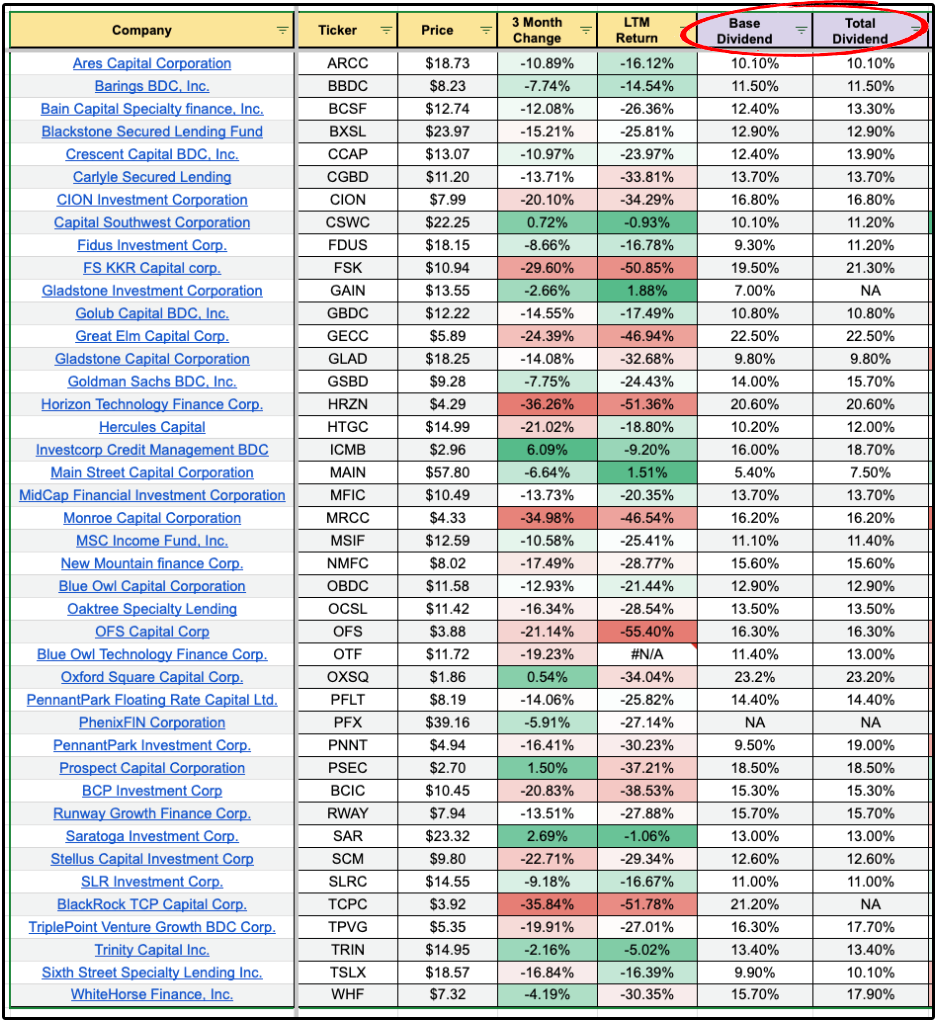
Remember, the total yield accounts for special dividends the BDC has paid out.
The base yield represents the yield without accounting for special dividends, which are not guaranteed moving forward.
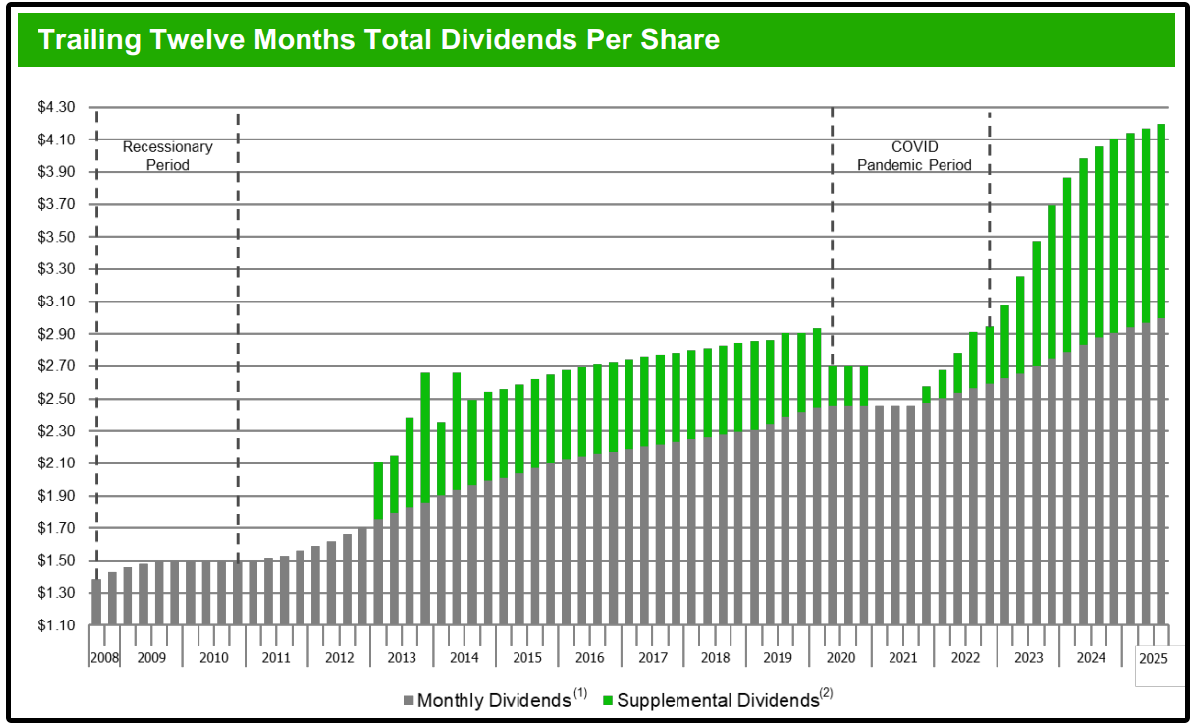
The common example of this is Main Street Capital.
Their base dividend payments have grown every year since 2008-
But their special dividends fluctuate often depending on a multitude of variables.
A BDC is almost always going to be valued entirely based upon their ability to pay dividends.
This is in part due to the fact that they are required by law to payout 90% of their earnings in the form of a dividend.
Thus to value and analyze a BDC, we must make sure we have a basic understanding of their structure.
📚 BDCs Explained
A Business Development Company (BDC) is a publicly traded investment company that primarily lends money to middle-market businesses.
These are typically companies that generate between $10 million and $250 million in annual cash flow.
They are:
Too small to issue bonds in public markets
Too large or too complex for traditional bank lending
This creates a financing gap that BDCs step in to fill.
Instead of issuing mortgages or credit cards like a bank, BDCs primarily make private loans to businesses.
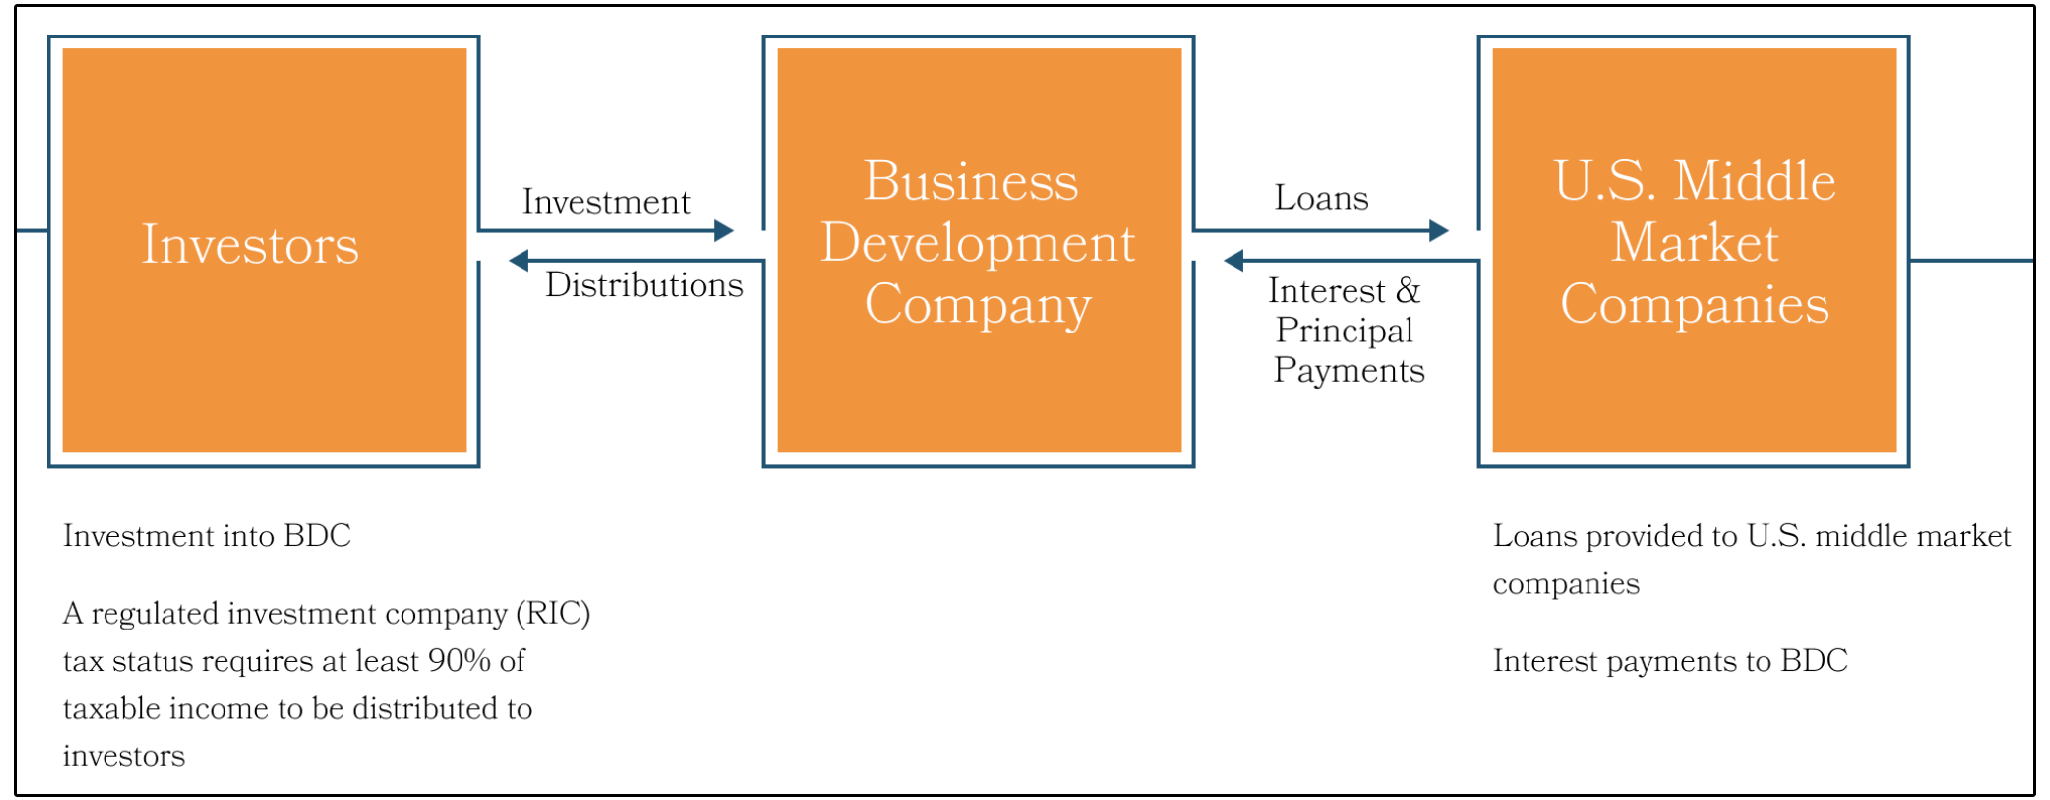
So in the same way that you could argue that REITs are simply a portfolio of leases-
BDCs are a portfolio of loans.
This means the BDC business model is fairly simple.
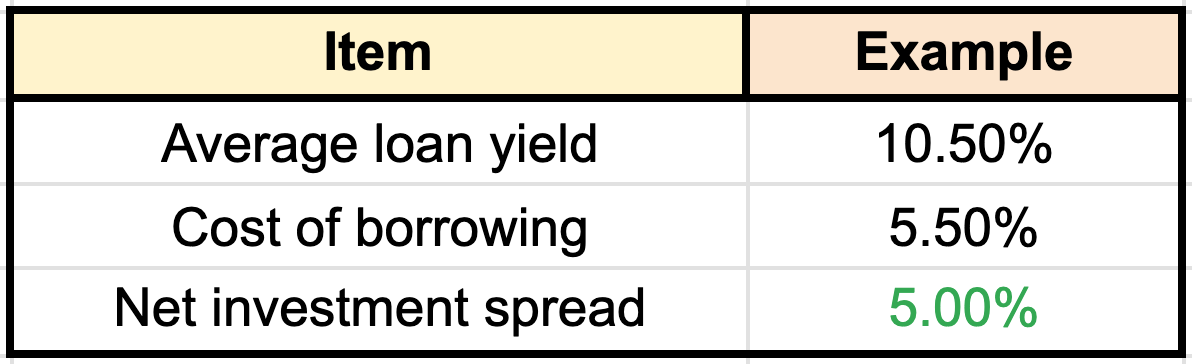
They borrow money at one rate and lend it out at a higher rate, and the difference between those two rates is the net investment spread.
Here is a simplified example:
This business model has had periods of time where returns have been exceptional, especially for high yielding investments.
In fact, if we review the returns of BIZD (BDC ETF) from the market bottom in 2022 up until the 2025 tariff scare, BIZD actually outperformed the S&P 500.
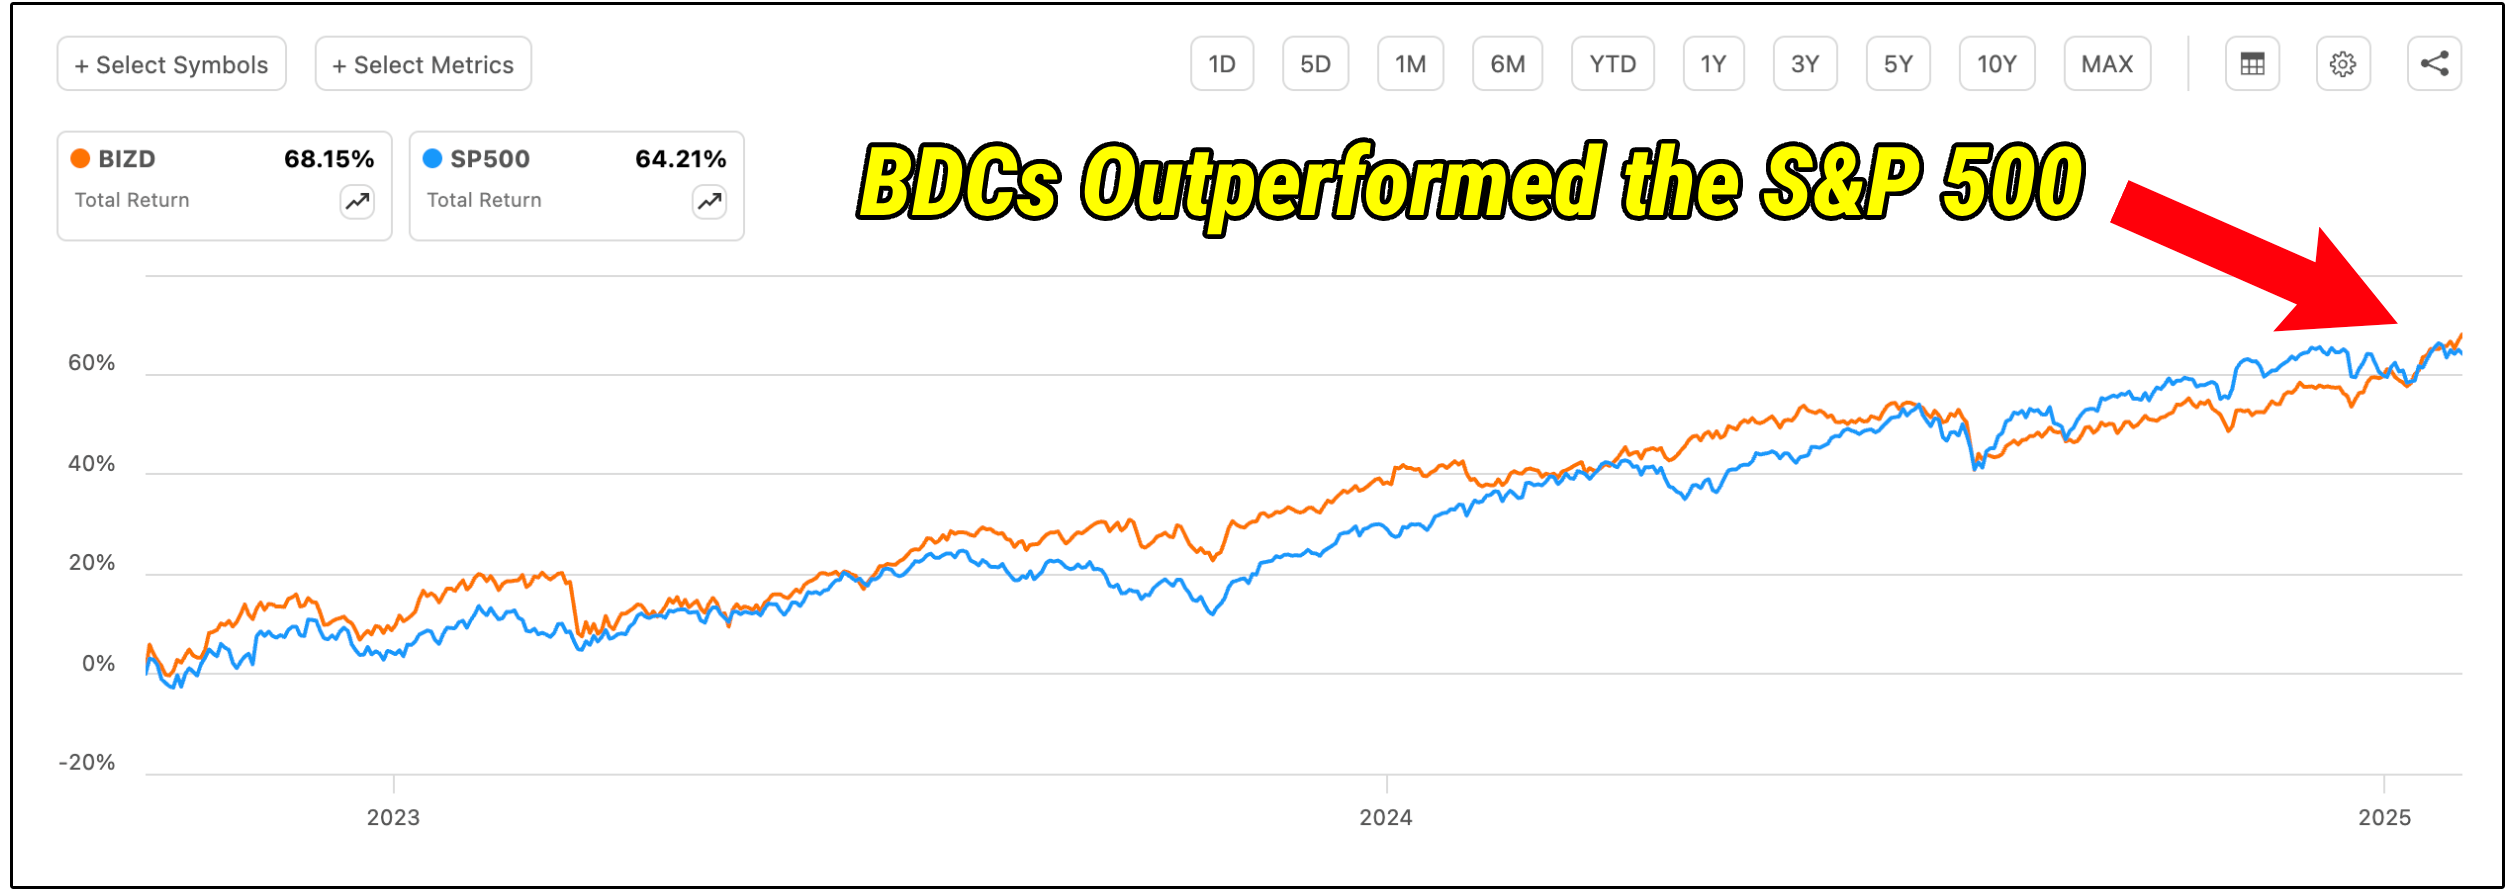
This is quite mind boggling when put into perspective.
In the midst of one of the greatest tech stock rallies that was powered by AI, an ETF holding both high quality and low quality BDCs outperformed the tech heavy S&P 500, while providing double digit yields.
In an optimal environment, this is what BDCs have the ability to do.
⚠️ What Changed?
Over the past three years, BDCs benefited from a nearly perfect environment.
The vast majority of loans issued by BDCs are floating rate.
But BDCs are now facing two major issues:
Declining Rates
Software Lending Concerns
Both of these issues have massive implications for the BDC market as a whole, especially as it relates to their ability to pay dividends.
Let’s start by discussing the rate environment.
🏦 Rate Cuts
As the Federal Reserve raised interest rates aggressively, floating-rate loans immediately began paying higher interest.

This caused BDCs to collect far more interest income.
As a result:
Net investment income rose sharply
Dividends increased across the sector
BDC stock prices rallied
For a while, it was the perfect income trade.
But now that dynamic has reversed.
Several factors have begun working against the sector.
The federal reserve began reducing interest rates again around September of 2025, and has cut rates three times in the last six months.
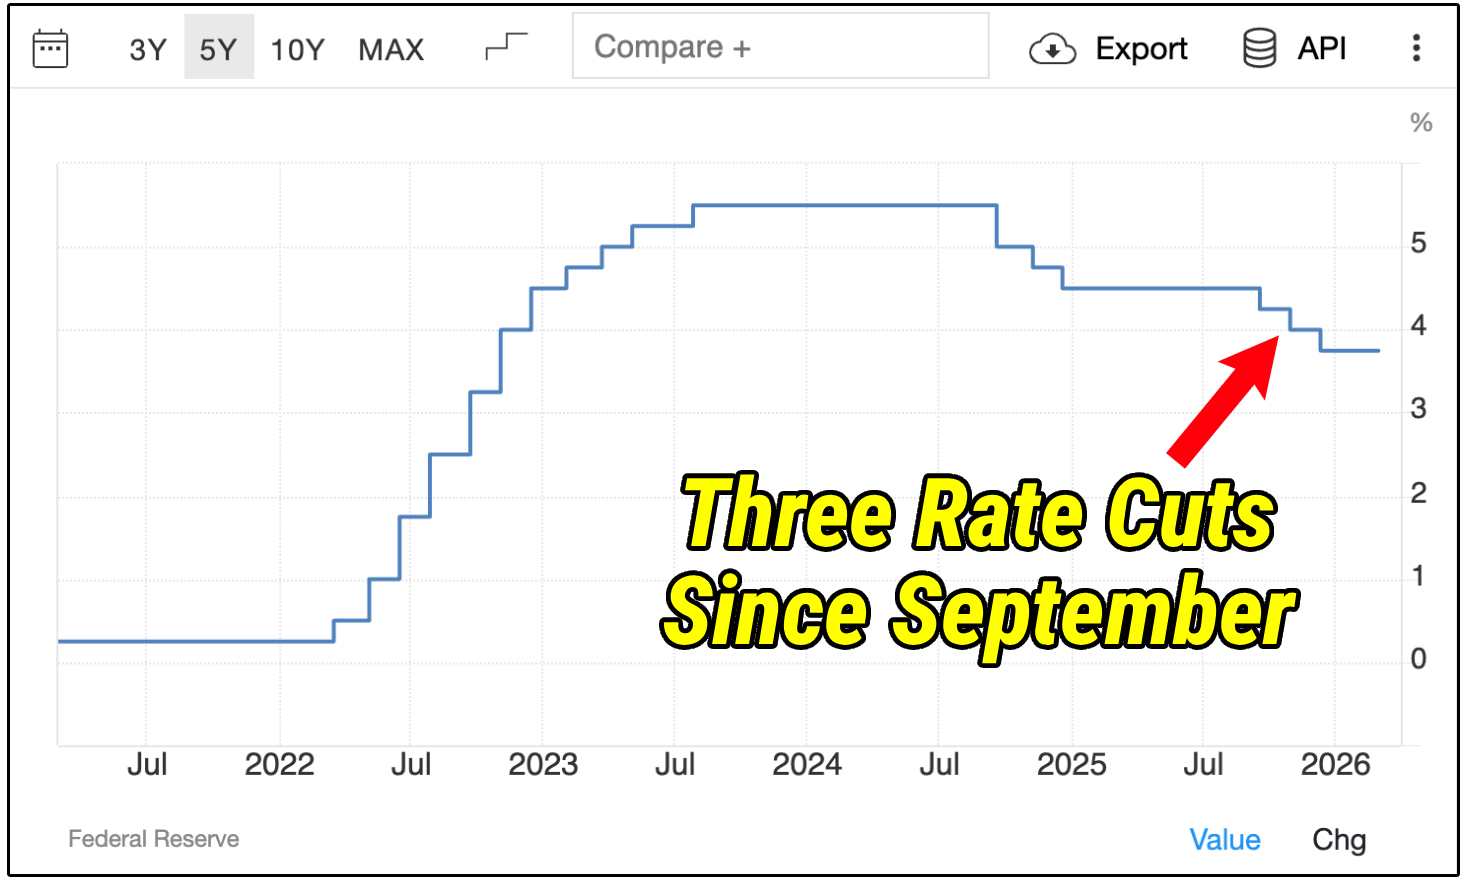
Because most BDC loans are floating rate, falling interest rates reduce loan income.
That directly reduces net investment income and can undoubtedly pressure dividend payouts.
Like mentioned earlier, BIZD has recently paid out their lowest distribution in over 3 years.
Some loans include rate floors, which help cushion the decline-
But overall, the tailwind from rising rates has turned into a headwind.
However, the other issue could potentially be just as detrimental to BDCs.
💻 Software Lending
Across the BDC universe, roughly 20% of loans are tied to software companies.
Private equity firms historically favored software businesses because of their recurring revenue models, asset-light operations, and high growth potential.
However, many of these loans were made during periods when technology valuations were extremely high.
Since then:
Software valuations have declined (due to AI)
Growth expectations have moderated (again, due to AI)
Interest expenses have increased
This combination has created credit risk for many borrowers.
Many of these software companies took on significant debt during a period when valuations and growth expectations were much higher than they are today.
At the time, the assumption was that revenue and cash flow would continue growing rapidly, allowing these businesses to comfortably service their debt.
But the market is now afraid that won’t be the case for many software companies.
With many BDCs having significant exposure to these software companies, this creates a large risk.
⚖️ So What’s the Result?
We’ve already seen the result of these risks reflected in the share price of BDCs to some degree.
However, this isn’t purely due to a drop in net investment income for most BDCs.
In fact, some have been able to sustain their net asset value.
So if the share price is declining, while their net asset value stays the same-
This means valuations are becoming more attractive.
This becomes abundantly clear when viewing the Dividendology BDC Database:
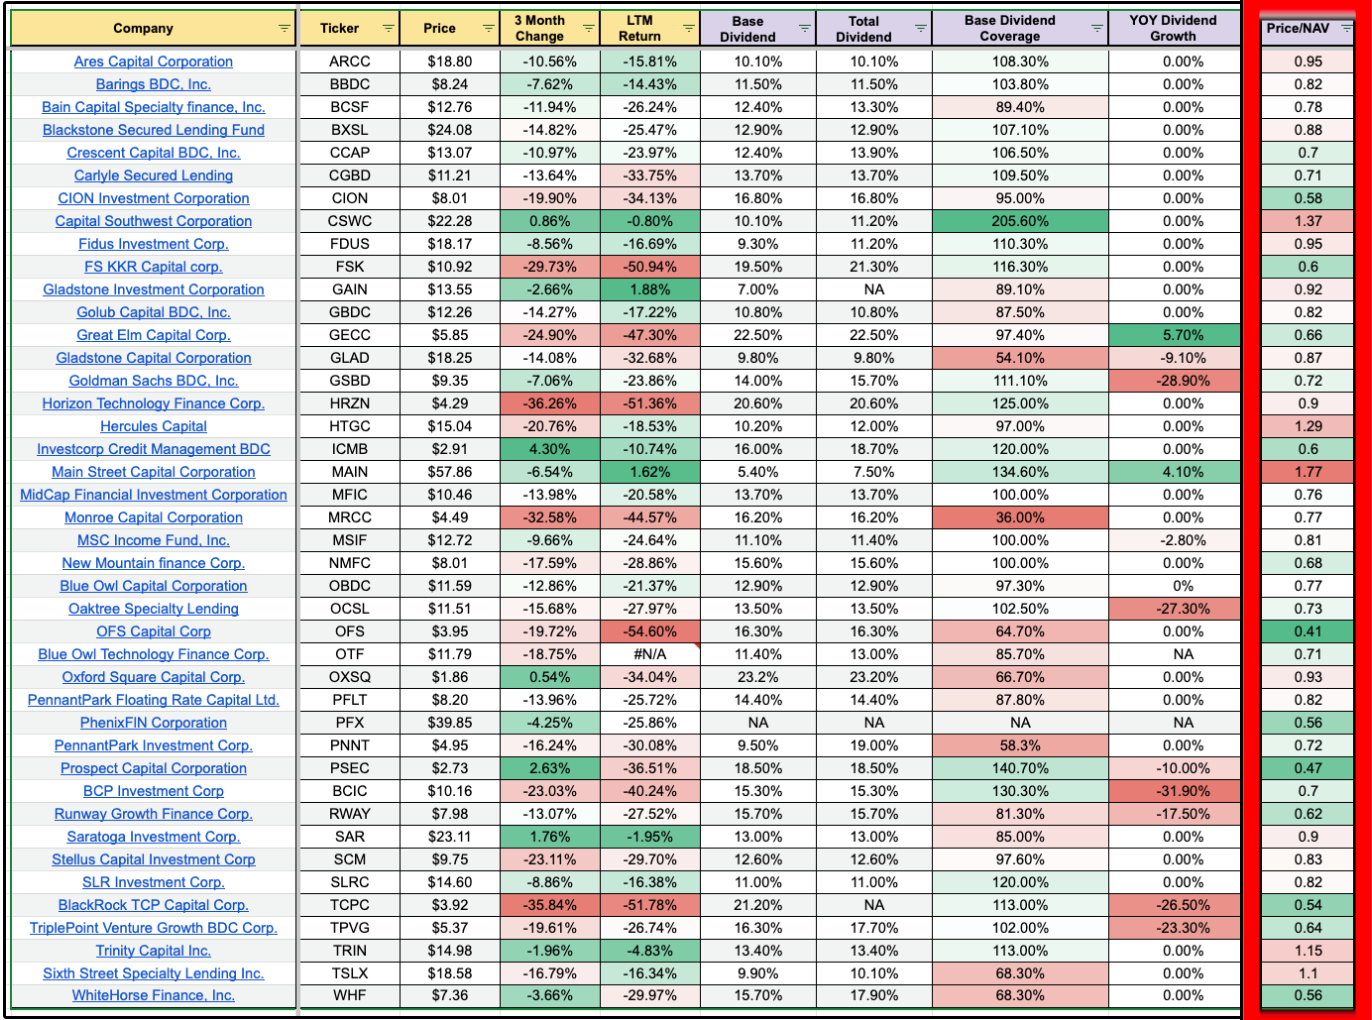
Out of 42 BDCs actively tracked in the Database, only 5 are currently trading at a P/NAV above 1.
BDCs are currently trading at significant discounts to Net Asset Value (NAV).
Of course, for the weaker BDCs, this is likely justified.
Net investment income will drop with rates declining, and the BDCs that are over exposed to weak software companies will face real difficulty with maintaining their dividends.
But there is undoubtedly opportunity now for those willing to do the research and evaluate the quality of BDCs, their loan quality, their dividend quality, and their exposure to floating rate loans.
Let’s look at just a few of the top high yield opportunities in the high yield space.
1. 👑 Main Street Capital (MAIN)
Total Yield: 7.5% | Base Dividend Coverage: 134.6%
Main Street continues to be the most elite BDC in the space fundamentally speaking, and their recent earnings report proved it once again.
14th consecutive quarter of record NAV
Distributable NII of $1.11/share which comfortably covers the $0.72 base quarterly dividend (134.6% coverage in the Dividendology BDC Database)
18th consecutive supplemental dividend ($0.30/share on top of the base, bringing total yield to ~7.5%)
Non-accruals at just ~1% of fair value, which is among the lowest in the industry.
5 Year TBVPS CAGR of 5.76% which is the best book value growth track record of any BDC in the database.
Fundamentally, there is no debate that MAIN is the highest quality BDC.
While most BDCs struggle to simply maintain their NAV, MAIN grows NAV nearly every single quarter.

MAIN’s variable rate debt sits at just 53.8%, which is one of the lowest in the BDC space, which actually helps on the liability side as rates come down.
This BDC will be the LEAST negatively impacted BDC by rate cuts.
On the asset side, CEO Dwayne Hyzak noted software exposure is in the “mid-single digits” percentage of the portfolio.
MAIN has always been a value-oriented, lower middle market lender focused on basic industries, manufacturing, and services.
So MAIN has very low risk when it comes to declining rates and exposure to software companies.
Of course, the catch is the valuation.
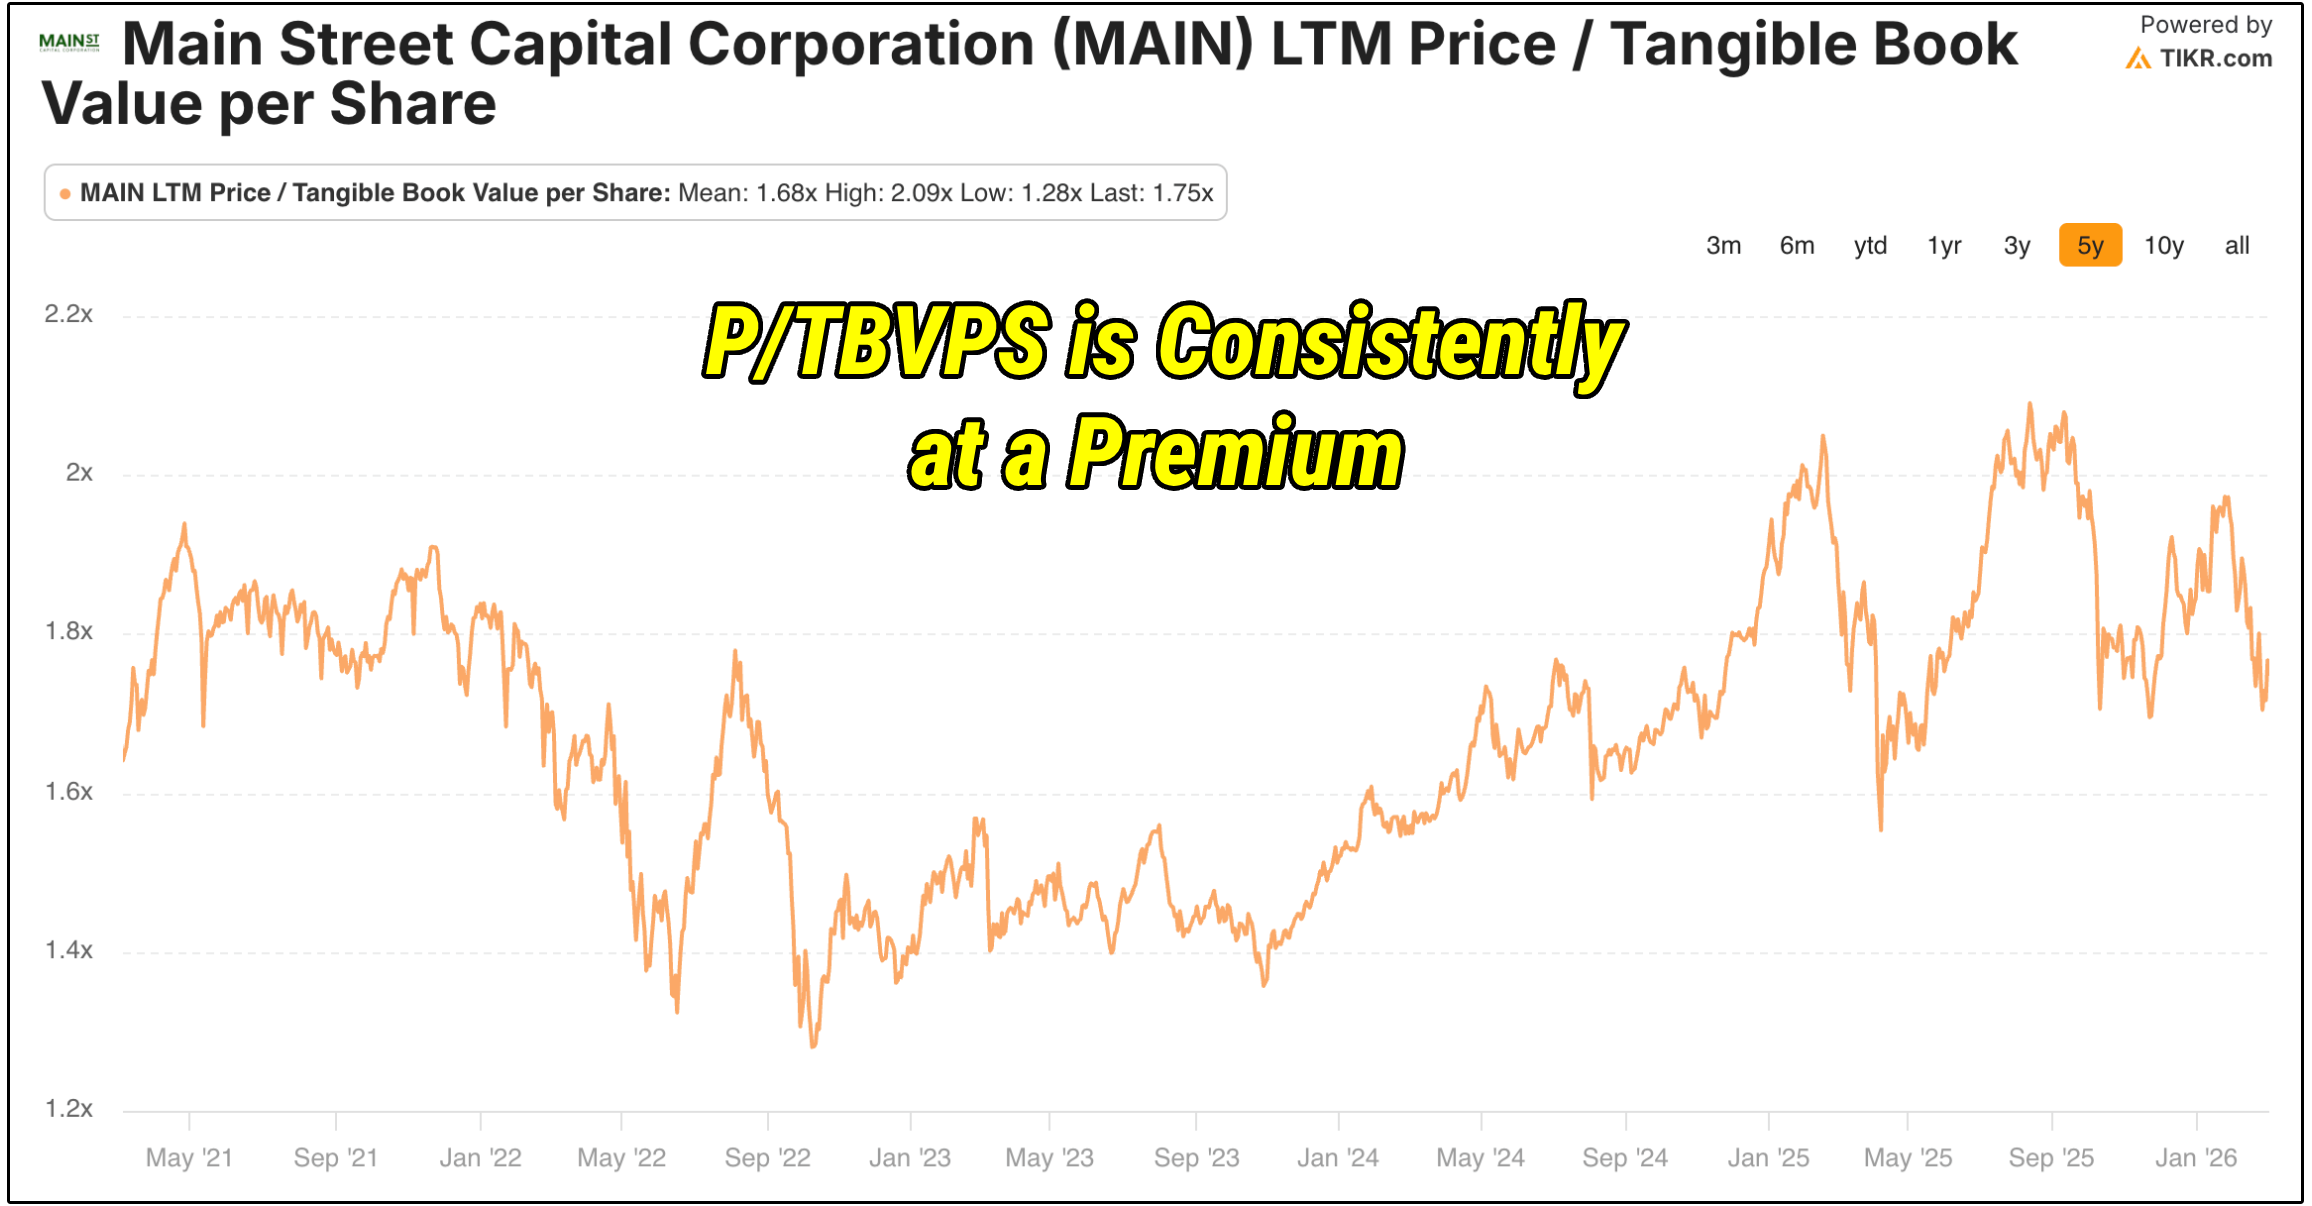
At $57.63, MAIN trades at 1.77x NAV, which is the highest premium in the entire database.
But this is a BDC that has grown book value at 4.53% annually for 9 years while paying a massive dividend.
You’re paying up for the best management team in the business, internal management (no external fees eating into returns), and a 0.73x leverage ratio that gives them enormous dry powder.
Let’s review 2 BDCs that are more attractively valued, and analyze the entire Dividendology BDC Database.