Perhaps the biggest mistake I made as a beginner investor?
Not fully grasping the importance Return on Invested Capital (ROIC).
It took me years to fully appreciate this.
I understood it in theory for a long time-
But it wasn’t until I saw real-world examples that my investing philosophy changed forever.
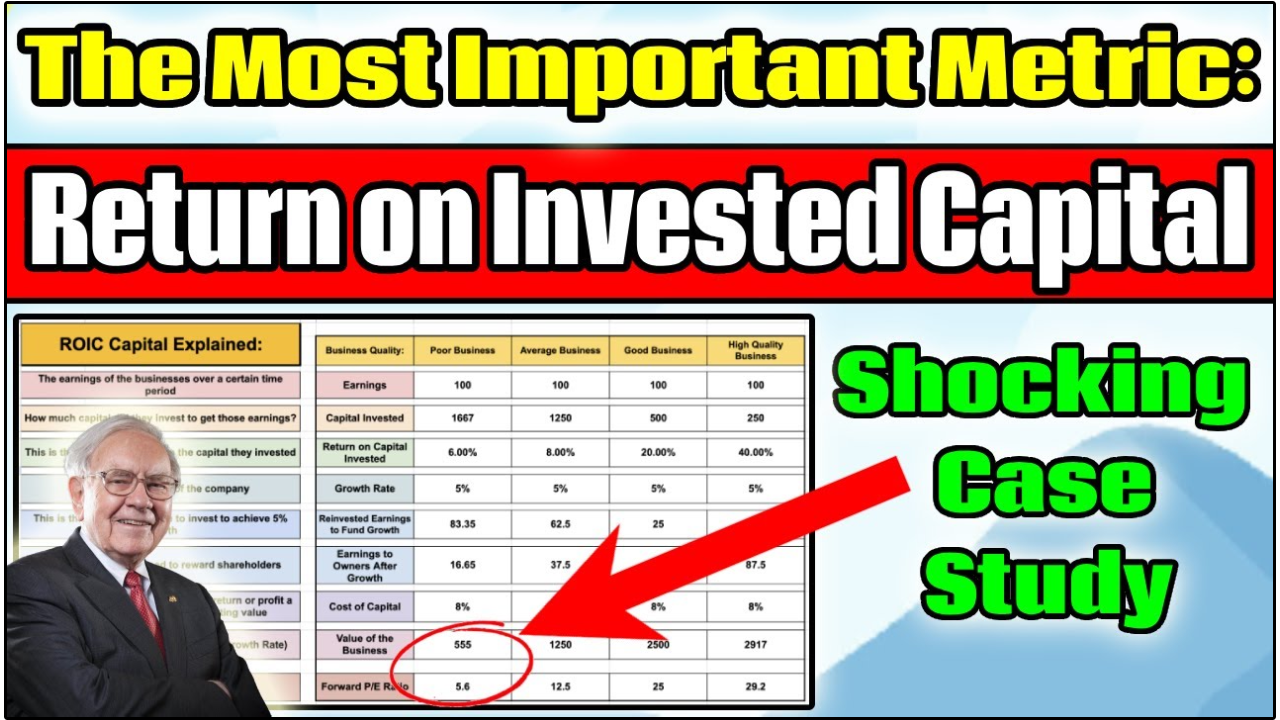
💎 What is ROIC?
At its core, ROIC measures how efficiently a company generates profit from the capital invested in its business.
The formula is simple:
ROIC = Net Operating Profit After Tax (NOPAT) / Invested Capital
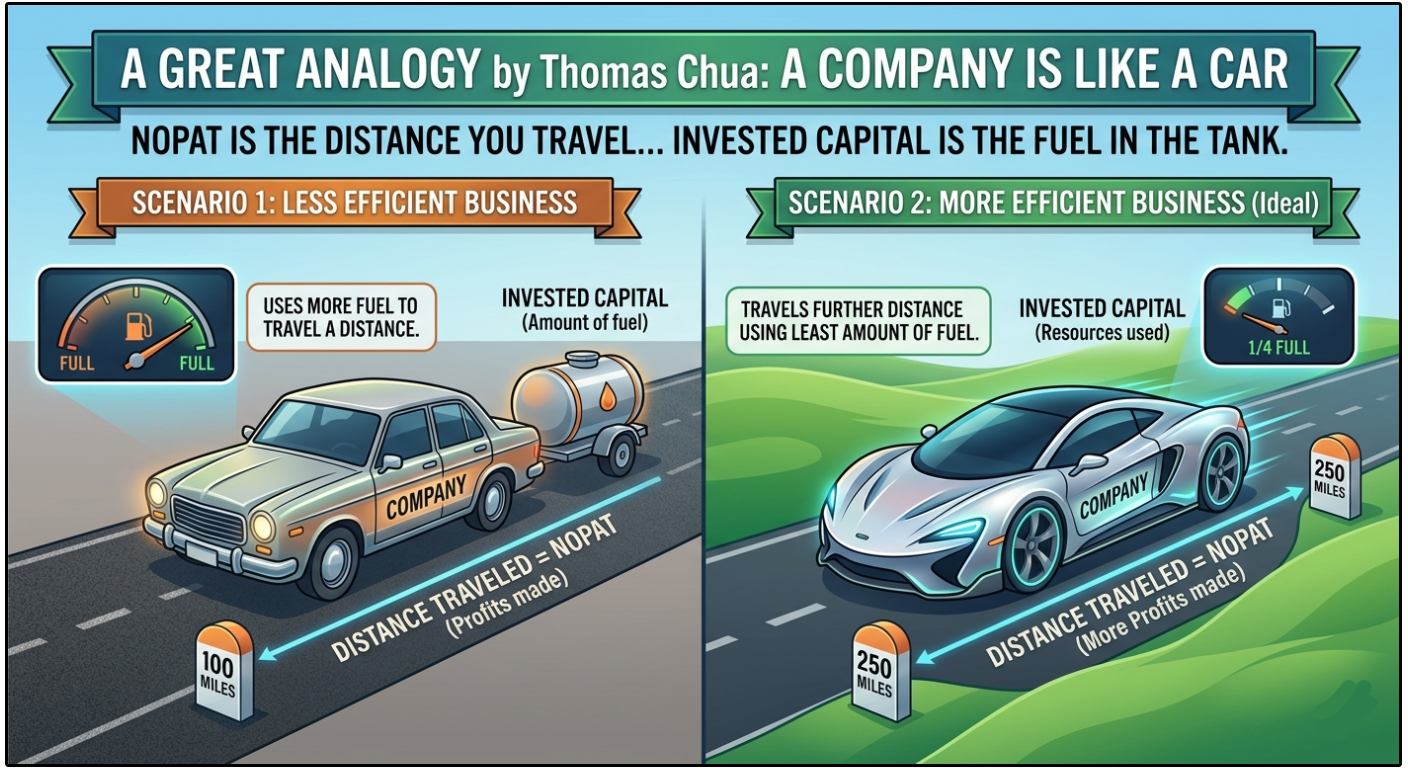
I love this analogy from Thomas Chua:
Imagine a company is a car.
NOPAT is the distance you can travel (how much profit was made)
Invested Capital is the amount of fuel in the tank (the resources used to generate that profit).
So ROIC = “miles per gallon” for a business.
Ideally, we want a car that can travel the furthest distance using the least amount of fuel.
That’s exactly what a high ROIC tells you.
If a company has an ROIC of 25%, that means for every $100 of capital invested in the business, the company generates $25 in after-tax operating profit.
That’s a 25% return on every dollar deployed.
Why does this matter so much?
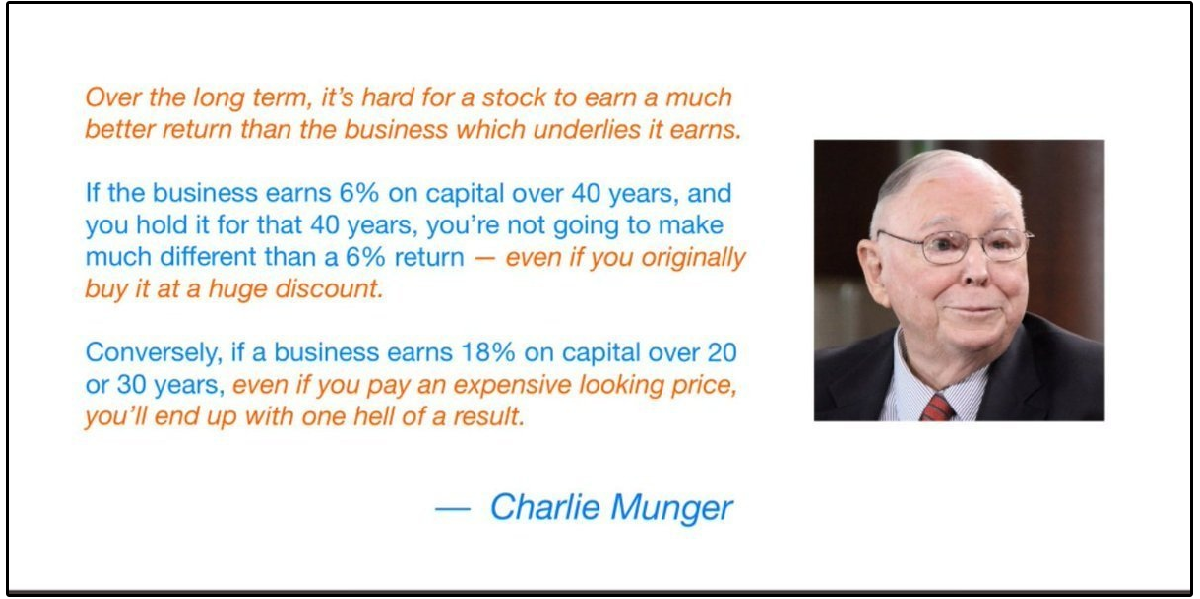
Because over the long run, a stock’s performance will closely mirror the underlying returns on capital of the business.
Charlie Munger said it best:
Read that again.
Valuation matters, but business quality matters nearly just as much over the long term.
“We’ve really made the money out of high-quality businesses. Over the long term, it’s hard for a stock to earn a much better return than the business which underlies it earns.” -Charlie Munger
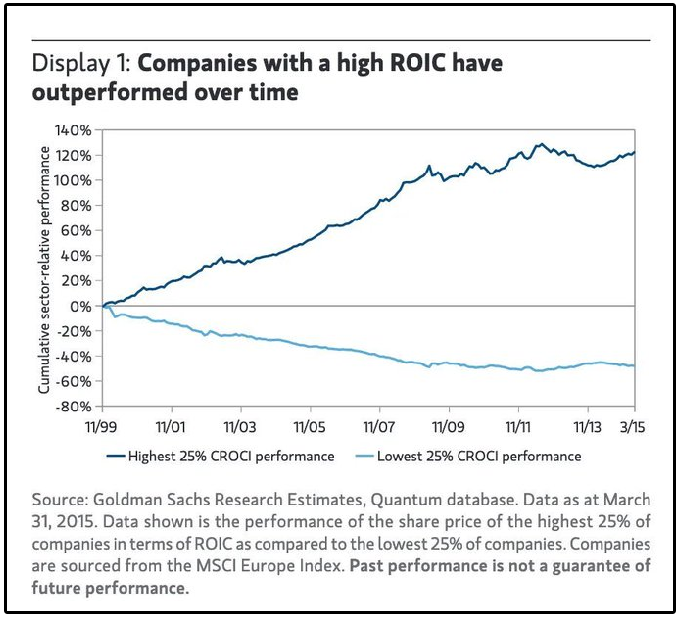
📊 The Shocking Data
Goldman Sachs analyzed decades of market data and released a report where they compared two groups of companies:
The top 25% of businesses based on ROIC
The bottom 25% of businesses based on ROIC
The results were staggering.
Companies in the top 25% of ROIC substantially outperformed the bottom 25% over the long term, and the gap only widened as the holding period increased.
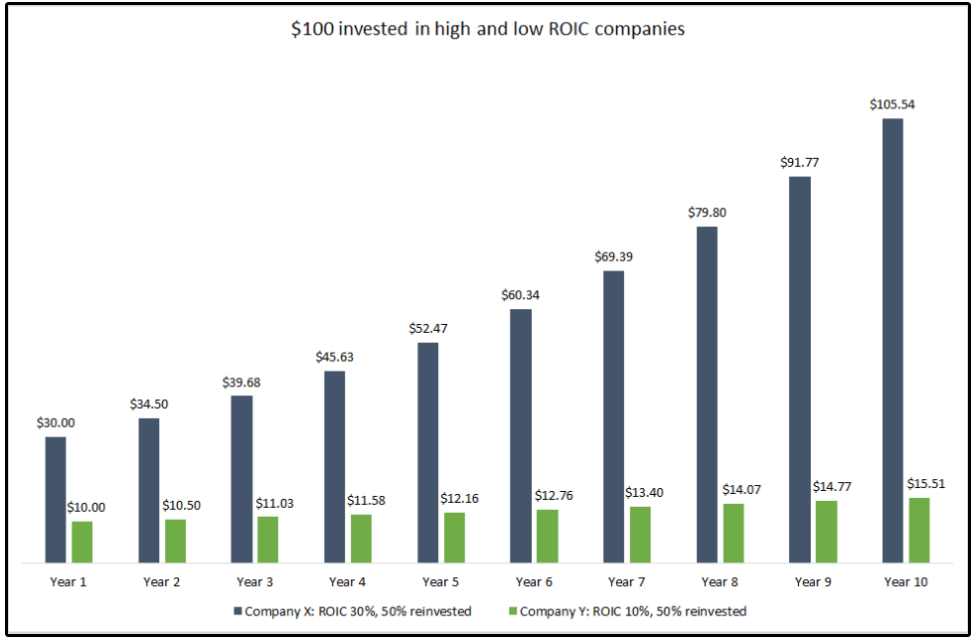
🧮 The Compounding Formula
Here’s where it gets powerful.
Earnings Growth = ROIC x Reinvestment Rate
If a company generates a 25% ROIC and reinvests 60% of its earnings back into the business:
25% x 60% = 15% earnings growth
Now compare that to a company with a 10% ROIC reinvesting the same 60%:
10% x 60% = 6% earnings growth
The companies had the same reinvestment rate, but saw vastly different outcomes.
Over a decade, the 15% grower will be worth roughly 4x more than the 6% grower.
This is why ROIC is the foundation of everything else we care about, like earnings growth, dividend growth, and ultimately, share price appreciation.
But here’s where it gets even more practical.
You can flip that formula around to figure out how much a company needs to reinvest to hit a specific growth rate:
Reinvestment Need = Desired Growth Rate / ROIC
Let’s say a company wants to grow earnings at 10% per year.
At a 20% ROIC, they only need to reinvest 50% of earnings (10% / 20%)
At a 10% ROIC, they need to reinvest 100% of earnings (10% / 10%)
This is incredibly important for dividend growth investors.
The higher the ROIC, the less the company needs to reinvest to maximize grow, and the more free cash flow is left over for dividends and share buybacks.
This is exactly why companies like Visa and Mastercard can grow earnings at double digit rates while still returning massive amounts of capital to shareholders.
Their ROIC is so high, they don’t need to reinvest much to keep the growth engine running.
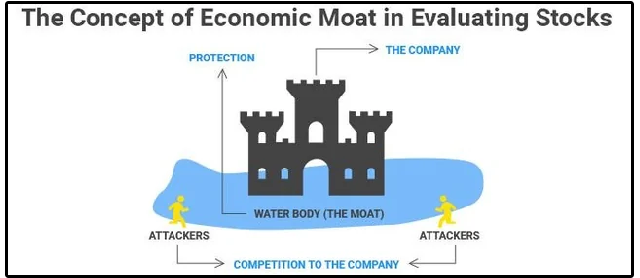
🏰 Why Some Companies Sustain High ROIC
Now, basic economic theory tells us that high returns on capital should eventually attract competition that erodes those returns back to the mean/average.
It’s a concept known as ‘mean reversion’.
But the reality is that the best companies defy this theory for decades for one reason:
Economic moats.
A sustainable competitive advantage protects a company’s ability to generate high returns on invested capital, and protects their profitability margins.
These moats show up in a few key forms:
Network Effects — The value of the product increases with each new user. Think Visa or Mastercards payment network. The more merchants accept it, the more consumers want it, and vice versa. This creates a self-reinforcing cycle that is nearly impossible to break.
Switching Costs — Once a customer is embedded into your product, leaving is expensive and disruptive. Companies like Microsoft have extremely high switching costs. Businesses don’t rip out their entire workflow for a marginally cheaper alternative.
Strong Brands — Companies like Apple and Hermes command premium pricing simply because of the power of their brand. This translates directly into higher margins and higher ROIC.
Keep in mind, MOATs can change over time, and the best companies are actively widening their moats over time.
Many investors focus on the size of the moat, but not enough focus on the trajectory of the moat.
“Leaving the question of price aside, the best business to own is one that over an extended period can employ large amounts of incremental capital at very high rates of return.” - Warren Buffett
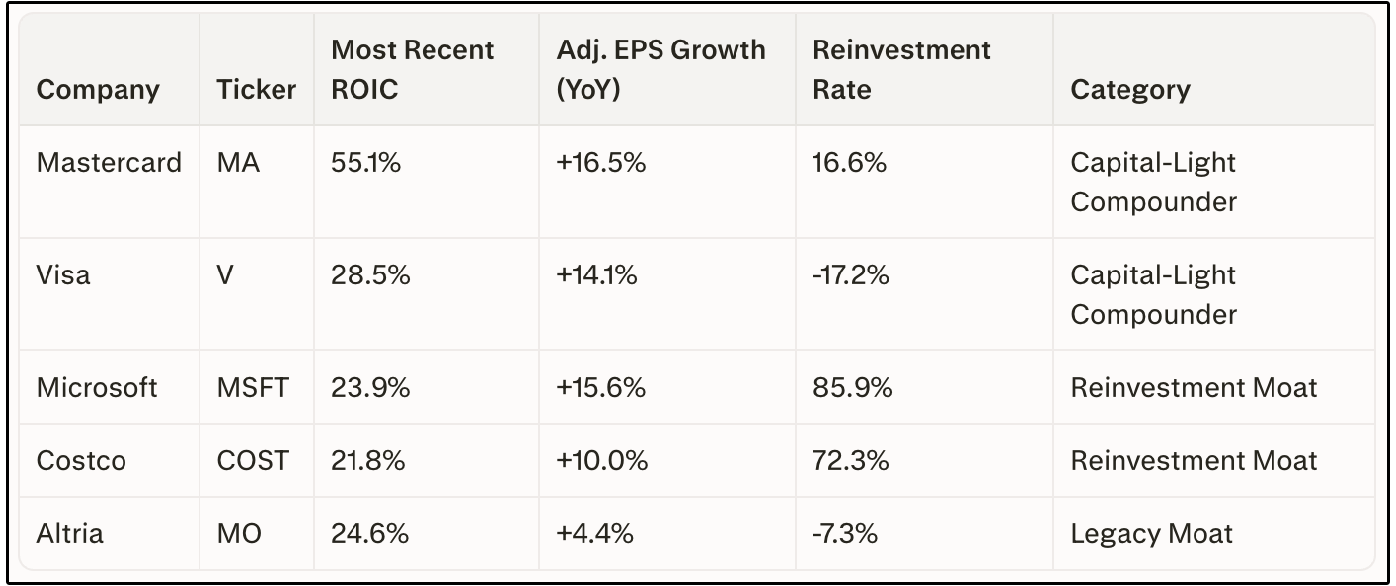
🥇 High ROIC Dividend Growth Stocks
There is a high level of overlap between high ROIC stocks and dividend growth stocks.
I’ve been pointing this out for years.
Here are just a few examples of the highest ROIC dividend growth stocks I’m watching:
A few things to notice here:
Visa has a negative reinvestment rate. This means it’s actually shrinking its invested capital base, largely through aggressive share buybacks, while still growing adjusted earnings by +14%. That’s the power of being a Capital-Light Compounder. It doesn’t need to invest more capital to grow.
On the other hand, look at Microsoft. A reinvestment rate of 86%. This is a Reinvestment Moat company actively deploying capital into growth opportunities at high returns. Microsoft’s massive CapEx into AI infrastructure is a prime example.
And then there’s Altria, A 24.6% ROIC, which is actually higher than Microsoft and Costco, but only +4.4% earnings growth with a negative reinvestment rate. That’s the textbook Legacy Moat. High returns on existing capital, but no reinvestment opportunities left. Almost all earnings get shipped back to shareholders as dividends. Great for income, but the compounding days are behind it.
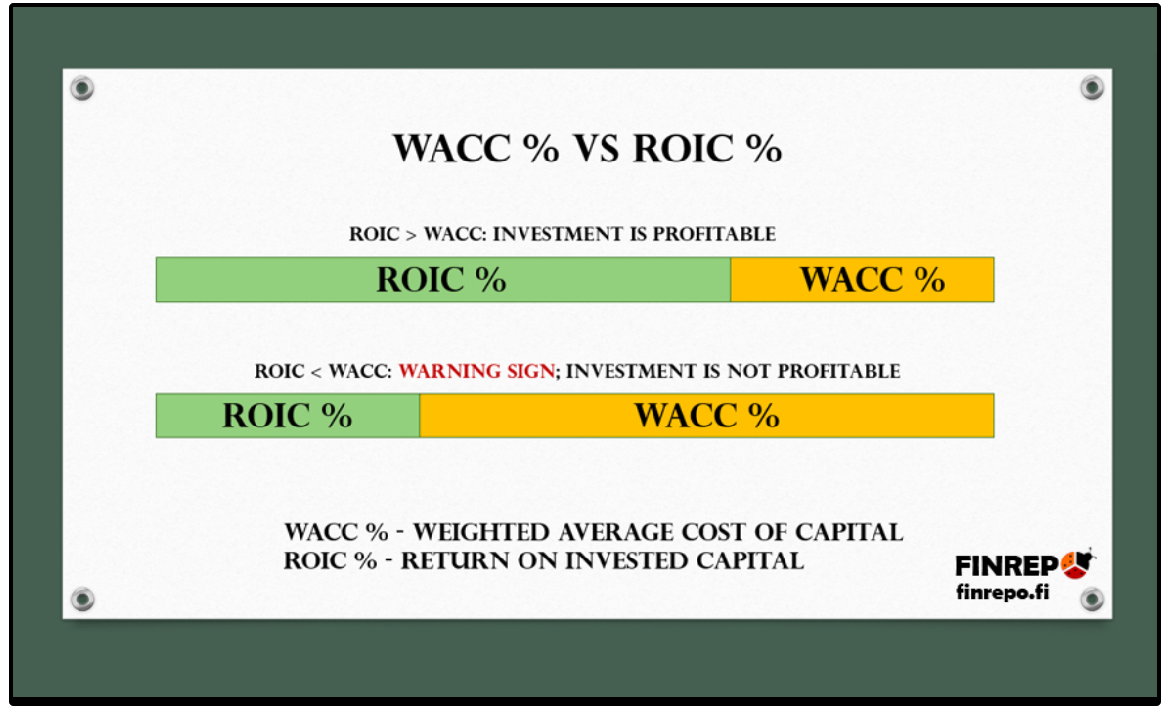
📝 ROIC vs. WACC: The Real Test
Here’s the part many investors miss.
A high ROIC alone isn’t enough.
ROIC must be compared against the company’s Weighted Average Cost of Capital (WACC).
ROIC > WACC = The company is creating value. Every dollar invested earns more than it costs.
ROIC < WACC = The company is destroying value. It would be better off returning capital to shareholders.
The wider the spread between ROIC and WACC, the more value is being created.
A company earning 30% ROIC against a 10% WACC is a compounding machine.
A company earning 12% ROIC against a 10% WACC is barely creating value.
This is the exact framework that separates great businesses from mediocre ones, regardless of how cheap or expensive the stock appears on a traditional valuation basis.
💵 The One Dollar Test
Still not convinced?
Take a look at this chart.
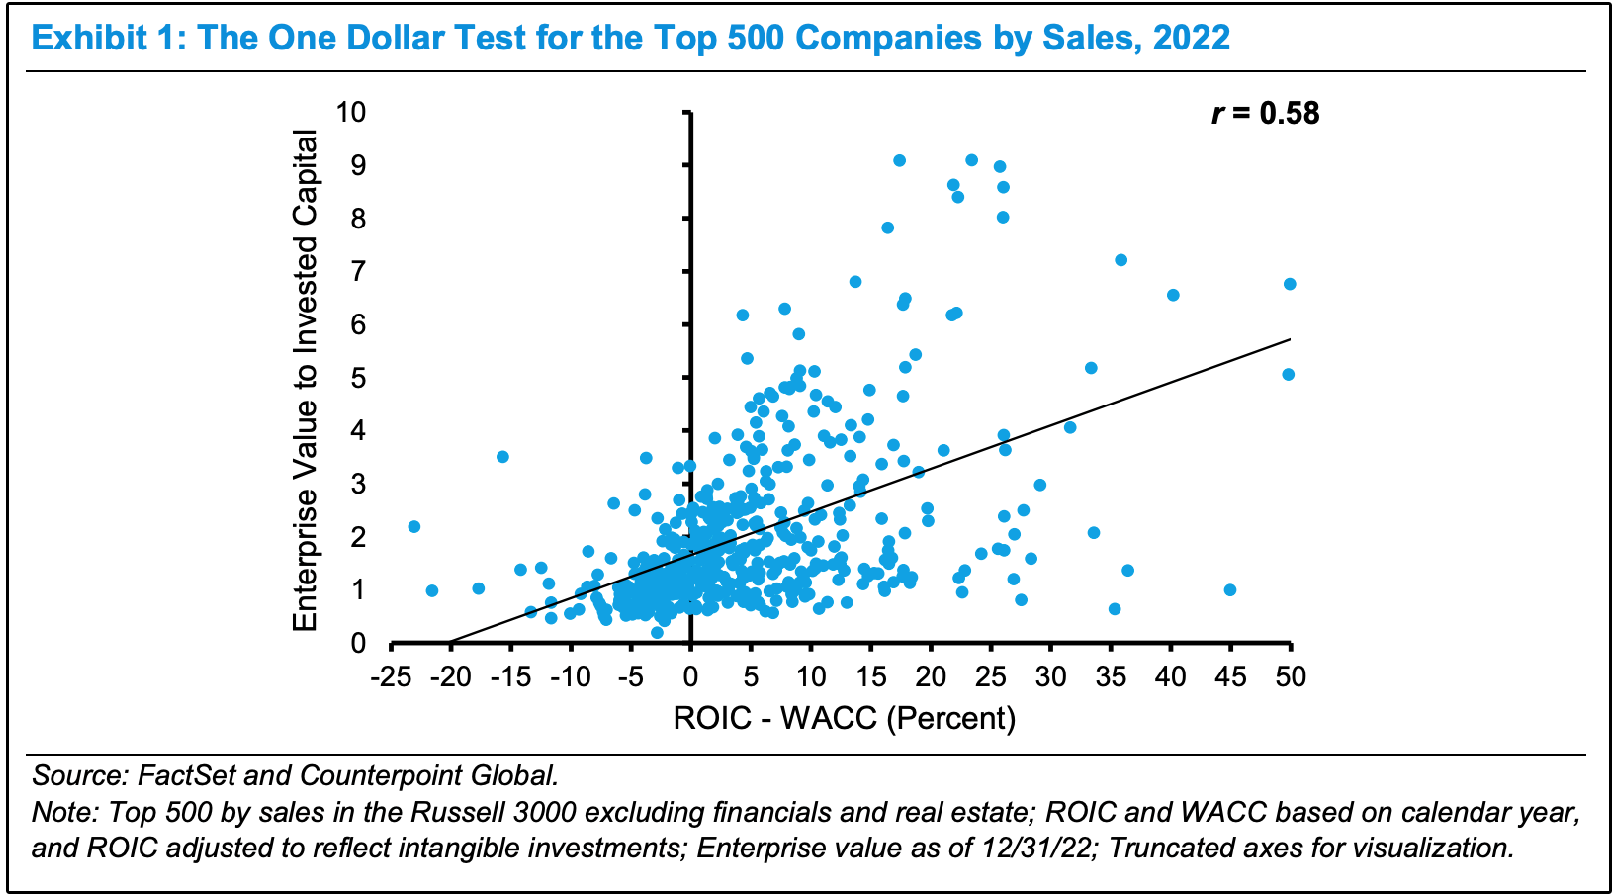
This chart is called “The One Dollar Test” and it’s one of the most powerful visualizations of why ROIC matters in my opinion.
Here’s how to read it:
The horizontal axis (x-axis) shows the spread between a company’s ROIC and its WACC.
Companies on the right side are earning well above their cost of capital.
Companies on the left are earning below it.
The vertical axis (y-axis) shows how much the market values each dollar of capital invested in the business.
In plain English:
If a company has an ROIC-WACC spread of 0 (meaning they earn exactly their cost of capital), the market values each dollar invested at roughly $1.
This of course makes sense, as the company is just breaking even.
But if a company earns 20% above its cost of capital?
The market might value each dollar invested in the business at $4, $5, or even $8+.
And companies earning well below their cost of capital?
The market values their invested capital at less than $1, meaning those businesses are literally worth less than the money put into them.
The takeaway is simple:
The market rewards companies that earn high returns on their invested capital.
The wider the gap between what a company earns (ROIC) and what it costs to fund that capital (WACC), the more the market is willing to pay for every dollar in the business.
This is the data behind the idea that ROIC drives valuation, not the other way around.
💰 Capital Allocation & ROIC
So we’ve established that ROIC is the most important metric. But here’s the thing-
A high ROIC means nothing if management doesn’t allocate capital properly.
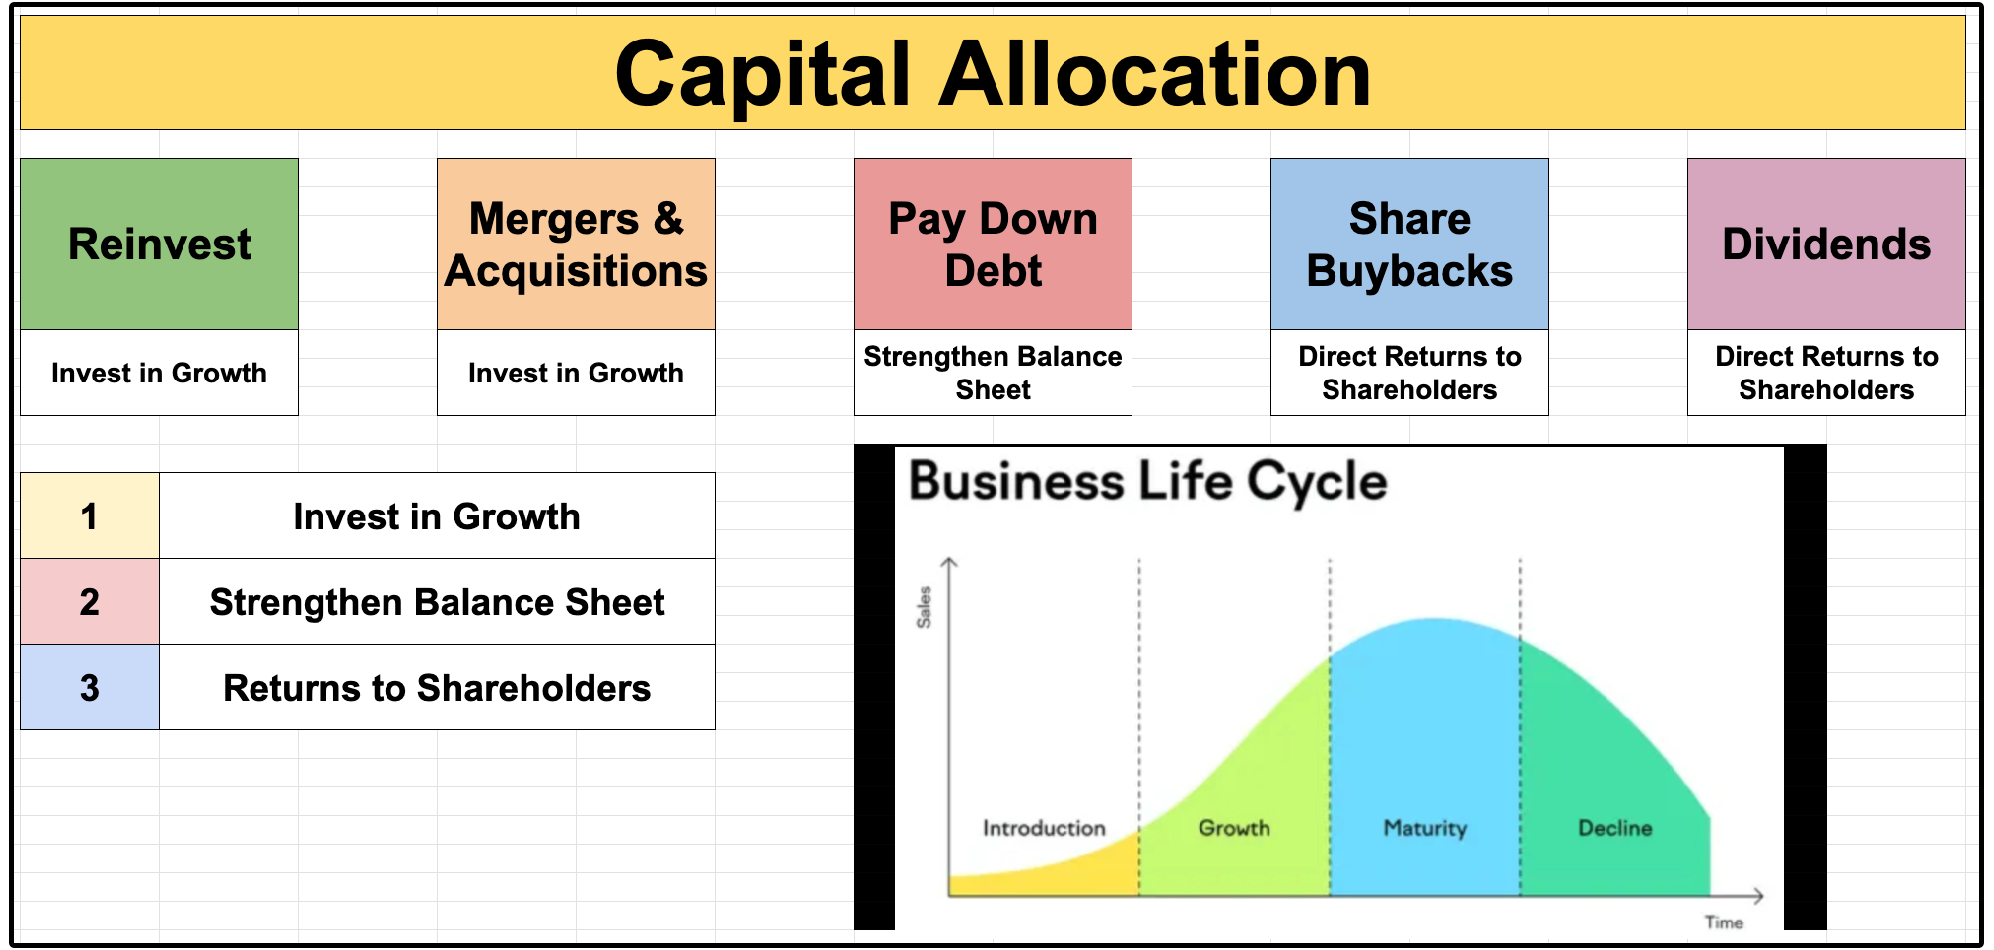
At the end of the day, there are only 5 things a company can do with its free cash flow:
Reinvest into the business
Mergers & Acquisitions
Pay down debt
Share buybacks
Dividends
That’s it. Every dollar of free cash flow goes into one of these five buckets.
The goal of management is to decide the best way to allocate that capital to maximize shareholder returns.
And ROIC is the compass that should guide every single one of those decisions.
If the company can identify projects that will generate a high ROIC, reinvest.
If the company can acquire businesses that will generate returns above WACC, acquire.
If neither of those options exist, return the cash to shareholders through buybacks and dividends.
It’s that simple in theory.
But in practice, this is where most companies go wrong.
If a company uses all of its capital to pay out dividends, they can’t reinvest back into the business, making it more difficult to grow free cash flow in subsequent years — which actually makes it more difficult to grow dividends in the future.
This is why we commonly see dividend growth stocks with payout ratios around 20% grow dividends at a high rate, and even outperform the market.
But wait a second!-
Doesn’t this mean if a stock stopped paying a dividend and reinvested all of its capital, then free cash flow would grow faster, leading to higher total returns?
Not necessarily.
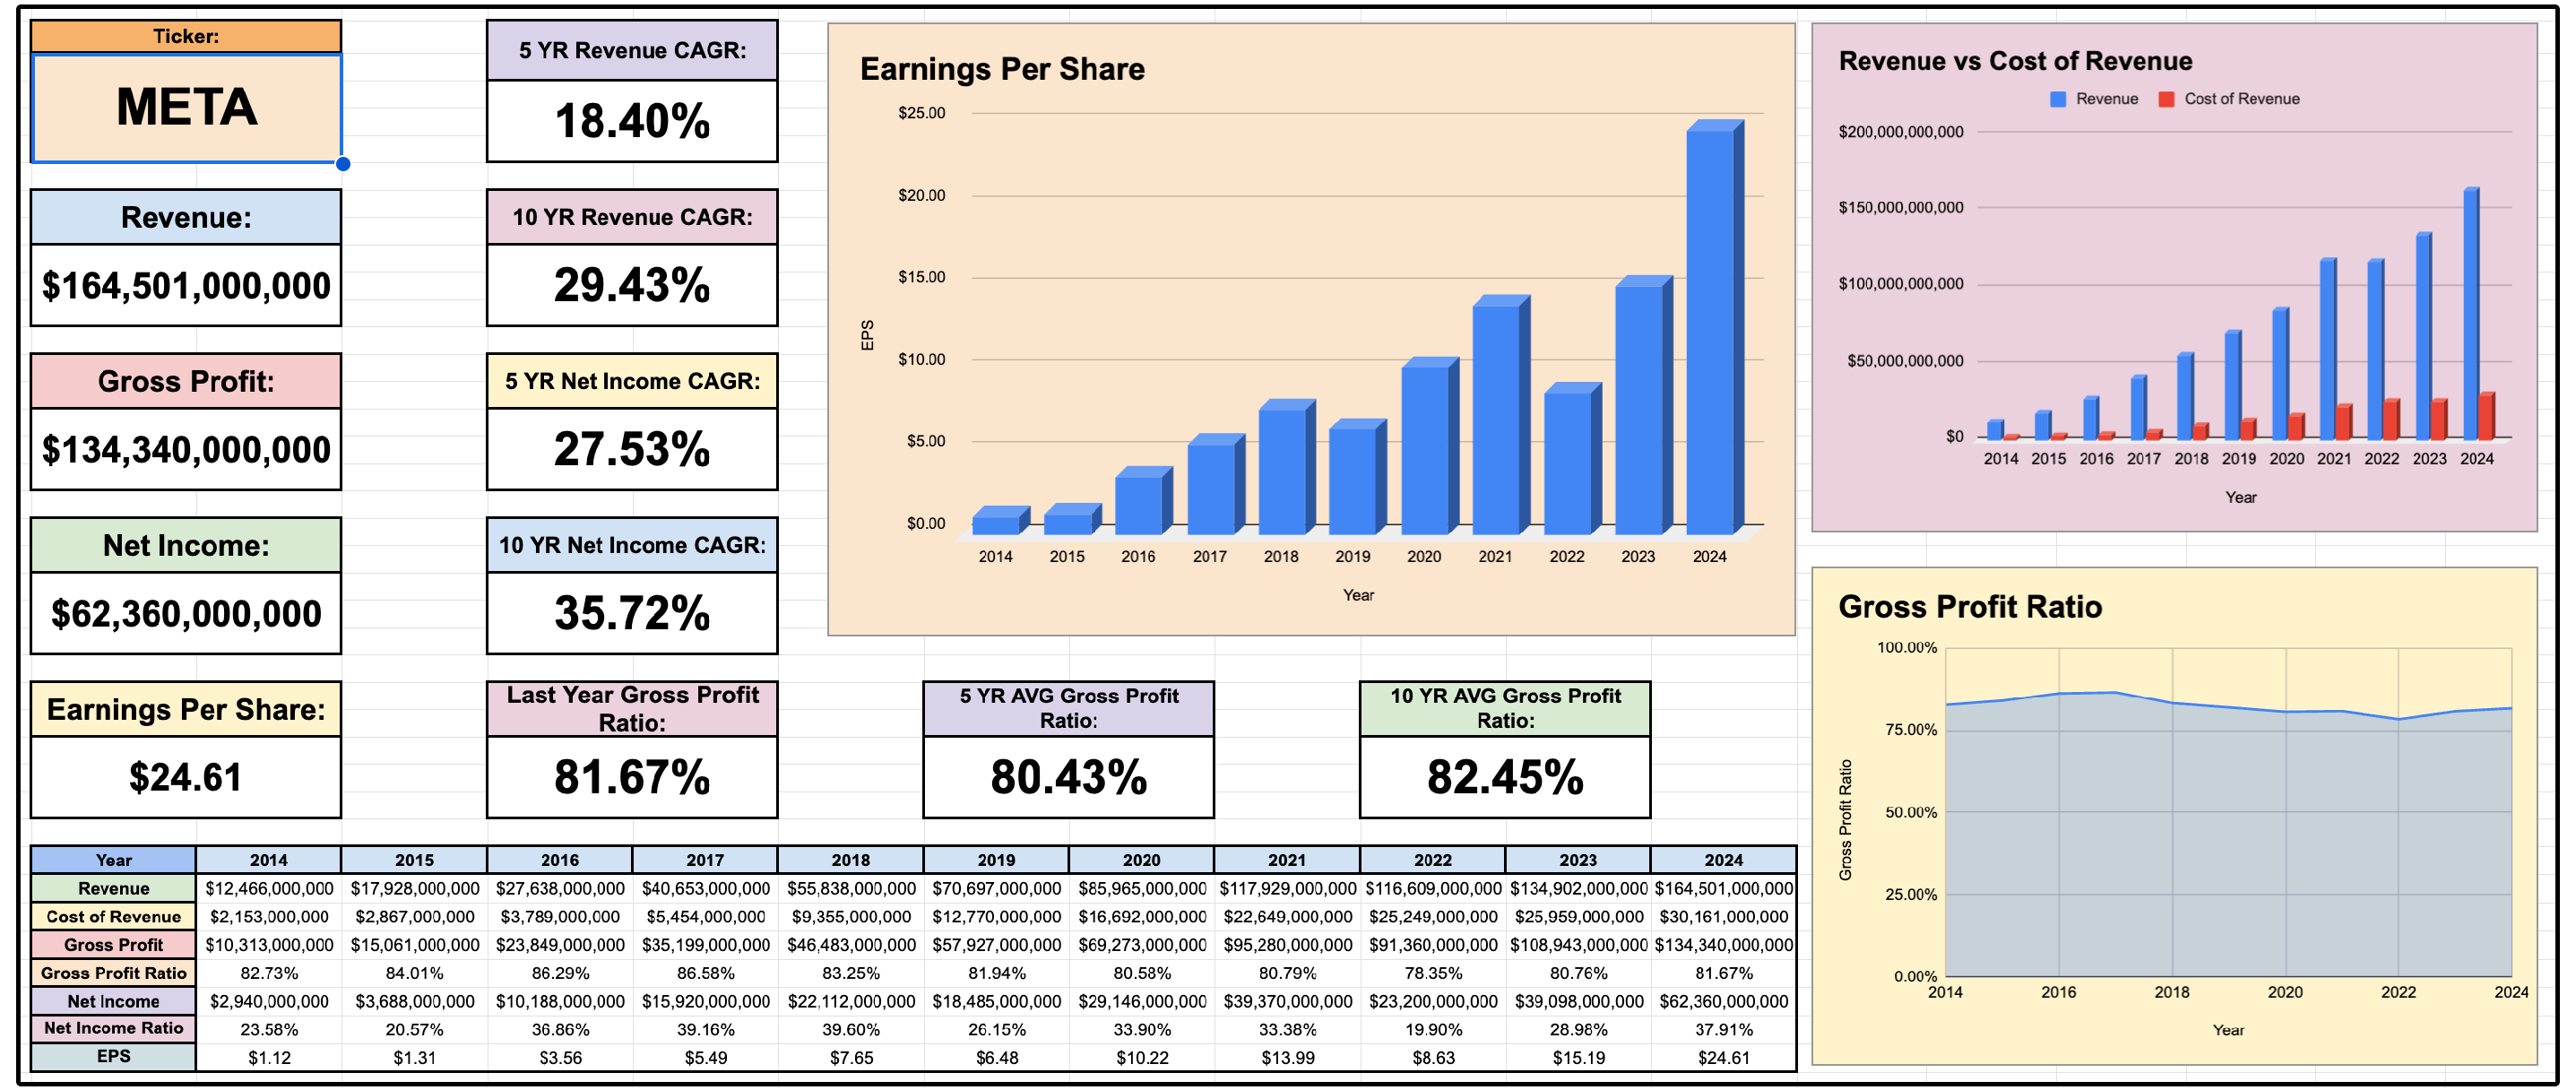
Meta is the perfect case study.
Ⓜ️ The Meta Case Study
When Meta announced plans to start paying dividends in early 2024, many investors were surprised.
Here was a company with exceptional profitability, a five-year revenue CAGR of 18.4%, over $91 billion in current assets, and minimal debt.
So why start paying a dividend?
Because the company was generating so much free cash flow, it became impossible to reinvest all of it at high rates of return.
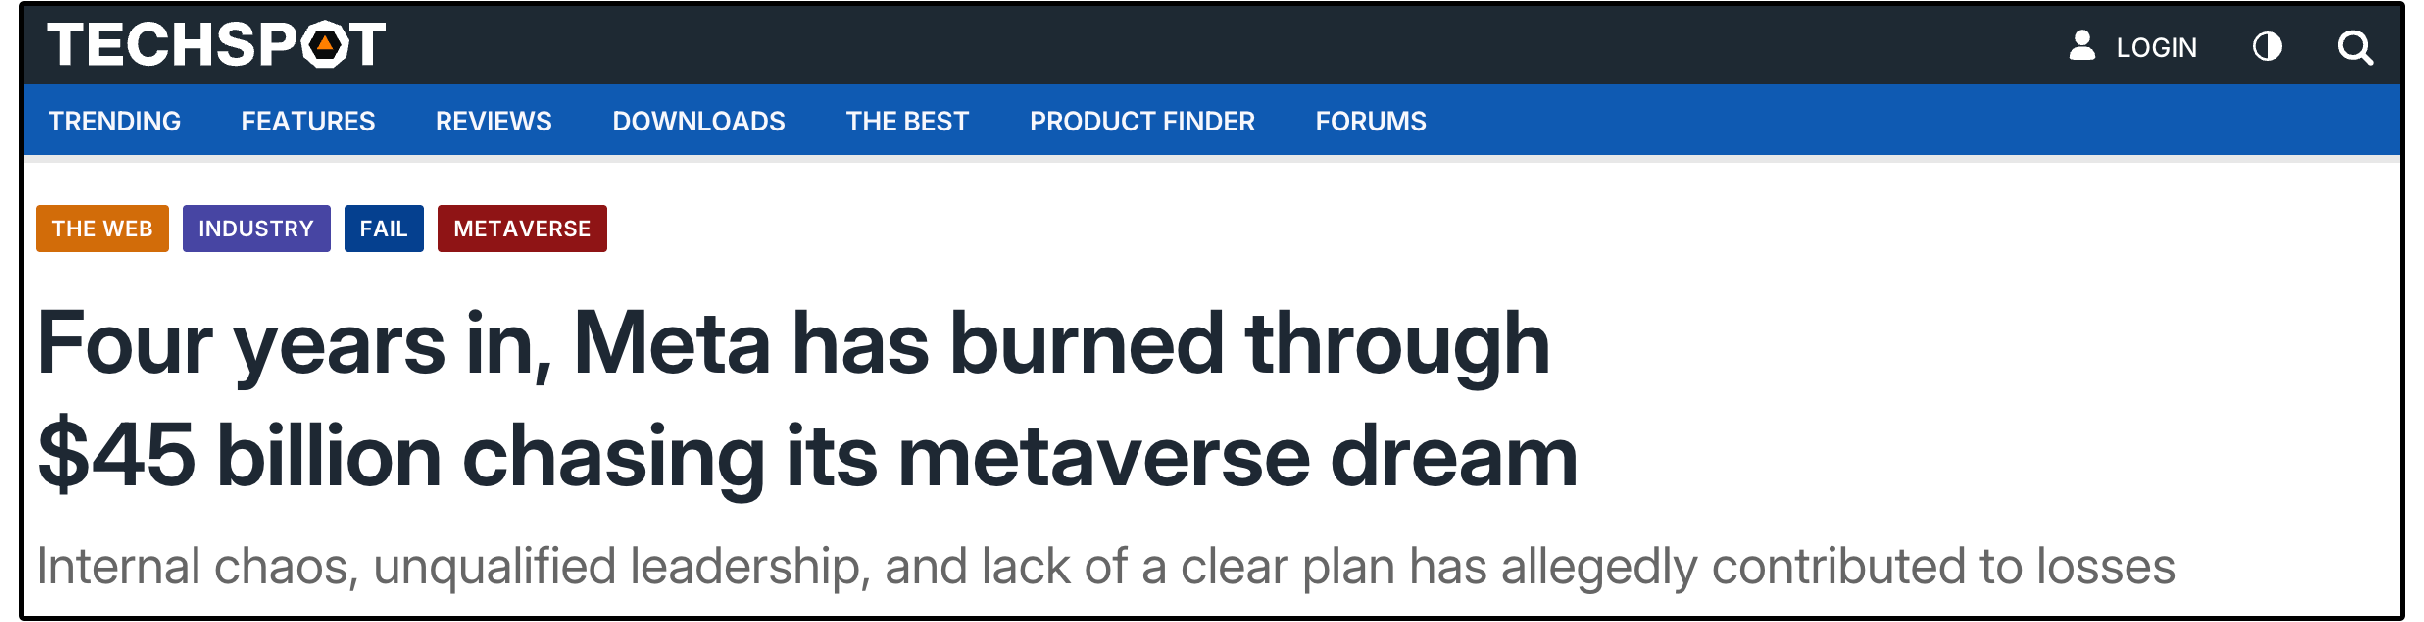
Over the prior four to five years, Meta burned through $45 billion trying to build Reality Labs, their metaverse division, which turned out to be unprofitable.
That’s $45 billion of capital deployed at returns well below their cost of capital (Remember, we need ROIC > WACC).
This is the critical point:
Even the best companies can destroy shareholder value if they reinvest too much capital into low-return projects.
If Meta would have paid out that $45 billion in dividends instead of reinvesting it into low ROI projects, it would have actually increased the company’s total return!
Proper capital allocation always maximizes shareholder returns.
📈 Our Dividend Growth Portfolio
We’ve now added 3 positions to our dividend growth portfolio, which members of Dividendology can view at anytime.
Next week, we will be making multiple additions to the portfolio.
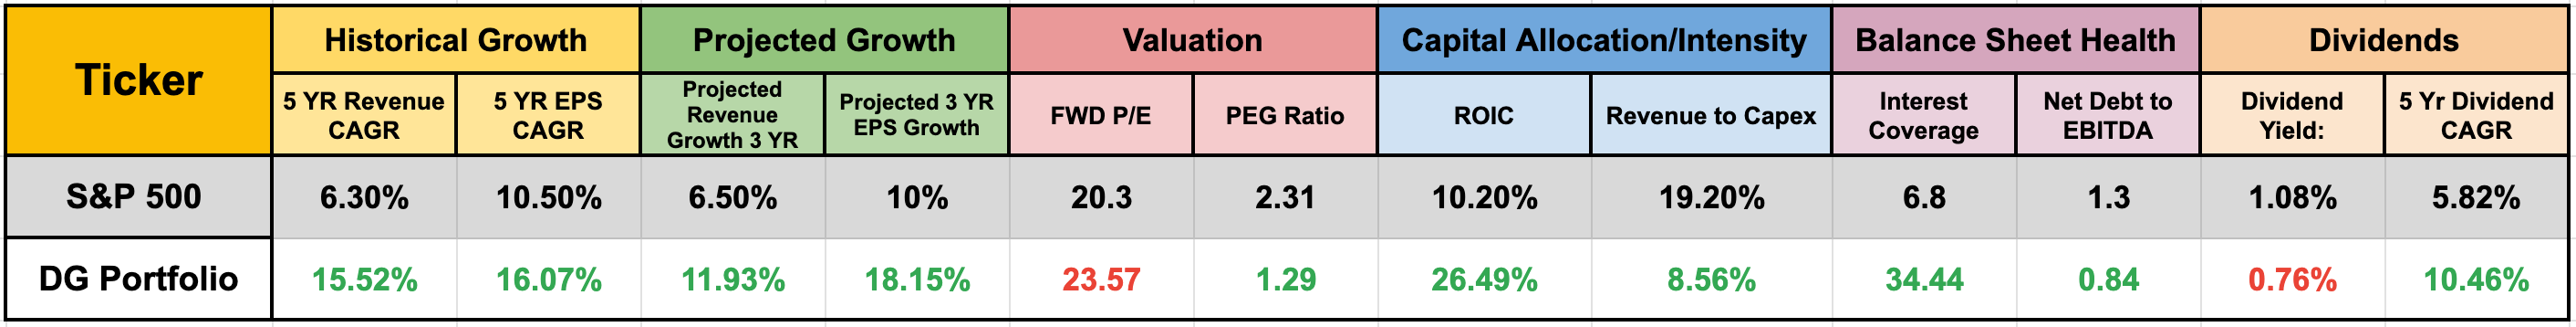
As you might suspect, our Dividend Growth Portfolio has an average ROIC that is significantly higher than the S&P 500.
We are still in the very early stages of building this portfolio, but relative to the S&P 500, our portfolio has:
Better historical growth
Better projected growth
Better valuation on a price to earnings growth basis
Better capital allocation
Better balance sheet health
Higher dividend growth
This is why I’m so excited about the formation of this portfolio over the long term.
Let’s now review each of these key metrics for every holding in the portfolio: