
📊 The Top High Yield Dividend Stocks!
Are the Dividends Safe!?

One of the first things beginner dividend investors get told-
“Don’t chase high yield.”
I’ve even heard some people state that a high yield equates to high risk.
This could not be further from the truth.
In reality, a stock or fund’s dividend yield tells us nothing about the sustainability of the dividend.
It’s the underlying fundamentals.

There are 5 main asset classes that typically have high yields:
💰 Covered Call ETFs
🛢️ MLPs (Master Limited Partnerships)
🏢 REITs (Real Estate Investment Trusts)
💼 BDCs (Business Development Companies)
🧾 Preferred Shares
The way we analyze the dividend sustainability for each of them is different.
Let’s look at an example of each.
1. 💰 Covered Call ETFs
Example: QQQI - NEOS NASDAQ-100(R) High Income ETF
Have you heard of QQQI?
The fund has only existed for around 16 months, but since then:
Yields 14%
Has outperformed the S&P 500
Won ETF.com’s “Best New Active ETF” award

According to their website, QQQI has 3 main goals:
📈Use NDX call options (both sold and bought) for income and potential upside
💰 Aims for tax efficiency by leveraging Section 1256 contracts (60/40 capital gains treatment)
🧠 Employs tax-loss harvesting to boost after-tax returns
But how do we assess the dividend sustainability of QQQI and covered call ETFs?
Many high-yield ETFs are just slowly liquidating themselves. Here’s why that’s dangerous:
Shrinking Net Asset Value → fewer assets to write call options → lower premiums → dividend cuts
QQQI’s net asset value has held up well (and even grown), which tells us:
Its yield is more sustainable
It’s not eroding capital just to fund distributions
This is the #1 thing most income investors miss.
You can learn more about QQQI by watching this video.
2. 🛢️ MLPs (Master Limited Partnerships)
Example: MPLX - MPLX LP Common Units
Have you heard of MPLX?
MPLX is a midstream energy partnership formed by Marathon Petroleum in 2012.
It operates pipelines, terminals, and storage across major U.S. basins, focusing on crude oil, refined products, natural gas, and NGLs.
MPLX generates stable cash flow through long-term, fee-based contracts.

A few things you need to know about MPLX:
MPLX’s business model is highly defensive, generating stable, long-term contracted cash flows through its midstream operations.
These contracts provide strong insulation from commodity price volatility.
The balance sheet is solid, with a 3.4x leverage ratio and a BBB credit rating.
But what about the dividend?
MPLX is currently yielding 7.41%
They have a 10 year dividend compounded annual growth rate of 9.56% (Wow!)
But how do we assess the dividend sustainability of MPLX and Master Limited Partnerships?
We look at the distributable cash flow (DCF) coverage ratio.
Formula: DCF Coverage Ratio = Distributable Cash Flow / Distributions PaidWhat to look for:
>1.2x = Comfortable cushion
<1.0x = Red flag; they’re paying more than they generate
The MPLX dividend is well-covered by distributable cash flow, with a current coverage ratio of 1.5x
On top of this, management made this statement in a recent earnings report:
We see a period of time where 12.5% is very doable. It’s tough to give you an extremely long horizon, but we certainly are trying to convey to you that distribution growth at 12.5% has the potential...to be durable for a period of time.
Not only do they expect their large payouts to be sustainable, they expect to grow them at a 12.5% annual growth rate!
An amazing combination of yield with dividend growth.
3. 🏢 REITs (Real Estate Investment Trusts)
Example: ARE - Alexandria Real Estate Equities
Have you heard of ARE?
Alexandria Real Estate Equities (ARE) makes money by owning and leasing high-quality lab and office space to life sciences, biotech, and pharmaceutical companies.
ARE generates stable, long-term rental income from tenants with strong credit, often through triple-net leases that pass operating costs to tenants.

Here’s a few things you need to know about ARE:
Adjusted funds from operations has grown every year for the last decade
The interest rates on ARE’s debt are locked in. So their interest rate risk is much lower than most REITs
ARE’s buildings are coming back into demand, as the AI-driven biotech boom starts to grow
ARE has an attractive 7.5% dividend yield and a 5% dividend growth rate-
But how do we assess the dividend sustainability of ARE and Real Estate Investment Trusts?
We don’t look at the payout ratio.
We don’t look at the free cash flow payout ratio either.
We look at AFFO (Adjusted Funds From Operations) payout ratio.
AFFO is the REIT equivalent of free cash flow.
Formula: AFFO Payout Ratio = Dividend per share / AFFO per shareWhat to look for:
<80% = Safe
80–90% = Acceptable
>90% = Risky, less cushion in downturns
It’s important to look at these metrics on a per share basis, as REITs typically dilute shareholders by issuing new shares to raise capital.
This is because REITs are required by law to payout 90% of their earnings in the form of dividends.
ARE has an AFFO payout ratio of 72.23%.
4. 💼 BDCs (Business Development Companies)
Example: MAIN - Main Street Capital Corporation
Have you heard of MAIN?
Main Street Capital is a Business Development Company (BDC), which means they generate income by lending to small and mid-sized private businesses at high interest rates and collecting interest income, fees, and sometimes equity stakes in return.

Here’s a few things you need to know about MAIN:
Pays monthly dividends + frequent special dividends
Never decreased its regular monthly dividend
Many loans are floating-rate, so higher rates = higher income = more special dividends
Since their IPO in 2008, they have a total return of 1,553%, vs the S&P BDC index sitting at -47.34%.
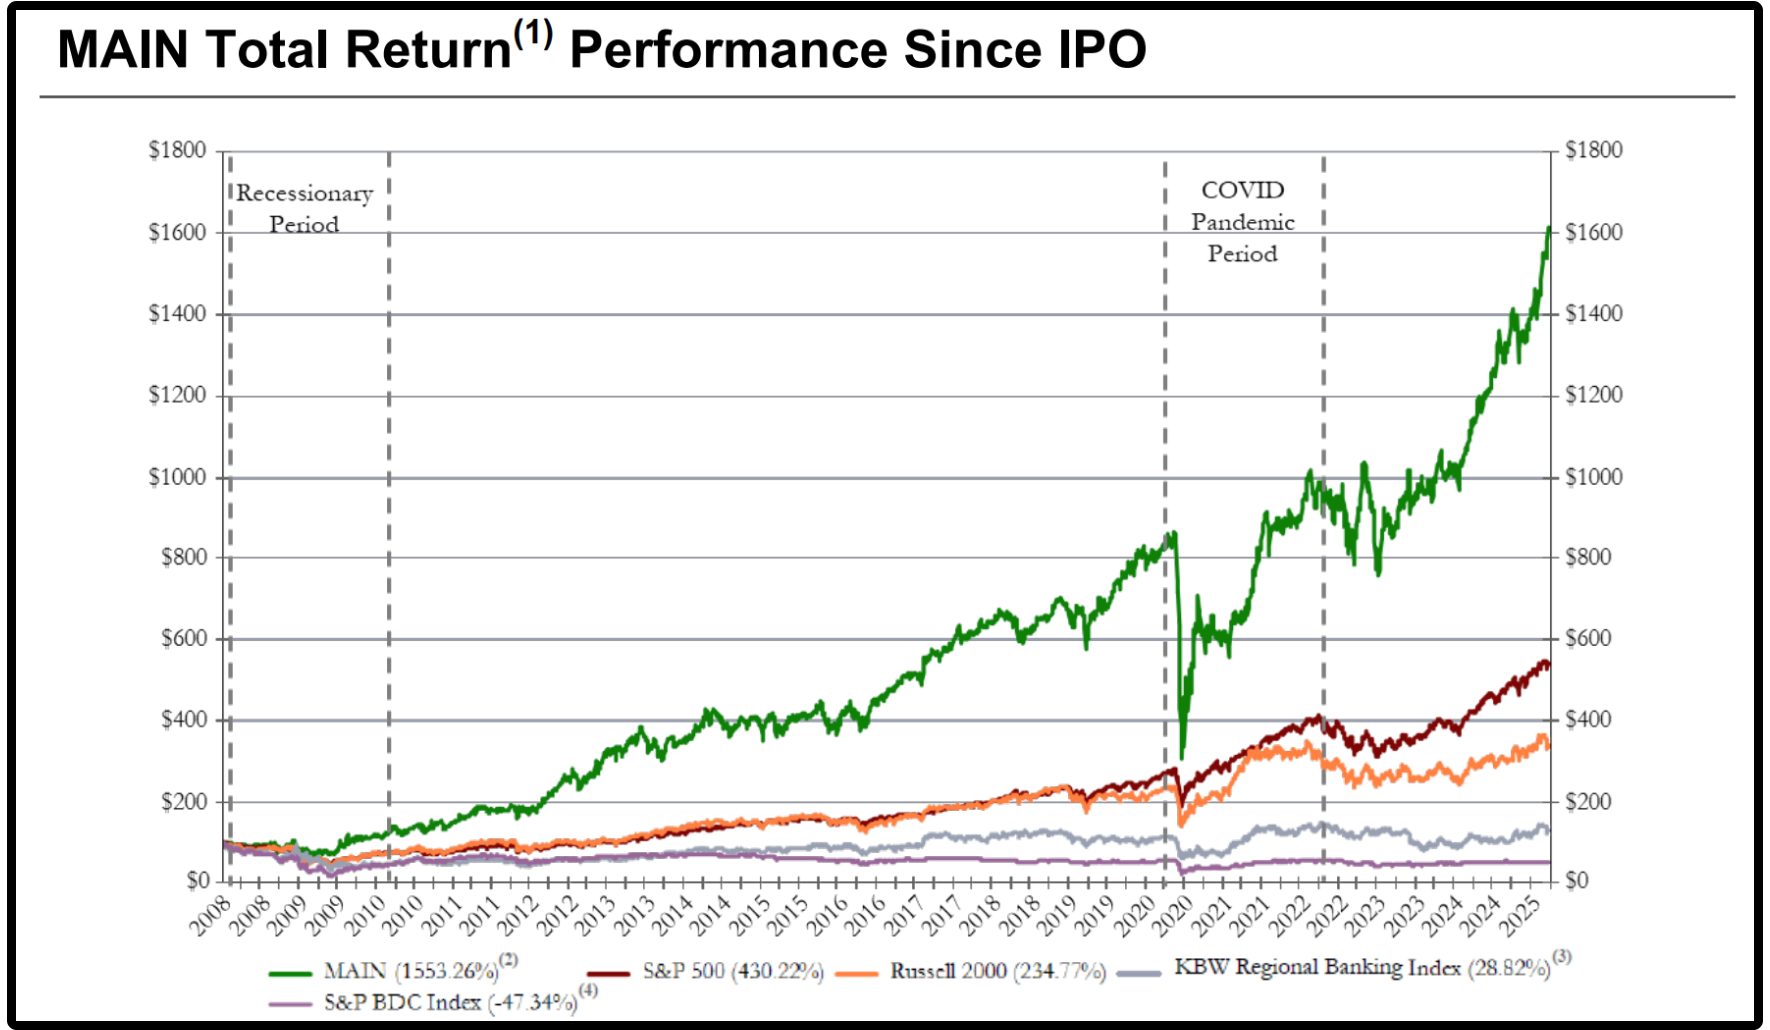
MAIN currently has a dividend yield of around 7.5%, with a 3 year dividend growth rate of over 5%.
But how do we assess the dividend sustainability of MAIN and Business Development Companies?
2 things we have to consider:
Dividend Coverage Ratio
Formula: Dividend Coverage Ratio = Net Investment Income (NII) / Dividends PaidTarget:
>1.0x = Covered
<1.0x = Risky
MAIN has a dividend coverage ratio of 1.42.
NAV Per Share
NAV (Net Asset Value) represents the per-share value of a BDC’s assets minus liabilities.
A BDC paying more in dividends than it earns can erode its NAV, which is a clear warning sign.
A rising NAV per share indicates that payouts are backed by real income, not unsustainable practices.
The strongest BDCs steadily grow NAV per share, signaling a sustainable dividend with the potential to grow.
Main Street Capital recently reported they expect record net asset value per share for the eleventh consecutive quarter.
5. 🧾 Preferred Shares
Example: PFFA - Virtus InfraCap U.S. Preferred Stock ETF
Have you heard of PFFA?
I’ll admit, I cheated on this one.
PFFA isn’t a preferred stock, but is an actively managed ETF that invests in U.S. preferred stocks.
Here’s what you need to know about preferred shares:
They oftentimes offer way higher dividend yields compared to common stock
Preferred shares are higher in the capital stack than common stock but lower than debt (in a bankruptcy, debt holders are paid first, then preferred shareholders, then common shareholders)
They generally have less price volatility than common stock but offer limited upside.
And here’s what you need to know about PFFA:
The fund currently yields around 10%, with monthly income payouts
It invests primarily in preferred stocks from high-quality issuers, many of which are investment-grade.
As an ETF, it provides built-in diversification, which helps reduce the risk of any one issuer defaulting.
But how do we assess the dividend sustainability of PFFA and Preferred Shares?
Dividend sustainability for preferred shares isn’t too different from a typical stock.
Look for the dividend coverage (payout ratio) of the underlying holdings, the credit quality of the underlying stock, and look for the underlying holding to grow earnings and free cash flow.
Preferred stocks may not offer as much upside as common stocks, but funds like PFFA offer high, consistent yield with lower volatility.
Looking for Yield? 🚀
Sure, there are plenty of "bad" high-yield stocks and funds out there.
But high yield doesn’t necessarily mean high risk.
If you know what to look for and where to look, you’ll find an abundance of high-yield opportunities, some of which even grow their dividend payouts at high rates over time.
Unfortunately, most software tools and websites fail to provide the vital data needed to properly evaluate the asset classes we discussed today.
That’s why I’m working on something BIG:
The Dividendology Database.
I’ve already personally invested over $10,000 in research and data, and spent hundreds of hours building the foundation of this tool.
You may have already gotten a sneak peek at the Covered Call ETF database I’m currently developing:

This includes critical information like option moneyness and portfolio options coverage, which is data that most websites and platforms don’t provide.
I’ll be expanding this sheet and building out even more in-depth databases for the other asset classes we covered today.
The goal?
To make sure you have a complete understanding of the income investment landscape and access to the data and research you need to choose the right vehicles for your strategy.
More exciting updates are coming soon… But I’ll leave it at that for now.
Check out these resources:
Tickerdata 🚀 (My automated spreadsheets and instant stock data for Google Sheets!)
Interactive Brokers 💰 (My favorite place to buy and sell stocks all around the world!)
Seeking Alpha 🔥 (Now currently running their Summer sale ($60 off!)
The Dividend Report 📊 (Free Newsletter for Straightforward Dividend Stock News)
Other News:
At the start of every month, I send out a newsletter to my paid newsletter subscribers with a list/spreadsheet of all the dividend stocks that I believe to be currently undervalued.
If you’d like to receive this sheet, you can sign up here:
That’s all for now!
See you next week!
Dividendology 🚀
Thanks man, you are awesome. Your newsletter worth millions and I will subscribe to the paid one now.
How about JEPI and JEPQ? Good/bad/awful?