


Ten popular companies recently hit 52-week lows. Warren Buffett built his fortune buying quality at a discount.
The best opportunities hide in plain sight, but only if you can see the full picture.
Carbon Finance visualizes the market with clean infographics you can read in five minutes.
Over 50,000 investors are seeing the data most people overlook.
Most importantly, they get it free every Sunday.
You don’t want to miss the next issue → Subscribe here now
Thanks to Carbon Finance for sponsoring.
💰 Which Income ETF is Best?
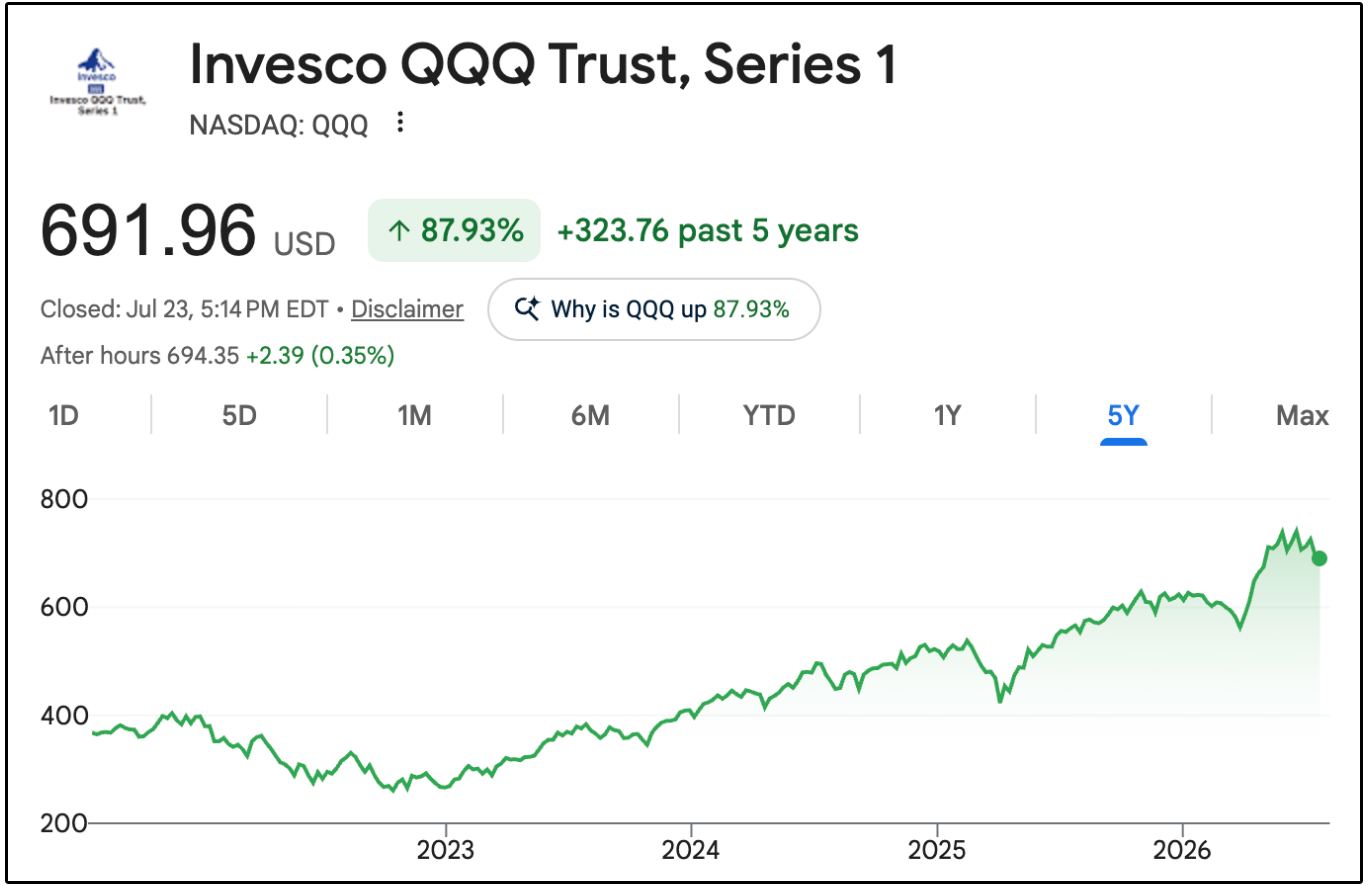
The tech heavy QQQ is up an astounding 87.93% in just the last five years.
While the majority of income investors don’t hold QQQ due to its lack of yield-
Many do own the option income ETFs that give them exposure to this index while providing 10%+ yields.
The three most popular as of right now are:
NEOS Nasdaq-100 High Income ETF (QQQI)
Goldman Sachs Nasdaq-100 Premium Income ETF (GPIQ)
JPMorgan Nasdaq Equity Premium Income ETF (JEPQ)
And while the funds may seem similar on the surface level, a closer look will reveal that these funds are built very differently.
Today, we will be deciding which of these High-Yield ETFs is best-
And why there is one ETF that I believe is better than all three.
💰Performance
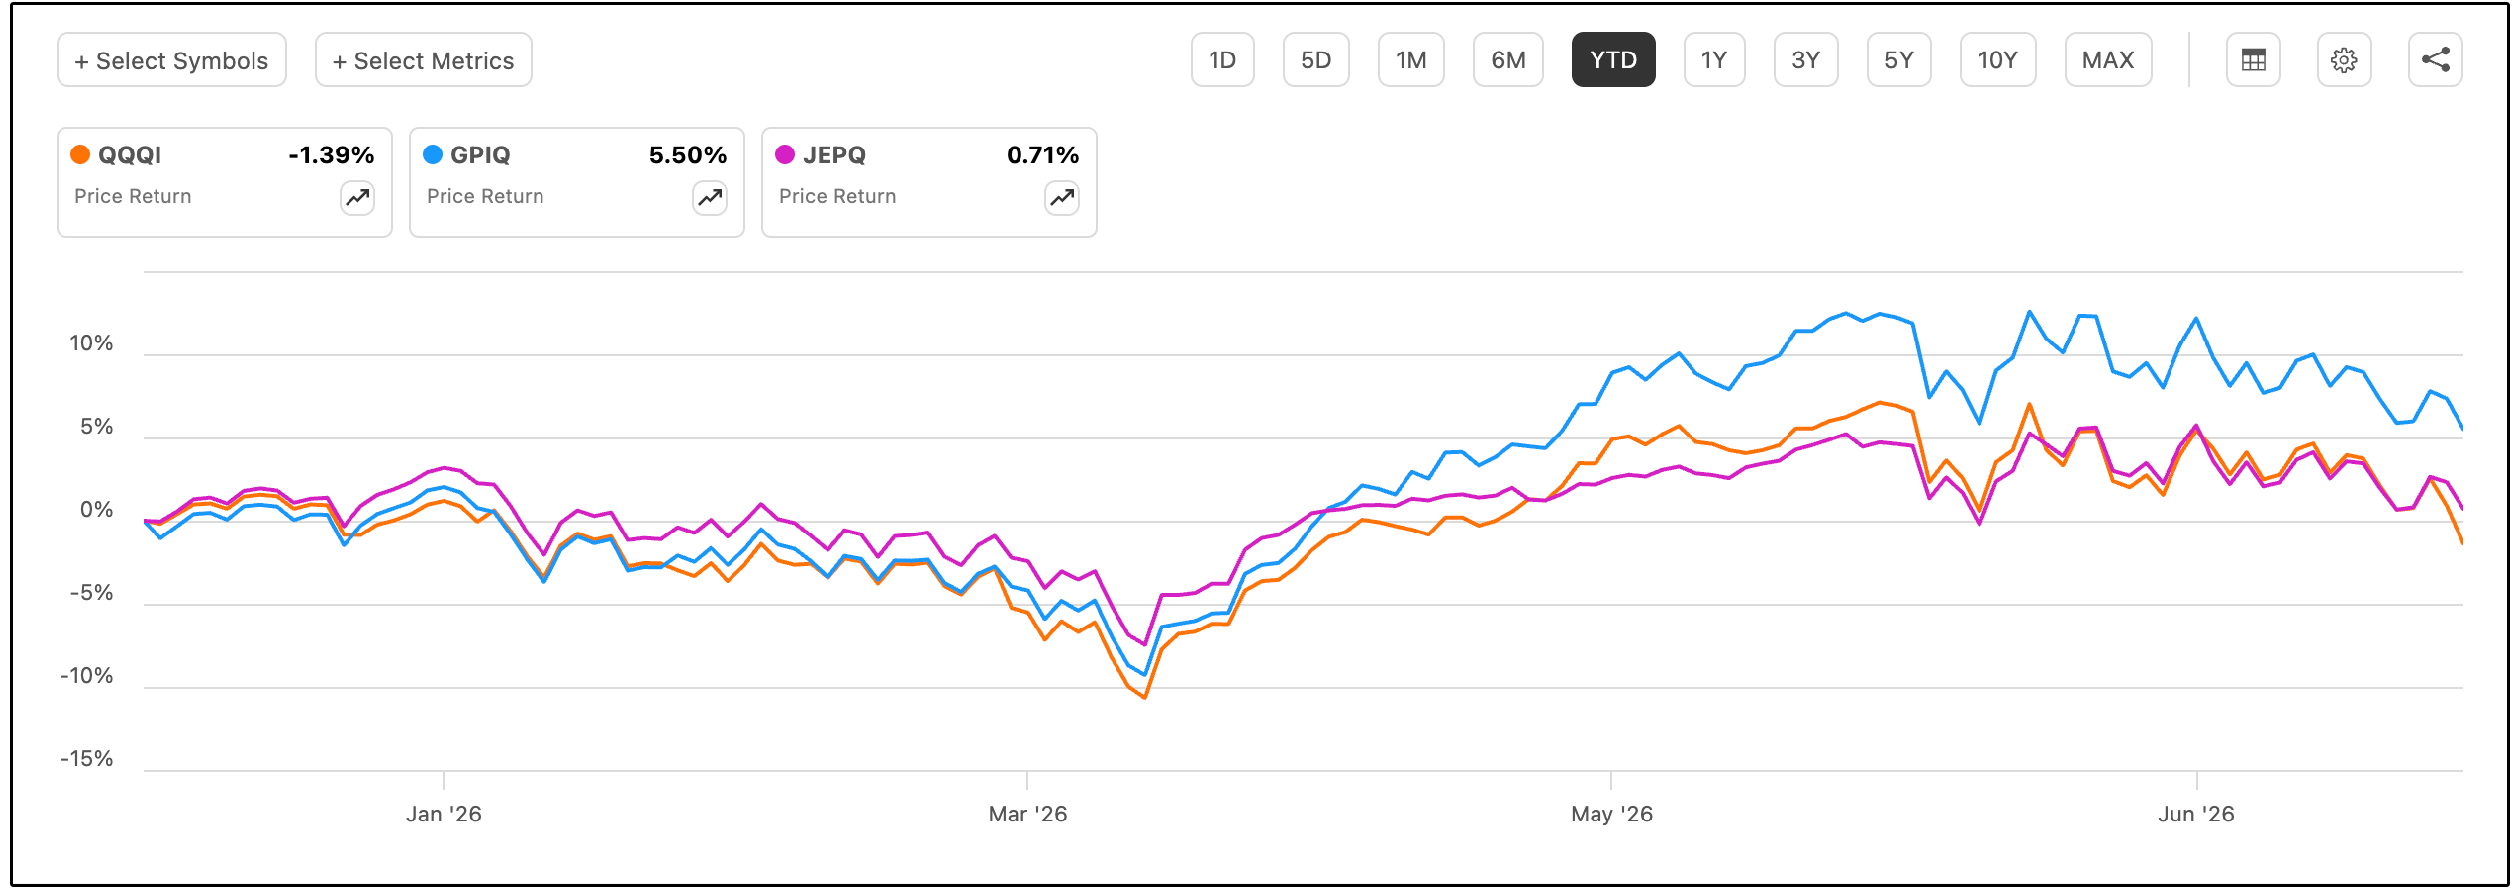
Let’s start by reviewing year to date returns for these funds.
As of right now, GPIQ is the clear leader out of the three.
But wait!
That’s just the price return.
The majority of the returns from these funds come from distributions.
So what do year to date returns look like from a total return perspective?
While all three get a significant boost to their returns, GPIQ is still the clear leader, with most of their outperformance coming after March.
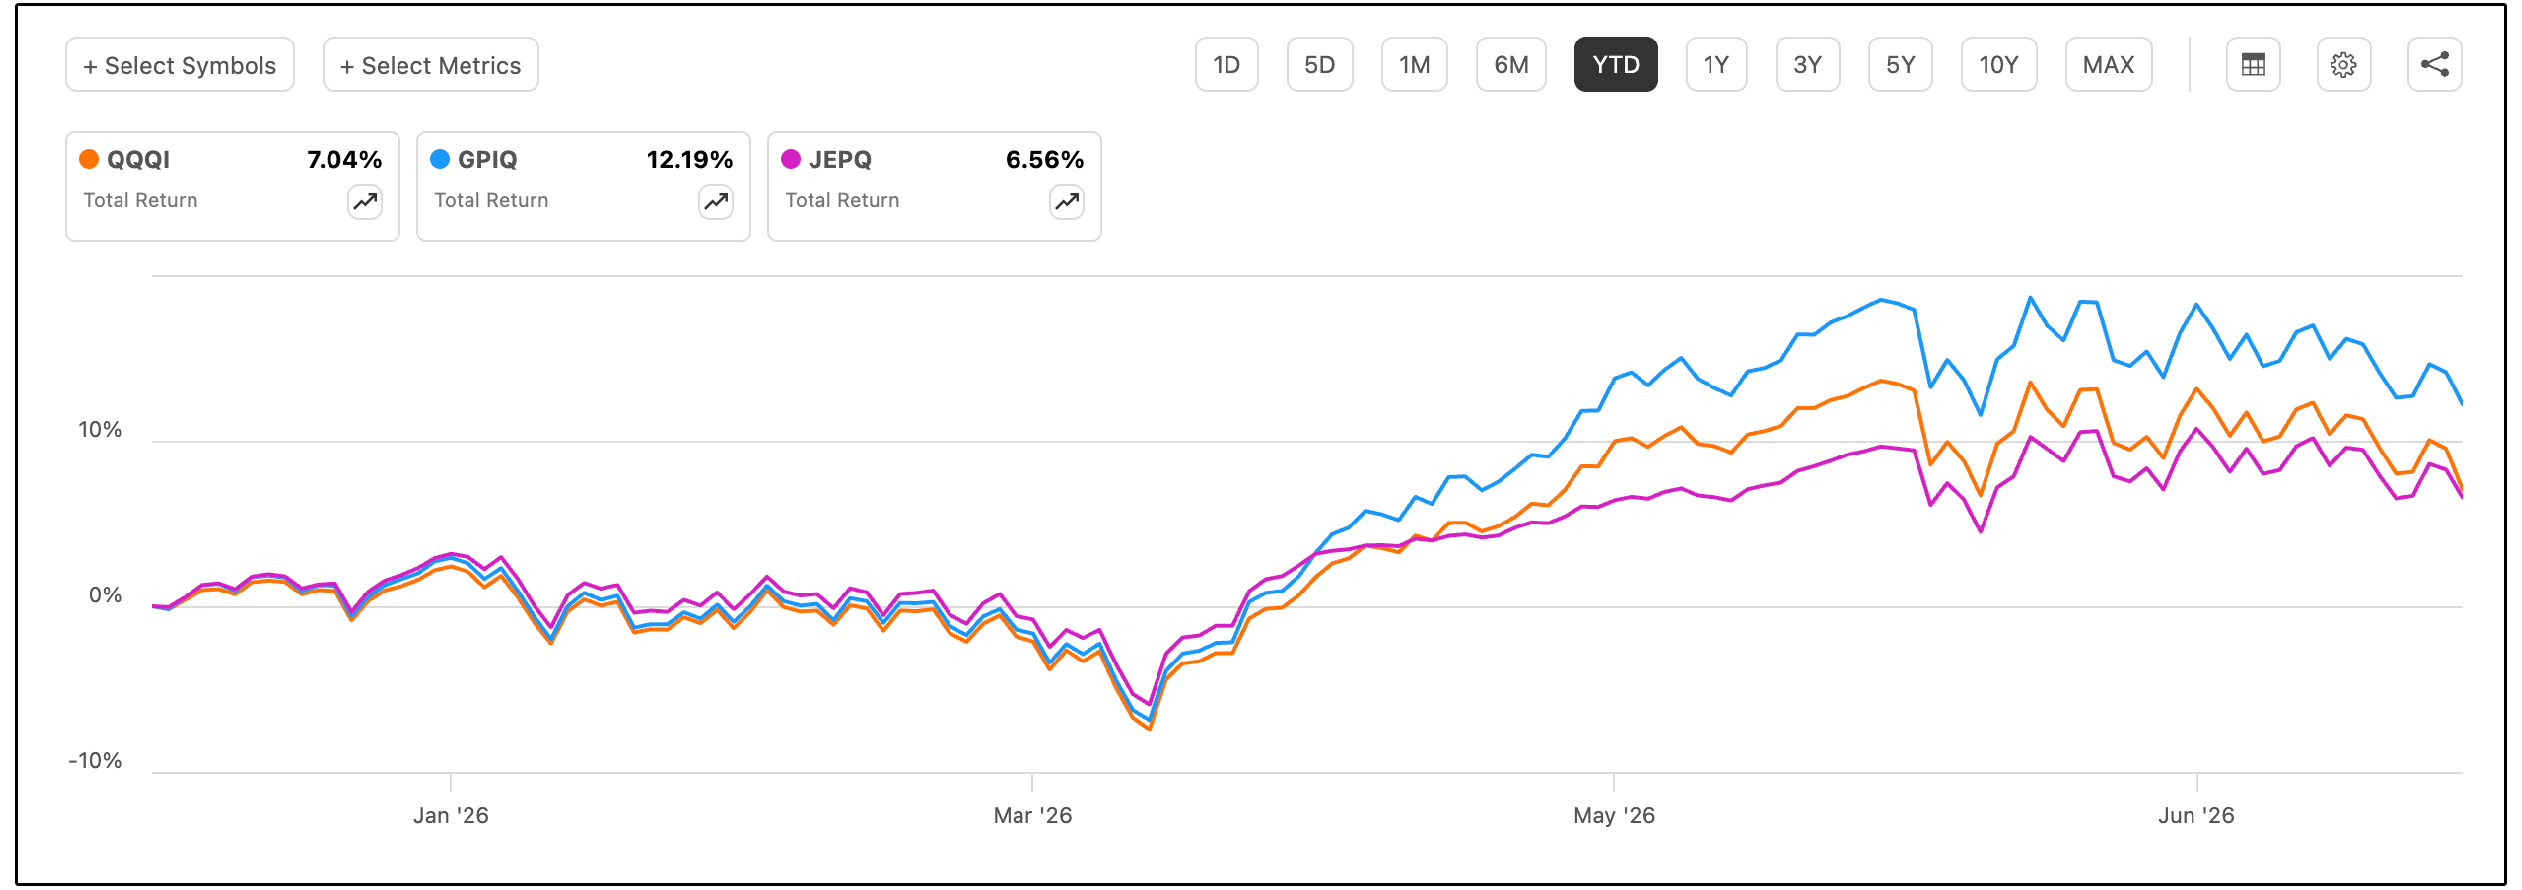
This outperformance coming after March is important to note, because it’s a result of the way these funds are structured-
But more on that in just a moment.
If we review the results over a one year time period, GPIQ again is the clear winner whether we look at just price performance or total return.
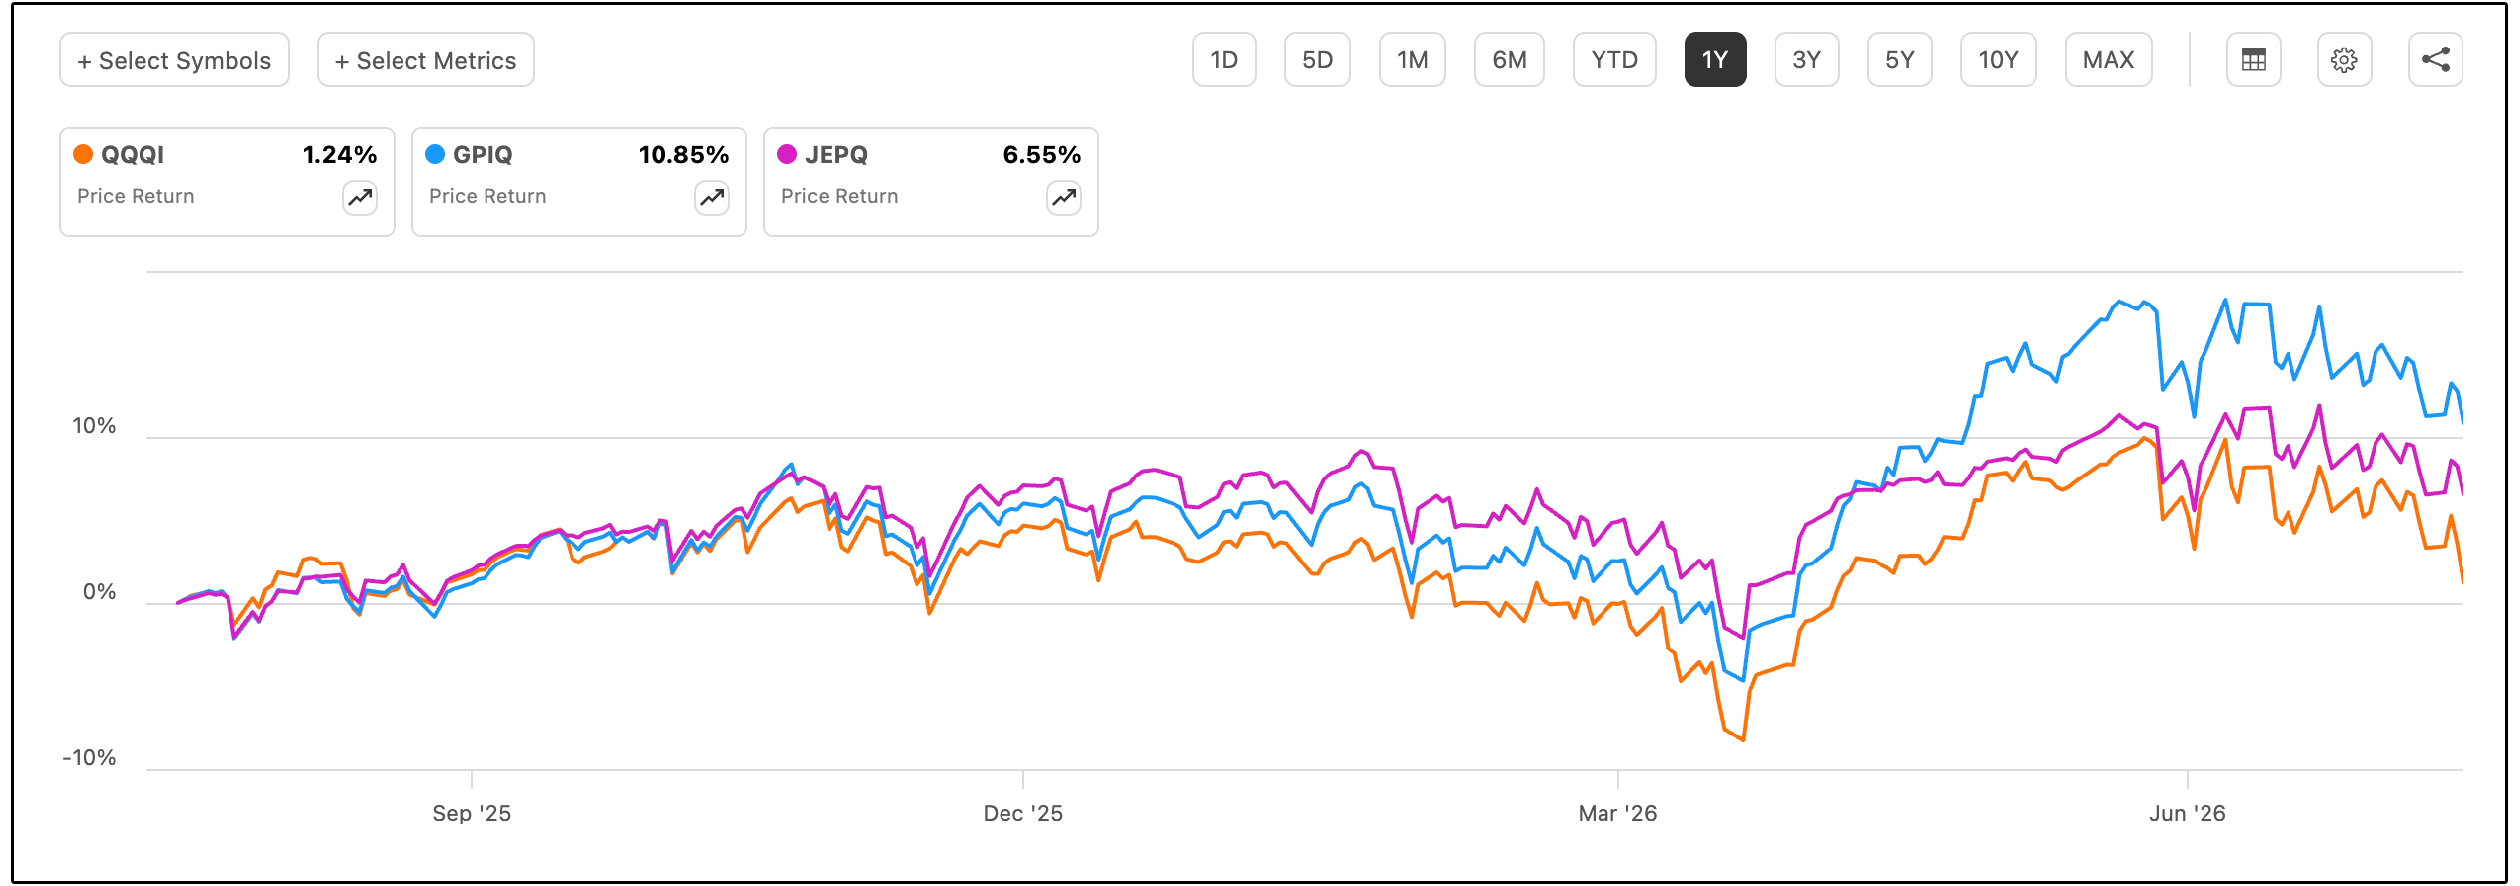
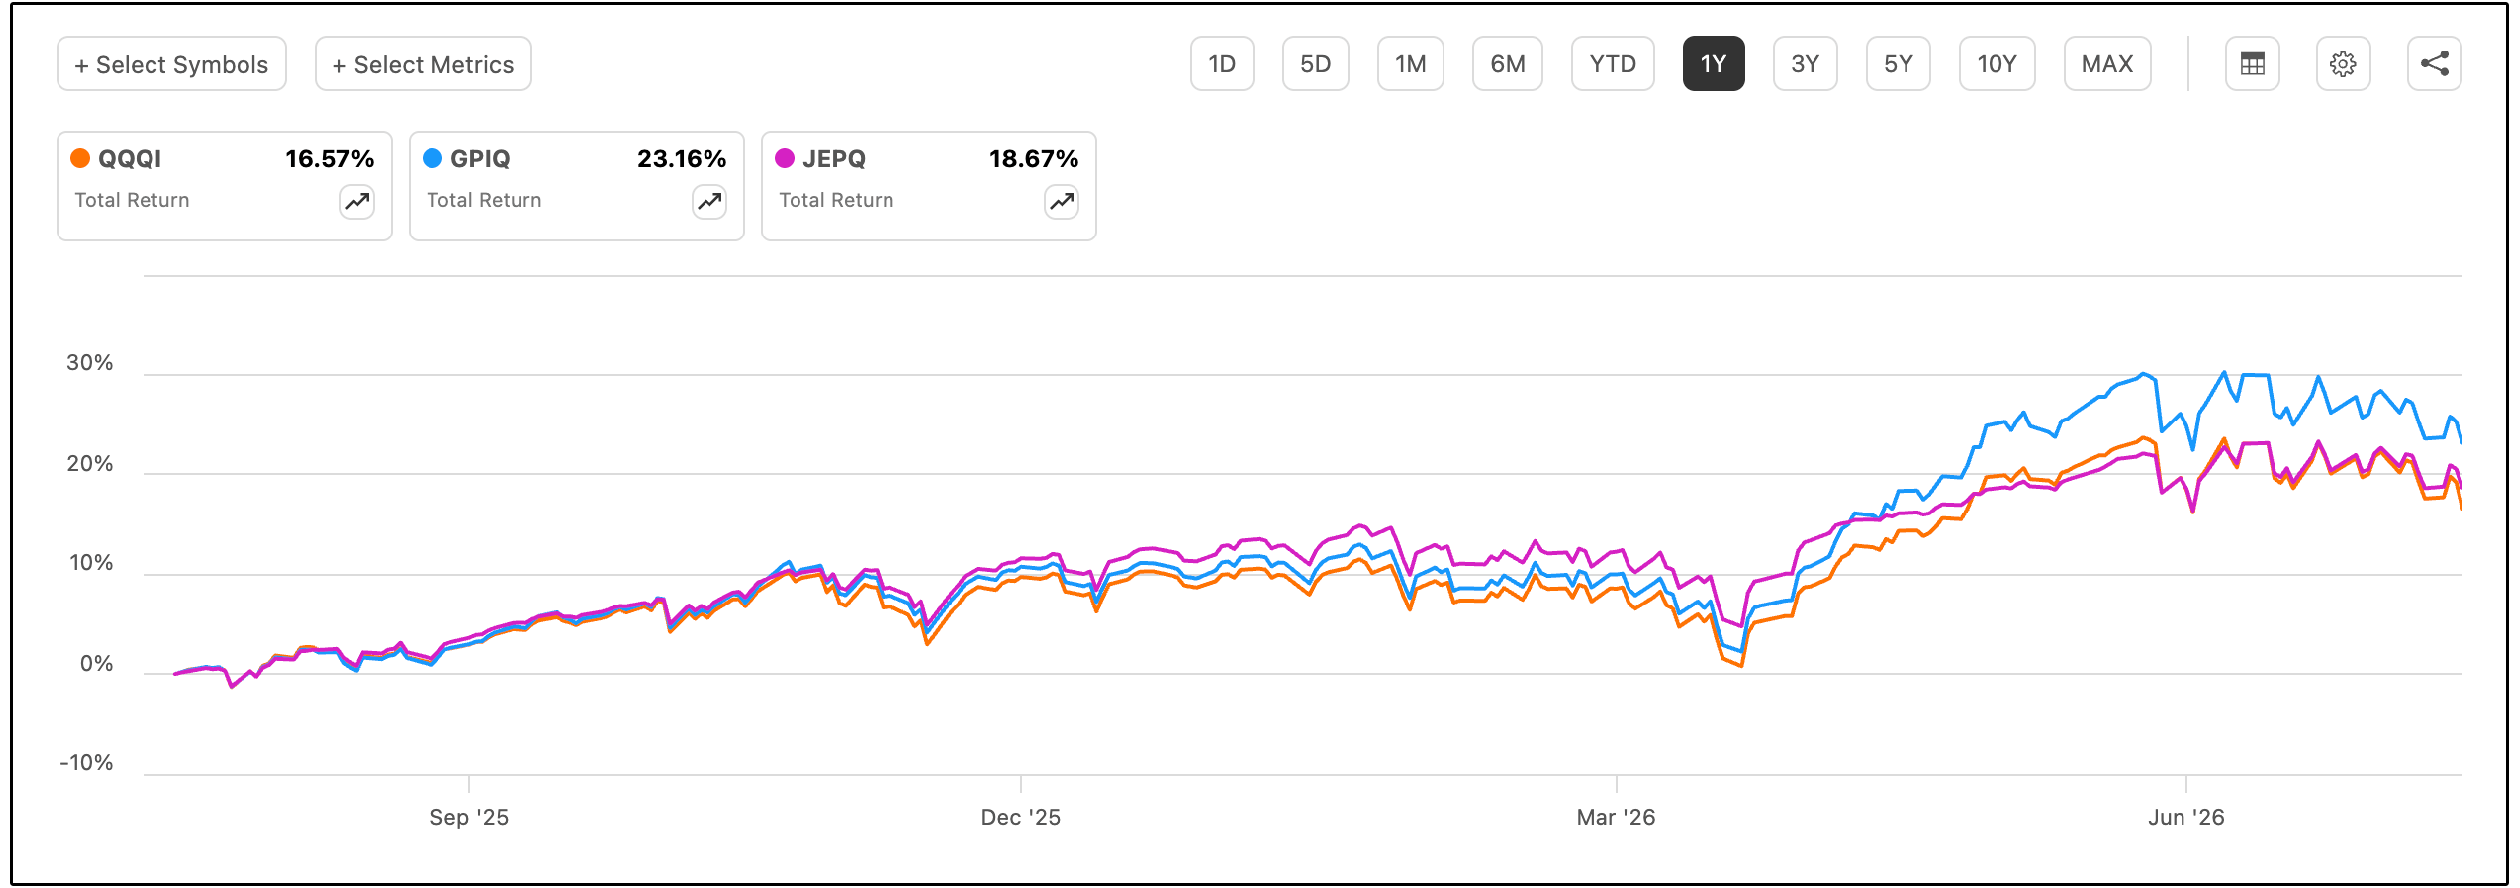
It’s important to note that these returns must be compared to the returns of QQQ, since that is primarily the underlying index these funds aim to track.
QQQ has a total return of 23.32% in the last year.
So perhaps the most important question is this:
“How much of the upside did each of these funds capture?”
QQQI: 71.1%
JEPQ: 80.1%
GPIQ: 99.3%
GPIQ has managed to capture nearly all of the upside over the last year.
And like mentioned above, this is completely due to the way these funds are structured-
And also plays a major role in the long term sustainability of their distributions.
So naturally, let’s evaluate the way these funds are structured to cause this difference in performance.
⚙️ Portfolio Options Coverage
Do you know what one of the most important metrics for Covered Call ETFs is?
Portfolio options coverage.
We discussed this in our Guide to Covered Call ETFs on Tuesday.
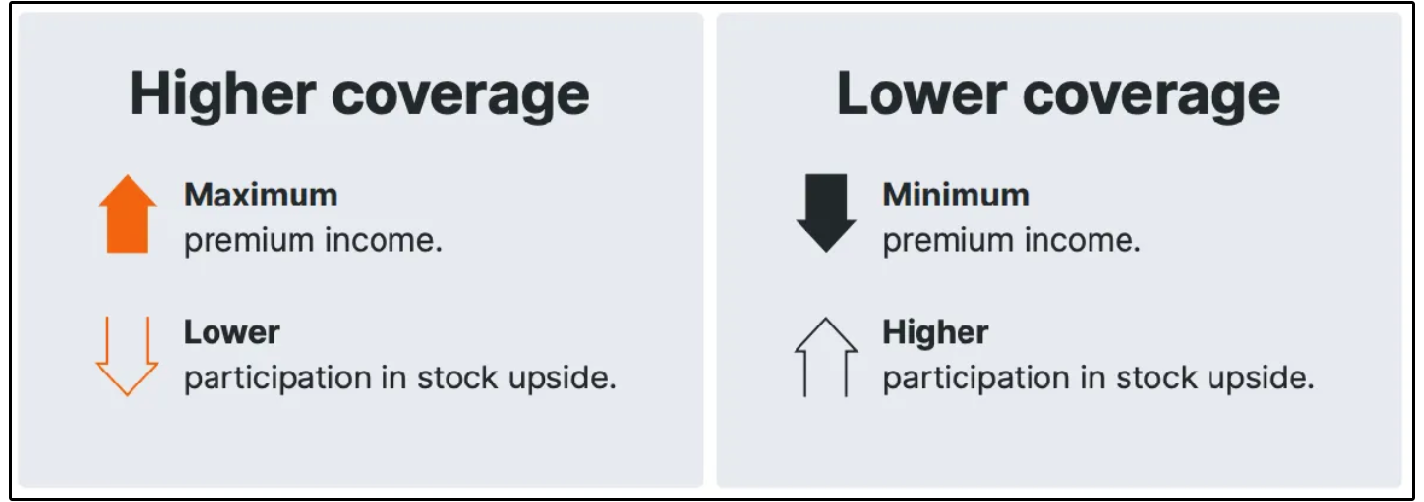
A strategy that writes options against a larger portion of its holdings can generally collect more premium income.
However, it may also retain less participation in the underlying asset’s upside.
A lower-coverage strategy typically generates less premium but allows investors to participate more fully if the asset appreciates.
Financial softwares don’t provide this data, so I’ve gone through ETF prospectuses and fact sheets to compile this data in the Dividendology Covered Call ETF Database.
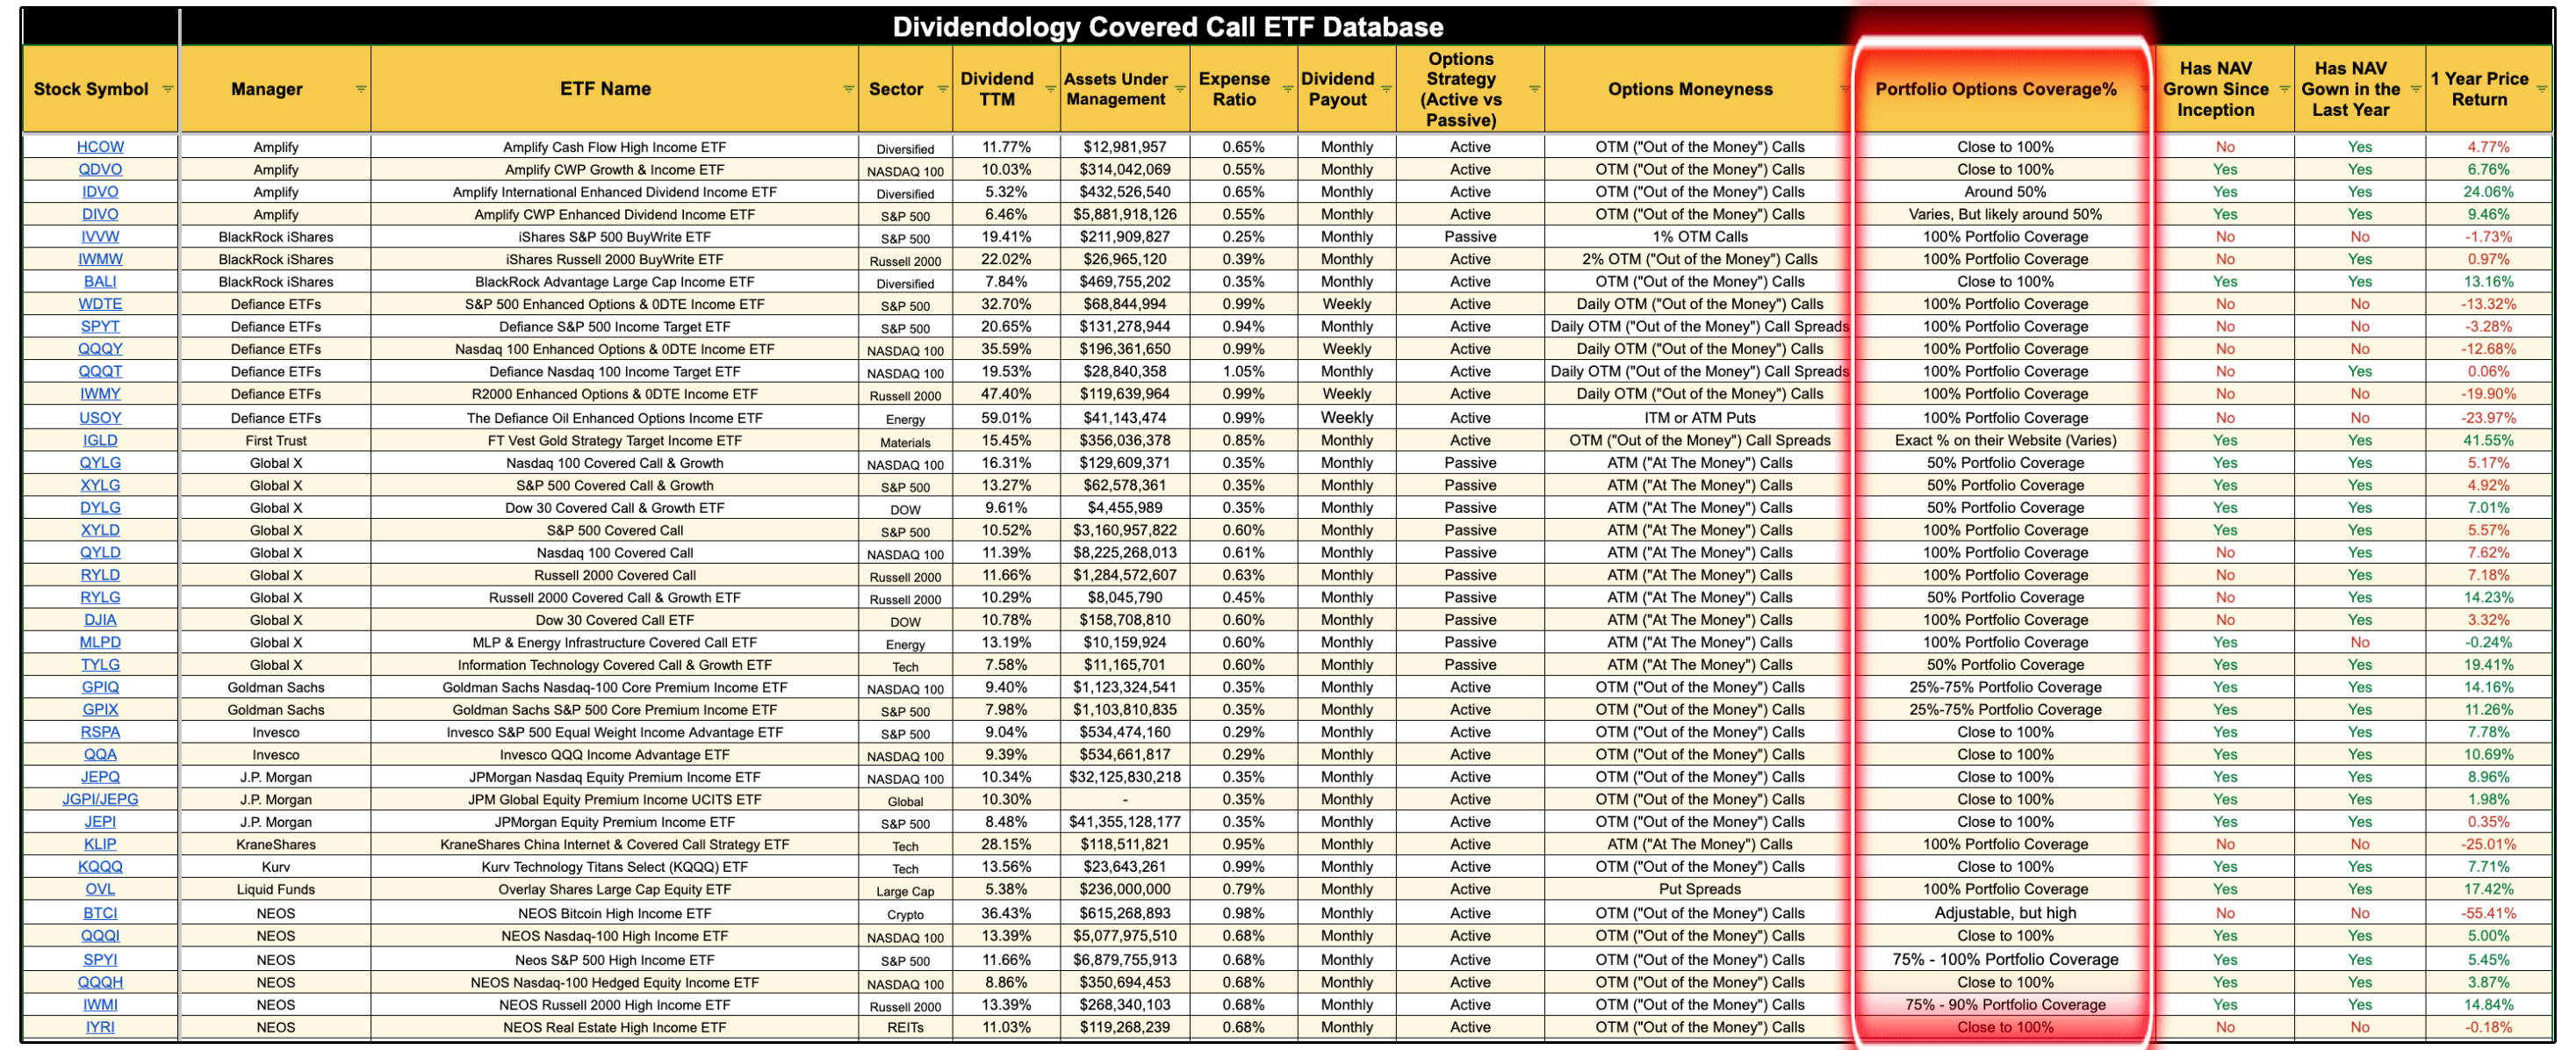
So what does the portfolio options coverage look like for our three ETFs in review?
QQQI: Close to 100%
JEPQ: Close to 100%
GPIQ: 25% - 75%
This data explains much of the performance gap between these ETFs.
Not only does it explain why GPIQ has outperformed its peers, but it also explains much of the distributions made by these ETFs.
💵 Distributions
Below is the portfolio options coverage, along with the trailing twelve month yield for each fund.
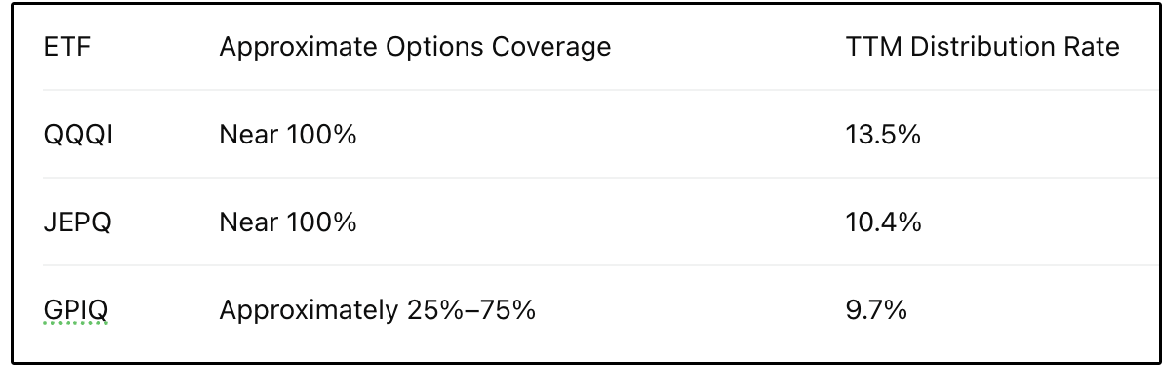
QQQI writes call options against nearly 100% of its portfolio.
Because more of the portfolio is covered, the fund can collect option premiums on a larger amount of assets.
Those premiums help support QQQI’s 13.5% trailing 12-month distribution rate, the highest of the three funds.
The trade-off is that more of the portfolio’s upside is exposed to being capped.
When the Nasdaq rises sharply, QQQI may have to surrender some gains because of the calls it has sold.
This is exactly what happened in late March/early April.
QQQI prioritizes maximizing income today versus maximizing capital appreciation potential.
JEPQ also maintains options exposure near 100%, however, you’ll notice its trailing distribution rate is lower than QQQI, at approximately 10.4%.
Why would this be the case if their portfolio options coverage is the same?
JEPQ uses an actively managed stock portfolio and generates options exposure through equity-linked notes.
Its results are influenced by the securities selected, market volatility, option pricing, portfolio positioning, and the exact terms of its options strategy.
Even though JEPQ covers a large portion of its portfolio, it may collect less premium than QQQI depending on factors such as:
The volatility of its underlying holdings
How far out of the money its options are written
The duration of the contracts
The timing of option sales
The fund’s active risk-management decisions
In theory, this should allow JEPQ to pursue a balance between income and reduced volatility rather than simply targeting the highest possible distribution.
However, you’ll also notice this causes their distributions to be substantially more volatile than their peers.

For the investor seeking predictable and stable income, that isn’t ideal.
GPIQ generally writes options against approximately 25% to 75% of its portfolio.
Because a smaller portion of the fund is overwritten, GPIQ collects less option premium than a fund covering nearly 100% of its assets, which explain why its trailing distribution rate is the lowest of the group at approximately 9.7%.
However, the lower coverage ratio leaves more of the portfolio uncapped.
When the Nasdaq rises, a larger portion of GPIQ’s holdings can participate in that appreciation.
As a result of a growing net asset value, it actually allows the fund to support higher distributions over time.
This is essentially what allows Covered Call ETFs to see ‘dividend growth.’
🧾 Taxes
One of the areas these ETFs differ the most is taxes.
Overall tax implications can vary dramatically for each individual-
However, I built out a model where you can change the variables to see what different tax implications could potentially look like for each of these ETFs.
Covered-call ETF payments can consist of several classifications:
Ordinary income
Qualified dividends
Long-term capital gains
Return of capital
Each category can receive different federal tax treatment.
Keep in mind, the tax classifications for the distributions has the potential to vary every month, and to a wide degree for some ETFs.
Based on the distribution classifications used in our model, substantial portions of QQQI’s and GPIQ’s distributions were classified as return of capital.
Return of capital is generally not taxed as current income when received.
Instead, it reduces the investor’s cost basis.
That can provide a meaningful tax-deferral benefit, especially for investors attempting to live on portfolio income in a taxable account.
However, return of capital is not permanently tax-free.
Because it lowers the cost basis, the investor may recognize a larger capital gain when the shares are eventually sold.
Once the cost basis reaches zero, additional return-of-capital distributions may also become taxable capital gains.
Using a hypothetical single filer earning $80,000 annually, our model produced dramatically different first-year federal tax estimates:
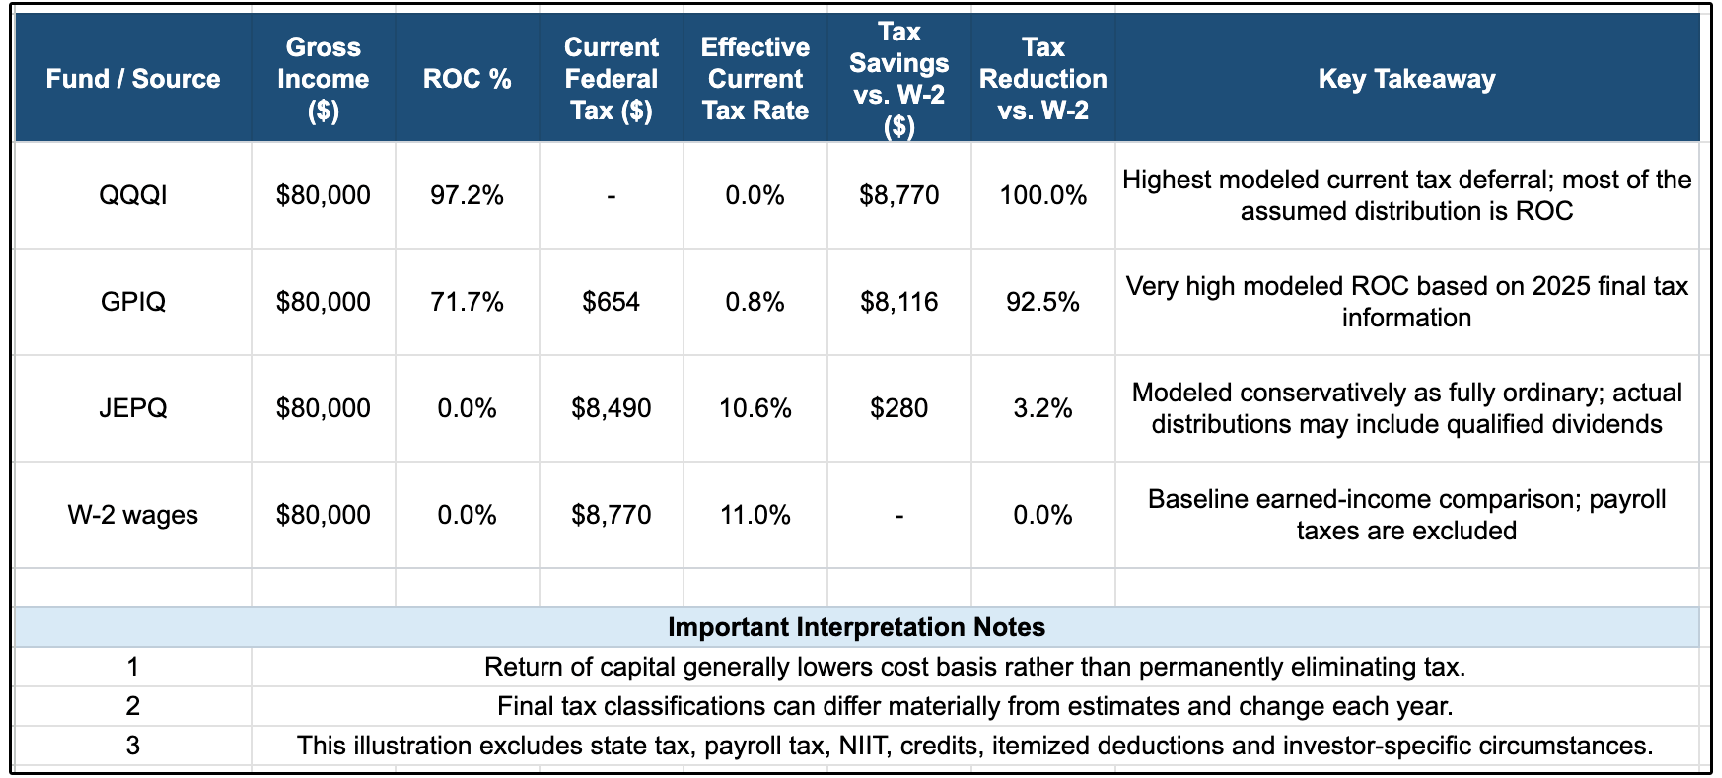
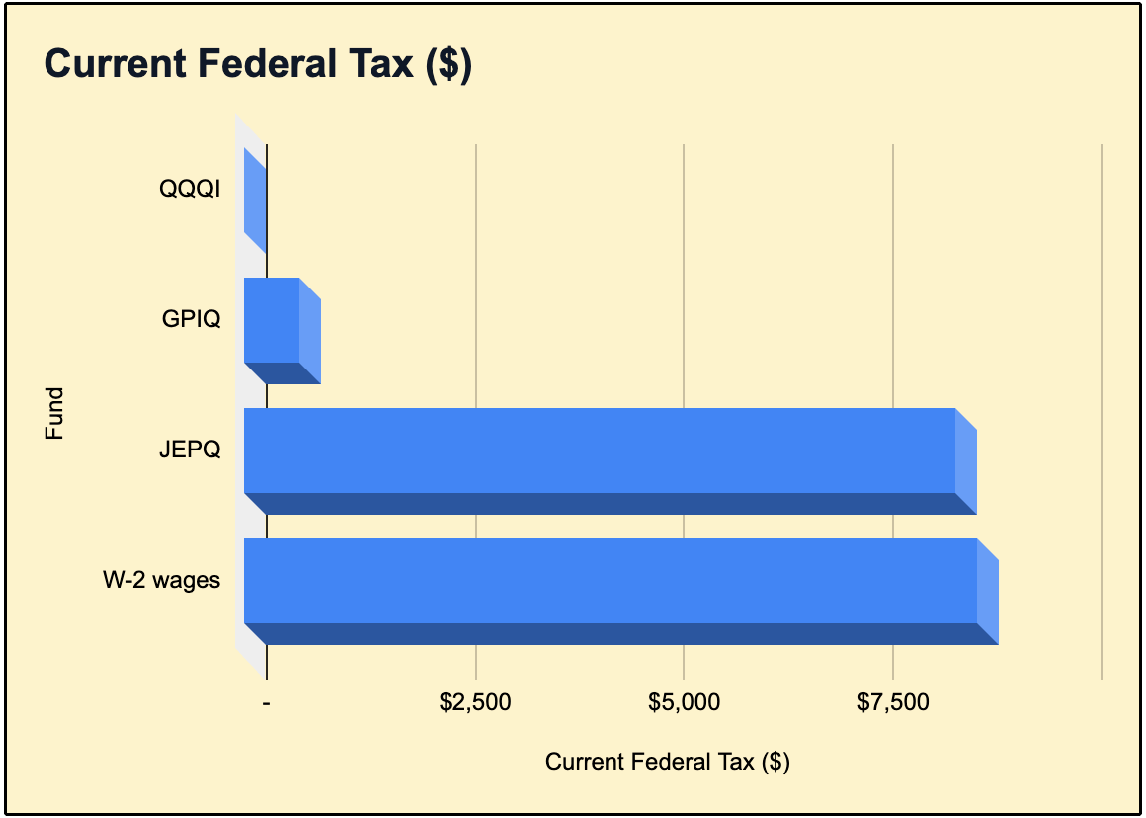
With a W-2 wage on an $80,000 salary, you would likely be paying around $8,770 in federal income tax.
$80,000 in distributions from any of these ETFs would result in less federal tax-
However, GPIQ and QQQI are substantially more tax efficient (at least in year one), potentially reducing your federal income-tax liability substantially in the modeled scenario.
You can get access to the tax sheet and input different variables here.
🏆 Who’s the Winner?
So which of these funds is best?
The reality (like almost always in finance) is that it depends.
Each fund (although similar) solves a different problem.
Here’s an in depth breakdown of the overall of strengths and weaknesses:
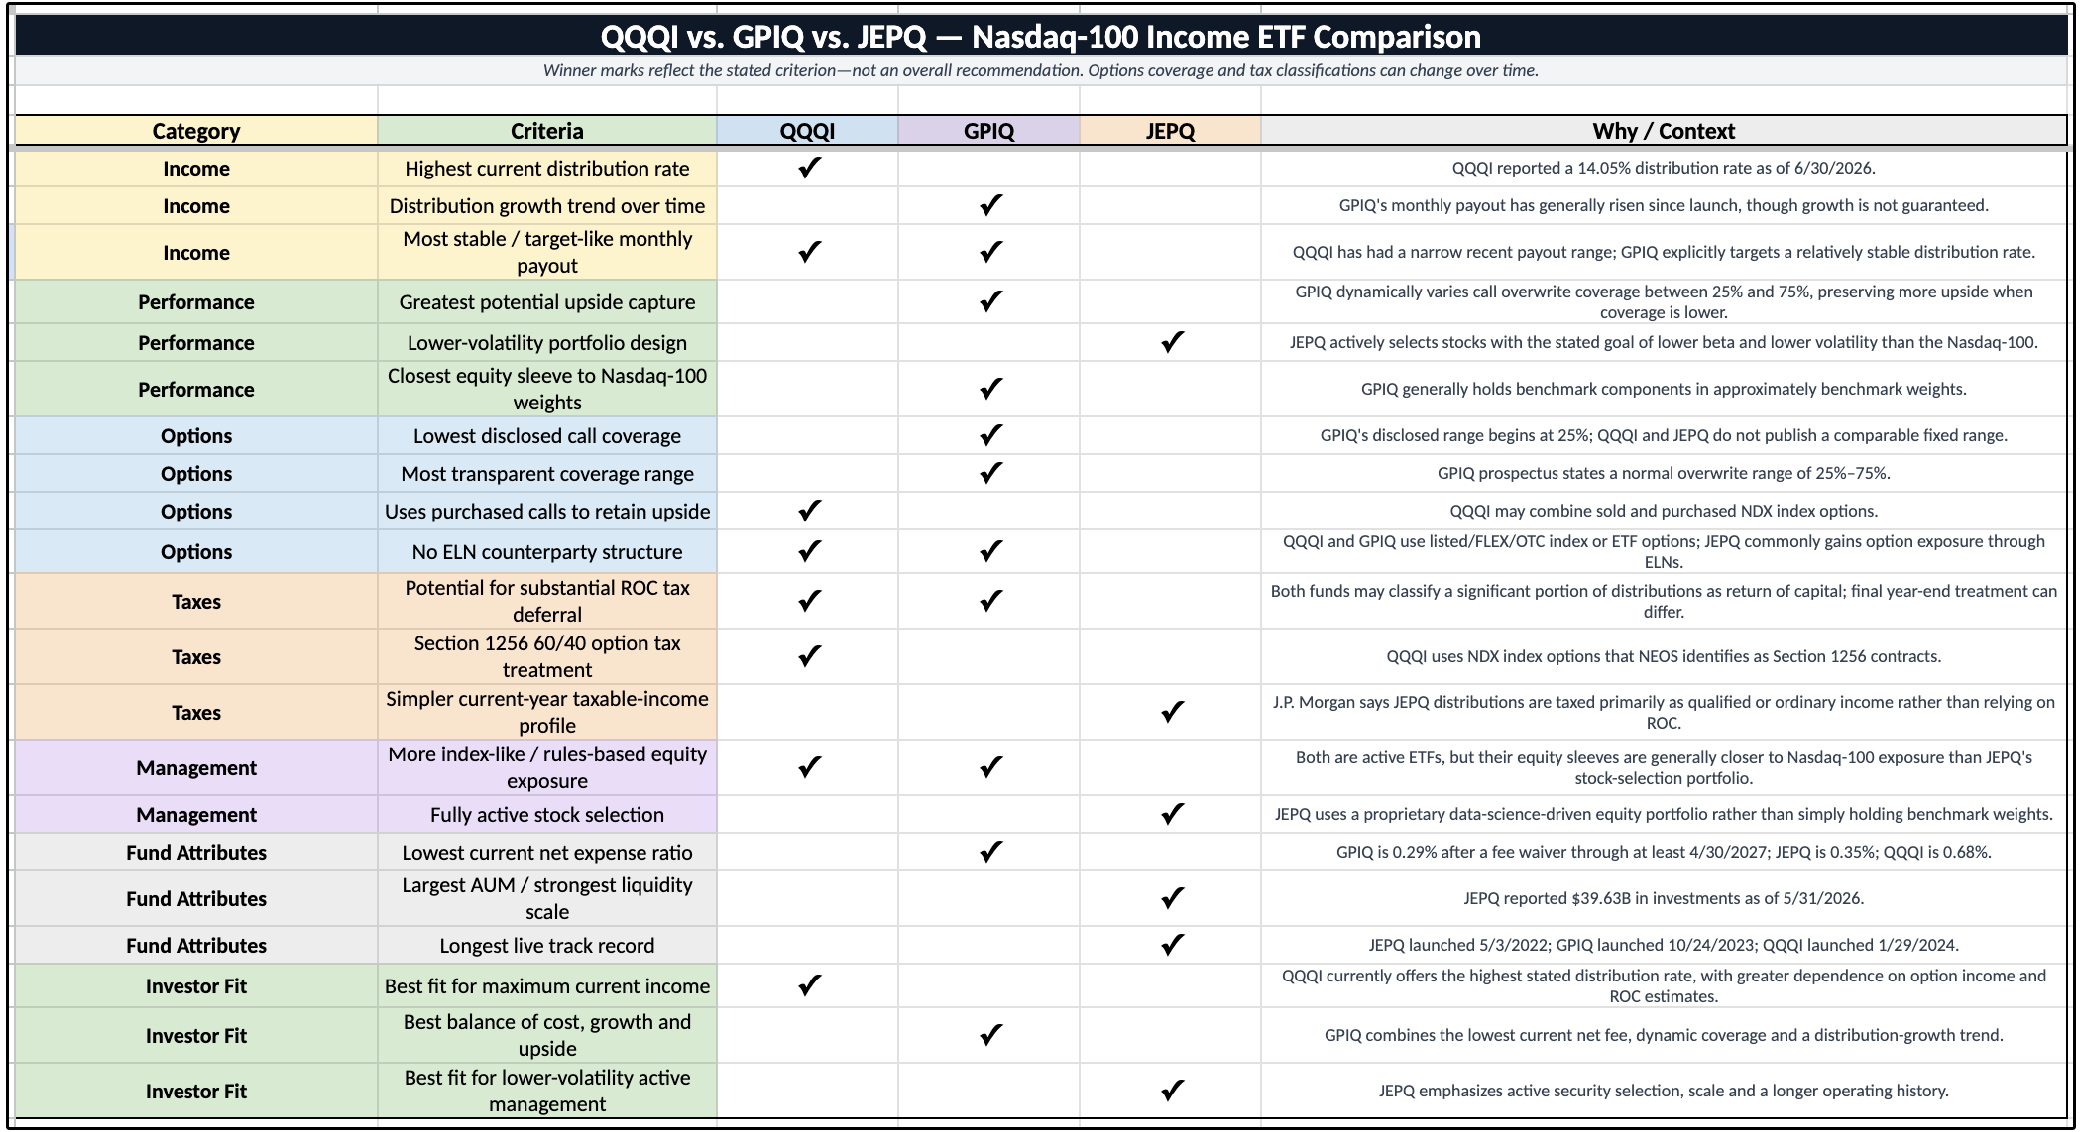
To simplify it as much as possible:
QQQI is best for maximizing income
GPIQ is best for balancing growth and income
While JEPQ may be less volatile, the fluctuations in distributions and lack of growth make it less appealing than the other two for most investors.
However, we don’t own any of these funds in our High Yield Portfolio on Dividendology.com.
Instead, we’ve elected to own one Covered Call ETF that is radically different in nature to these ETFs.
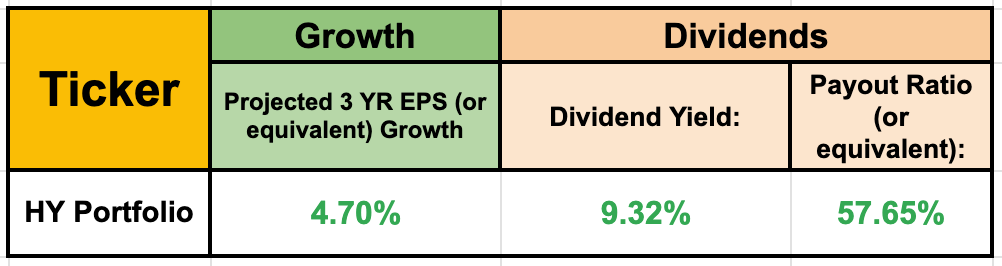
As a result, our portfolio has outperformed in 2026, while offering a sustainable yield of over 9.3%.
This ETF has been able to:
Yield 11%+
Grow distributions
Grow net asset value
Let’s briefly review this ETF, as well as our outperforming High Yield Portfolio: