Why The P/E Ratio is Lying to You. ❌
Don't Make the Mistake of Believing the Lie!
Ever had someone lie to you? (Of course you have)
It can make it difficult to trust them again.
The same is true for metrics we rely on in investing.
One of the biggest culprits?
The Price-to-Earnings (P/E) ratio.
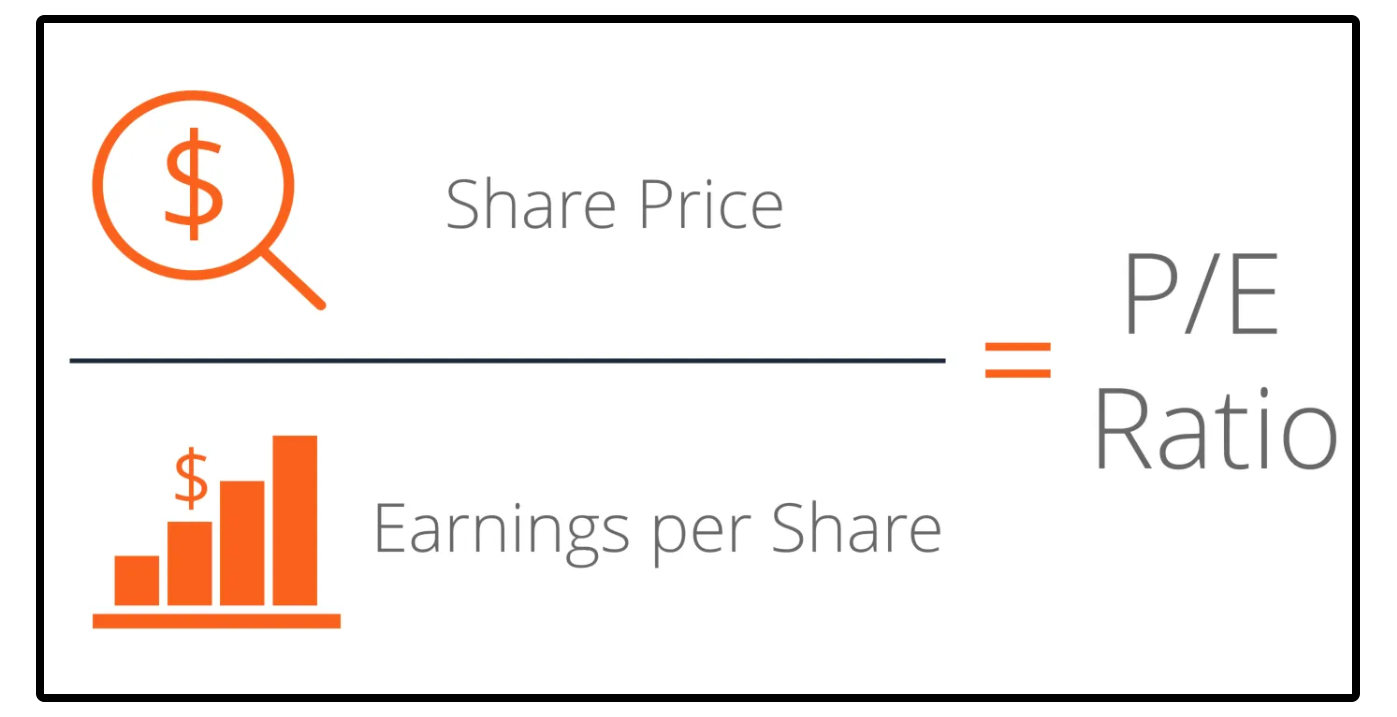
The metric is a company's stock price divided by its earnings per share.
Example:
Imagine a company has the following data:
Stock price: $50 per share
Earnings per share (EPS): $5
P/E ratio = Stock Price ÷ Earnings Per Share
P/E ratio = $50 ÷ $5 = 10
This means investors are willing to pay $10 for every $1 of this company’s earnings.
At first glance, the P/E ratio seems like a straightforward way to measure whether a stock is cheap or expensive.
But unfortunately, it is true-
The P/E ratio can lie to you, and it happens more often than you think.
Here are 4 ways the PE ratio can lie to you. 👇
1. Earnings Are Artificially Inflated 📈
Sometimes, a company’s earnings are temporarily boosted by one-time events.
These non-recurring gains make the P/E ratio appear artificially low, suggesting the stock is undervalued when it’s not.
Example:
General Electric: GE’s P/E ratio looked attractive after it sold major assets in 2018 (temporarily boosting earnings), but the underlying operations were actually struggling.
What to Do: Look at operating income and free cash flow to assess true profitability.
2. Earnings Are Temporarily Depressed 📊
A company’s earnings can be unusually low due to temporary setbacks, making the P/E ratio skyrocket. This can scare investors away from stocks that might actually be bargains.
Example:
Oil Stocks During COVID-19: When the pandemic hit in 2020, global oil demand plummeted, and companies like ExxonMobil (XOM) and Chevron (CVX) saw their earnings collapse. This caused their P/E ratios to spike dramatically, even though the decline in earnings was temporary.
What to Do: Analyze the company’s earnings history and understand whether the challenges are cyclical or structural.
3. Growth Companies with Minimal Earnings 🚀
High-growth companies often reinvest heavily, leaving little to no earnings on the books. This results in astronomical P/E ratios that make the stock appear absurdly overvalued.
Example:
Amazon: In 2023, Amazon traded at an eye-popping P/E ratio of 250—17 times higher than the historical average of 15 for the stock market. However, that P/E ratio was heavily skewed by non-operating results. For example, Amazon's significant investment in Rivian, an electric truck maker, led to paper losses when Rivian’s stock plummeted. These losses reduced Amazon's earnings by $2.7 billion, making the P/E ratio look much worse than the health of its underlying business.
What to Do: Evaluate the company’s growth potential and operating cash flow metrics.
4. Accounting Distortions 💰
Accounting choices can significantly impact reported earnings, making the P/E ratio unreliable.
Examples:
Boeing (BA): Boeing’s earnings were skewed by restructuring charges during the 737 MAX crisis, inflating its P/E ratio.
What to Do: Focus on free cash flow!
The P/E ratio is a useful tool-
But it can sometimes lie.
Investing isn’t about making decisions or making assumptions based on one metric.
It’s about understanding the whole picture of the underlying business.
Check out these resources:
Tickerdata 🚀 (My automated spreadsheets and instant stock data for Google Sheets!)
Interactive Brokers 💰 (My favorite place to buy and sell stocks all around the world!)
Seeking Alpha 🔥 (My favorite investment research platform!)
The Dividend Report 📊 (Free Newsletter for Straightforward Dividend Stock News)
At the start of every month, I send out a newsletter to my paid newsletter subscribers with a list/spreadsheet of all the dividend stocks that I believe to be currently undervalued.
If you’d like to receive this sheet, you can sign up here:
That’s all for now!
See you next week!
Dividendology 🚀


Love the article but I would suggest that maybe “lie” is the wrong word to use. The P/E was correct in every situation but just didn’t tell the whole story. When the current P/E is super inflated, it stands out for people to look deeper. Your point is spot on though. Do not rely on one metric only. Gotta do that deep dive. Keep up the good stuff!
PE also tells a different story on different sectors.
PE could be seen as an amount investors are willing to pay for the stock, like you described.
For example if a hyped tech stock has 70 PE, it is pretty high.
But on slow sectors, Consumer staples or mining, PE could indicate how many years it takes to earn invested money back.
70 PE is a disaster In that scenario 👀