
🚀 3 High Yield Covered Call ETFs Growing NAV!
How to Generate 25%+ Yields! 💥

I’ve been building out one of the largest databases on Covered Call ETFs for the last 9 months-
And the results have been shocking.
The vast majority of these investments have proven to be value destructive-
But not all.
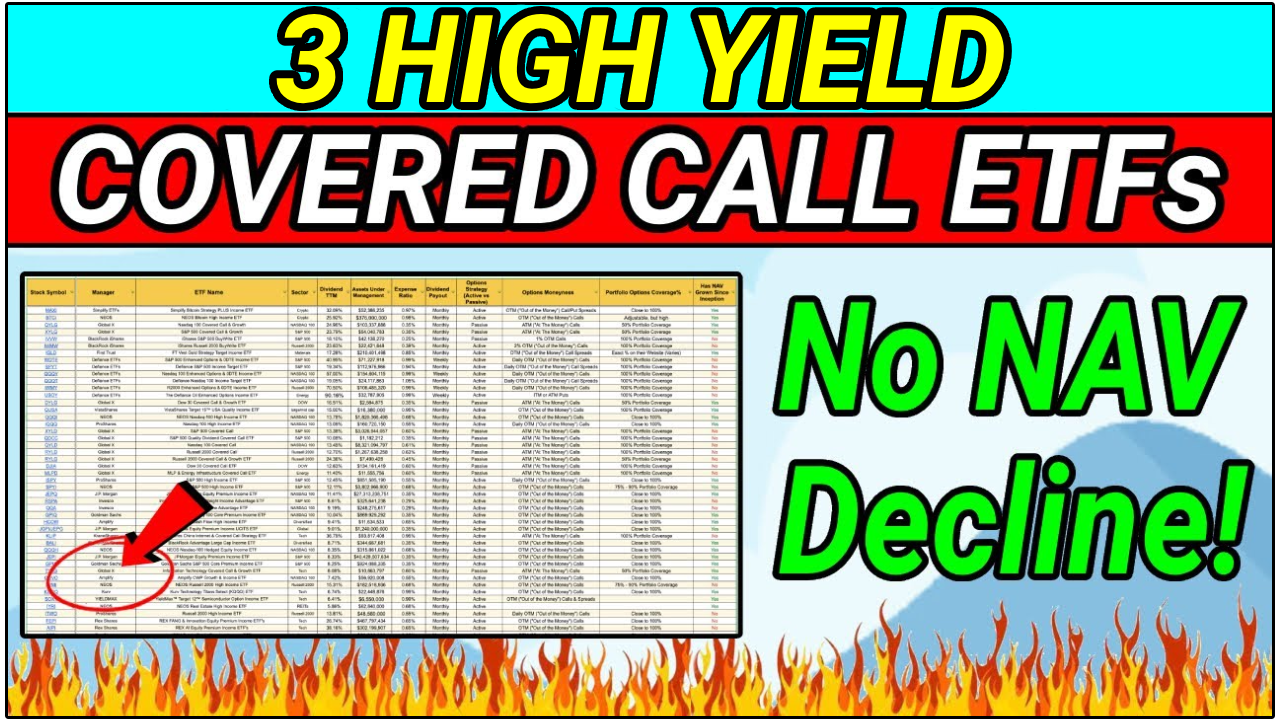
Today, we will look at 3 covered call ETFs with high yields-
That have also been able to actually grow their net asset value.
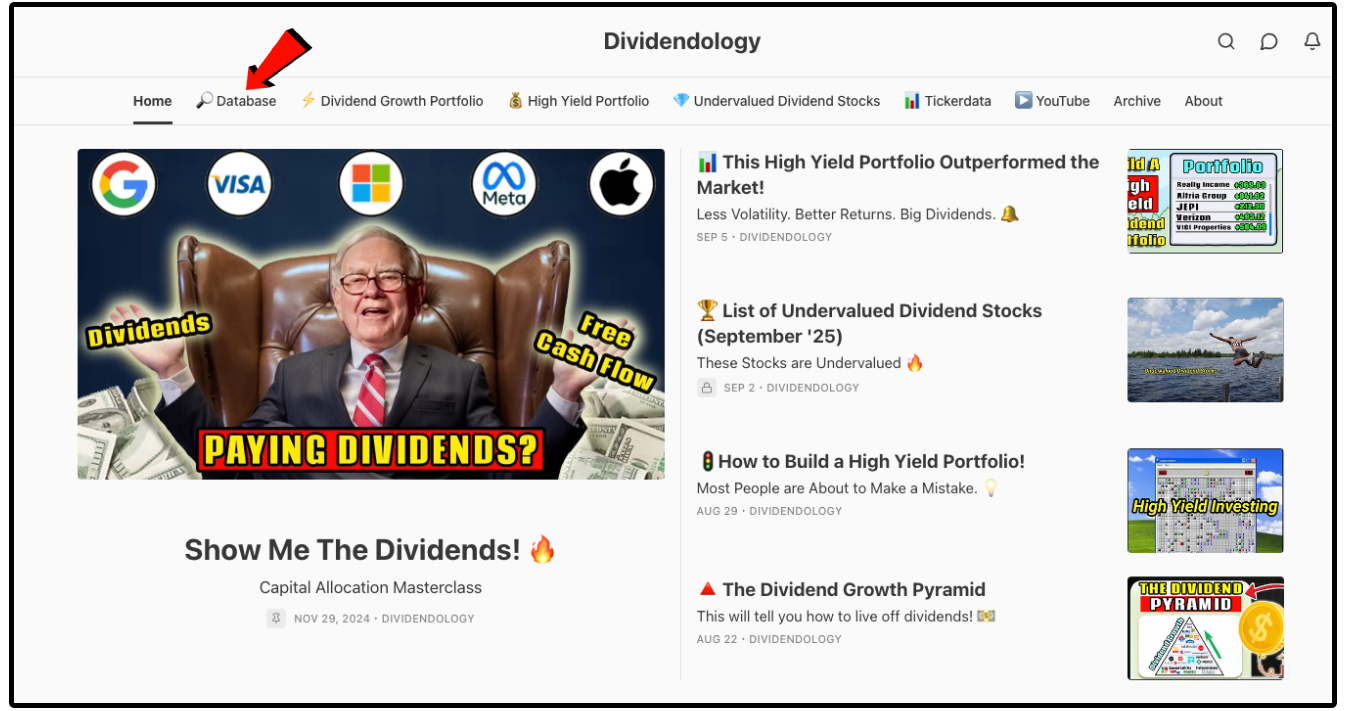
🔍 Dividendology Database
I just updated the Dividendology Covered Call ETF Database.
After adding a few new ETFs, we are now actively tracking 68 different covered call ETFs in the database.
Out of the 68 ETFs in this database, only 31 have grown NAV since inception.
That’s only 45%!
Most covered call ETFs are simply liquidating themselves.
Are You Making Money — or Just Your Fund Manager?
We’ve seen a fundamental shift in equity markets over the last 15 years.
In 2010, there were 4x more stocks trading than ETFs.
That has changed dramatically in the last few years.
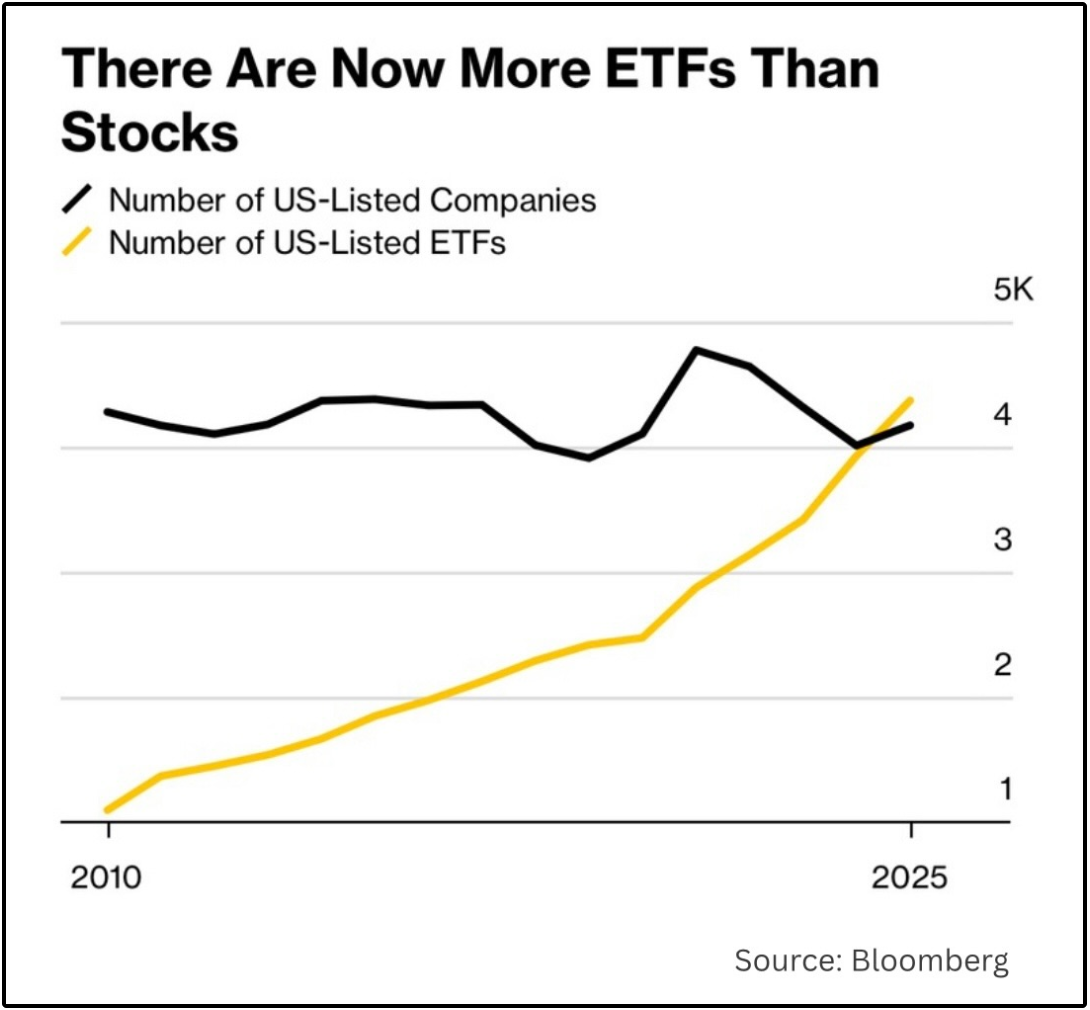
This is in large part due to the growing popularity of covered call ETFs.
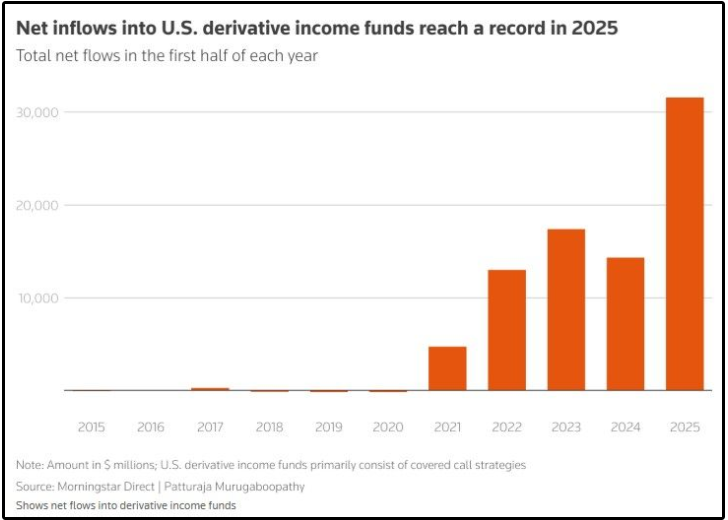
There were virtually no inflows into covered call ETFs before 2021-
But now?
The first half of 2025 saw more than double the amount of inflows vs the first half of 2024.
Why would this be the case?
If wall street thinks you’ll buy it, they’ll sell it.
In the middle of a raging bull market, we are seeing new income products with unsustainable yields entering the market every day-
Which grows the fund managers assets under management (which they often charge an over 1% fee for many covered call ETF products).
For example, a fund manager with an expense ratio of 1% that has $40 billion in AUM?
They are generating $400 million a year for their firm.
Now it makes sense why there are more ETFs than stocks.
So… How do we determine if a covered call is actually worth buying?
Net Asset Value
The net asset value tells us whether or not a fund’s dividends are actually sustainable.
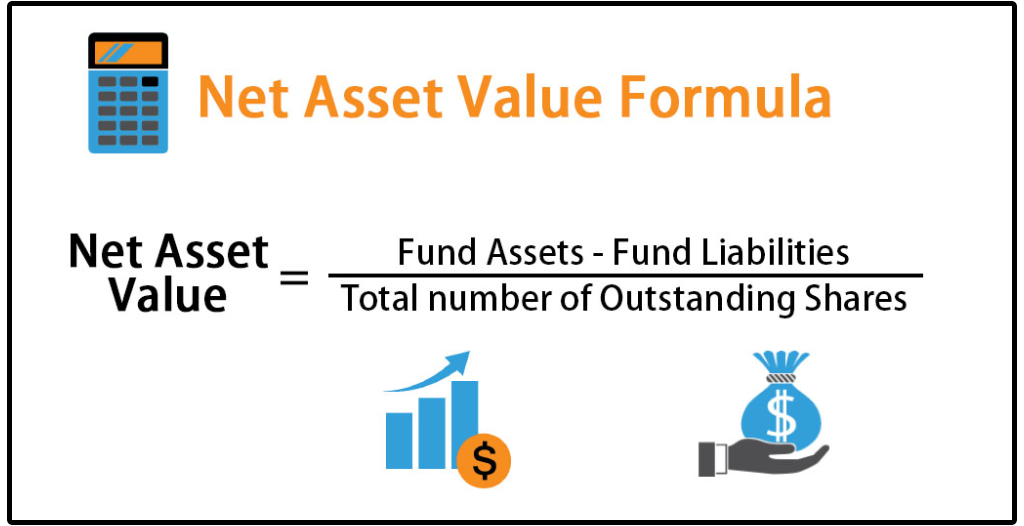
If NAV is rising, the fund is growing in value.
If it’s falling, value is being lost.
Covered call ETFs generate income by selling call options on the assets they hold.
If the NAV shrinks over time, the ETF has fewer assets to write calls on.
Fewer assets = lower premiums = smaller dividend payments.
Here’s why NAV growth is so important:
More income potential: A rising NAV gives the fund more assets to write calls against, which increases the size of future dividends. (We will see a fund below that is an example of this!!)
More upside potential: While covered call ETFs by nature do cap your upside, growing NAV means you’ll take part in some of the upside
Protection against erosion: If NAV falls too far, the ETF can’t recover during market rallies, because the calls it writes cap the upside. This is a big one, and it creates what I call “NAV bleed.”
Let’s look at our 3 covered call ETFs.
1. 💸 Infracap Equity Income Fund ETF (ICAP)
Yield: 8.82% | YTD Gain: 1.78% | YTD Total Return: 8.9%
ICAP is not a popular ETF-
But it should be.
This is an ETF I just added to the Dividendology Database, and it’s quite unique from other covered call ETFs.
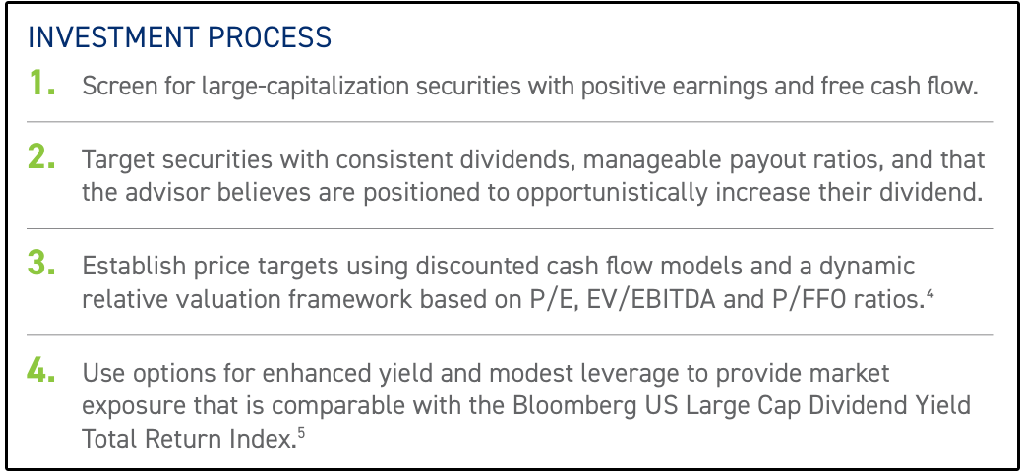
ICAP holds individual large-cap dividend stocks (like AT&T and Exxon) and writes short-term, single-stock covered calls instead.
This is a key distinction.
Writing individual calls allows ICAP to:
Keep higher equity exposure (no structured notes)
Avoid capping too much upside during rallies
Generate option income that can actually grow NAV over time
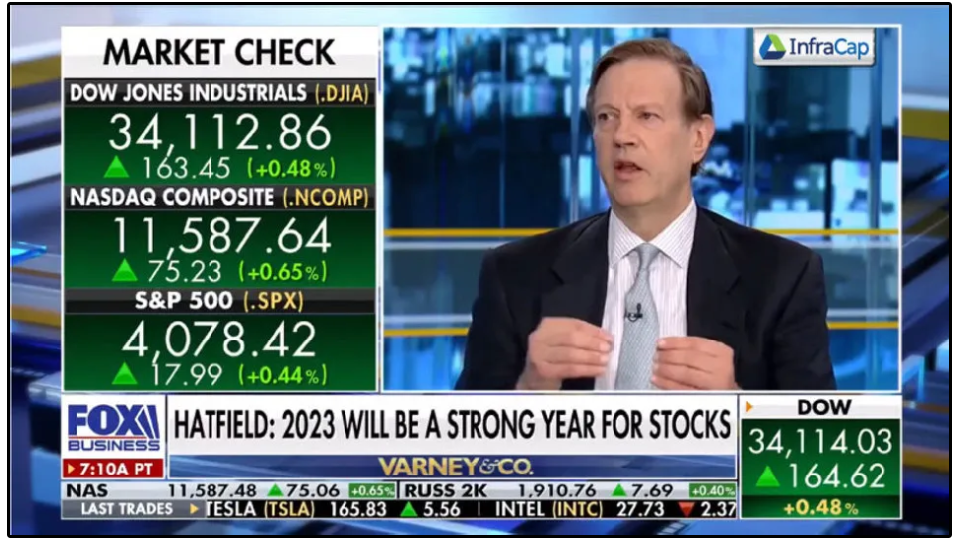
I recently interviewed the fund manager, Jay Hatfield, and he said this:
“We don’t like index call strategies. They cap upside and reduce equity exposure. We do stock-picking combined with individual call writing — it’s more labor intensive, but it’s very effective.”
The portfolio options coverage is typically between 30% to 40%, meaning the majority of the upside is uncapped.
This makes ICAP one of the ‘safer’ covered call ETFs.
Because most of the upside is uncapped, their net asset value continues to grow.
As a result, ICAP actually grows their dividend payments every quarter!
ICAP is one of the only covered call ETFs that I know of that actually grows their dividend payments.
If you’d like to learn more about ICAP, you can read my interview with the fund manager, Jay Hatfield here:
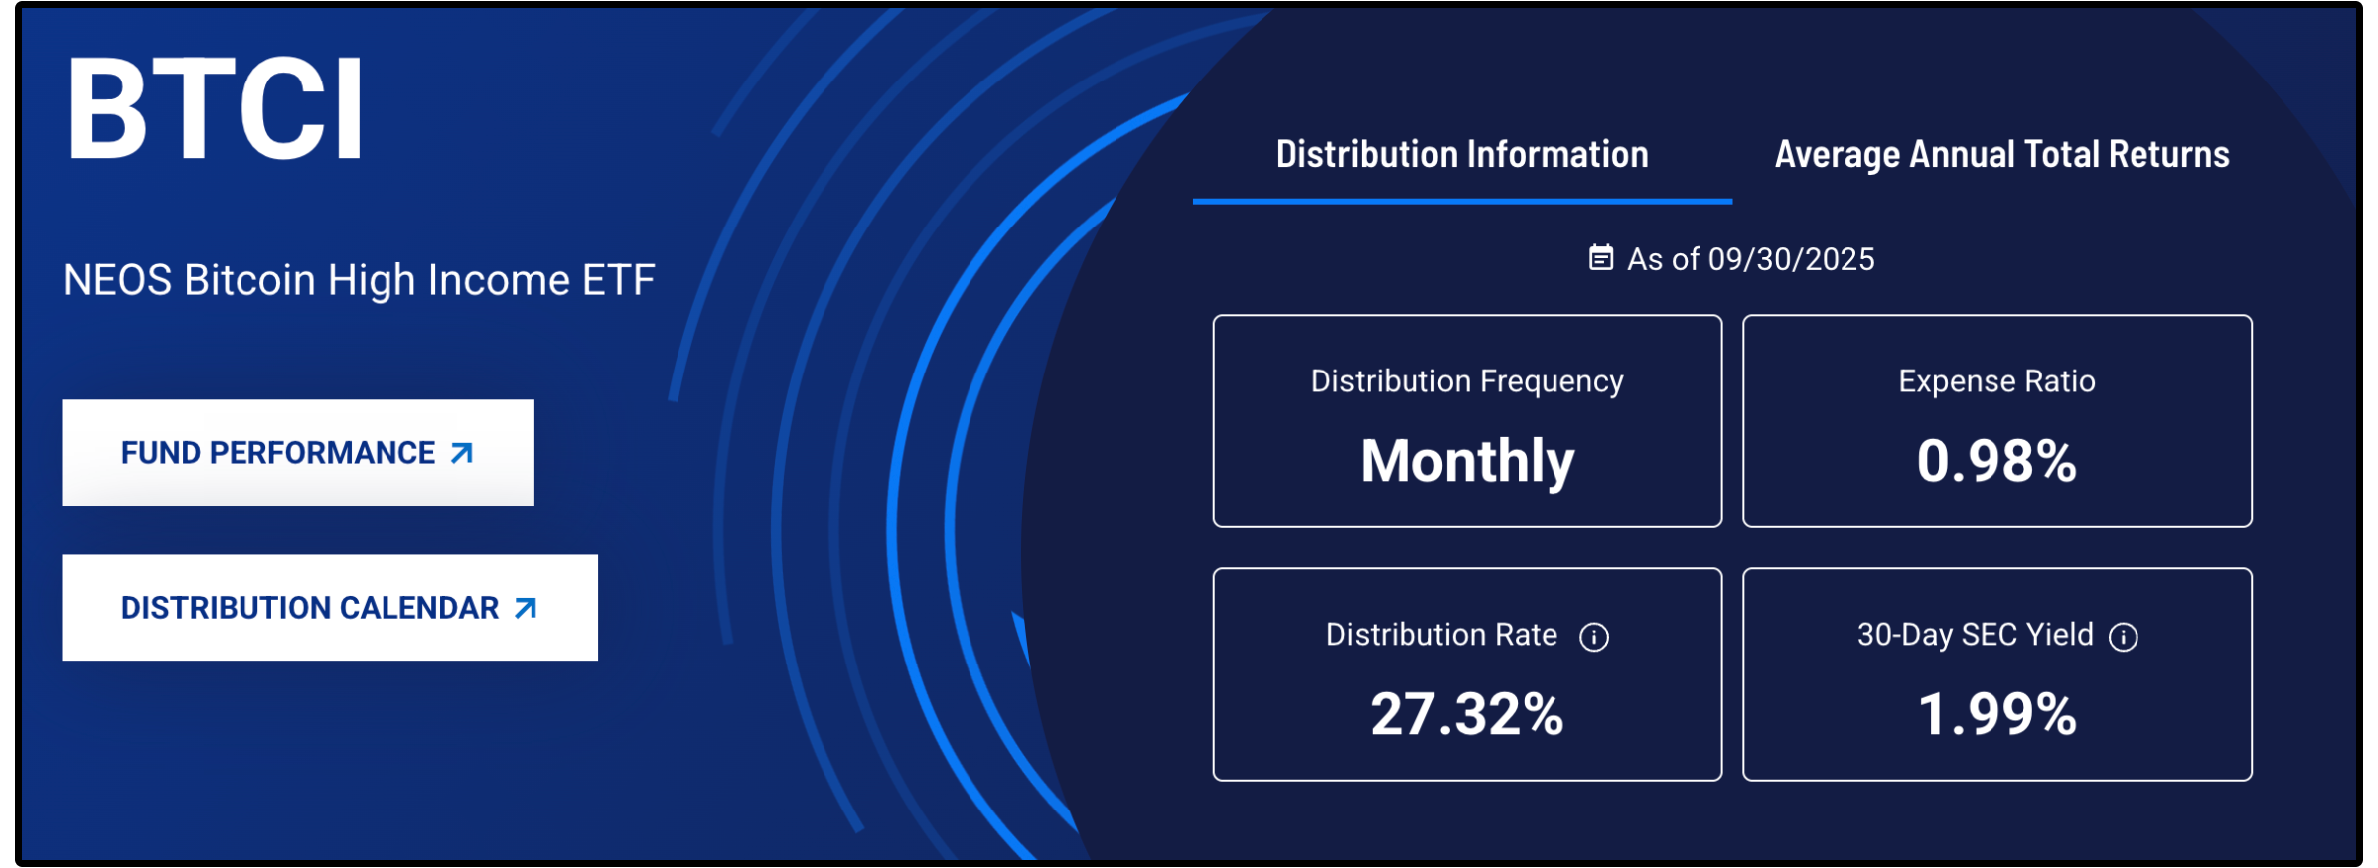
2. 👑 NEOS Bitcoin High Income ETF (BTCI)
Yield: 27.77% | YTD Gain: 1.78% | YTD Total Return: 26.3%
BTCI is a covered call ETF with an astounding 27.32% distribution rate and has still managed to grow NAV since inception.
Here’s why BTCI is really able to generate such large payouts without NAV decline:
Volatility.
When it comes to covered call ETFs-
Higher Volatility = Higher Premiums = Higher Dividend Payouts
Bitcoin’s volatility (46.3%+) is nearly 5x higher than the S&P 500, and more volatile than every major asset.
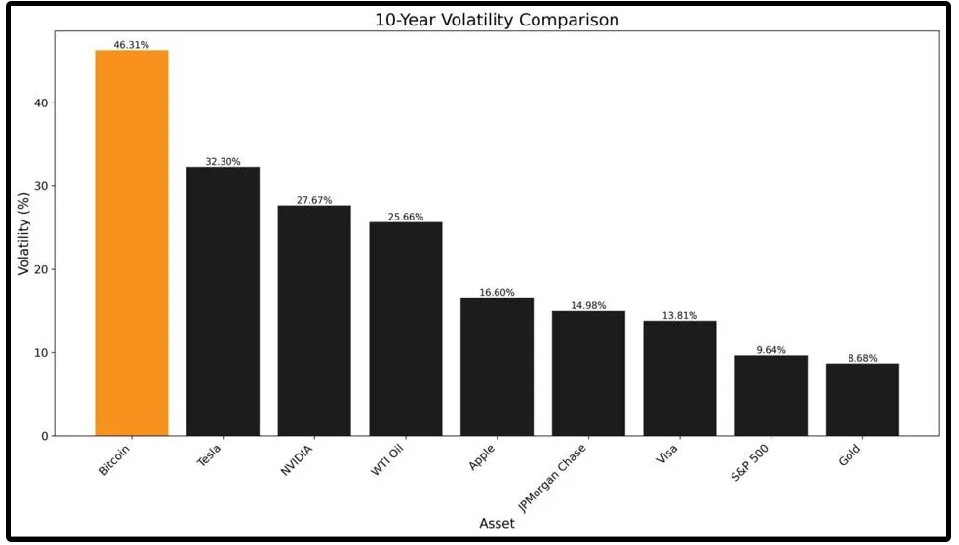
That makes the premiums the fund generates significantly higher.
BTCI has been on an incredible run and continues to churn out massive payments-
But you need to be aware of the risks as well:
NAV is Tied to a Single Asset
BTCI’s NAV is almost entirely dependent on one highly volatile asset: Bitcoin.
Extreme Bitcoin Volatility
What happens to be a strength for BTCI, one could argue is also a weakness. Massive fluctuations in share price will be the norm.Lack of Data
BTCI launched in October 2024 and has only operated during a bullish Bitcoin environment. Its performance and distribution sustainability in a bear market have not been put to the test… But it will at some point.
3. Global X Nasdaq-100 Covered Call & Growth ETF (QYLG)
Yield: 24.44% | YTD Gain: 5.02% | YTD Total Return: 10.7%
QYLG buys the Nasdaq-100 index and writes covered calls on ~50% of the portfolio.
Because they only write calls on half the assets, the fund retains exposure to upside on the other uncovered 50%.
The trailing twelve month yield for QYLG is quite misleading.
This is why:
To avoid being taxed at the corporate level, the fund must distribute at least 90% of its taxable income and realized capital gains to shareholders each year.
Throughout the year, QYLG pays monthly option-income distributions, which come from the call premiums it collects.
If the fund realizes additional capital gains from selling appreciated stocks and those gains push its total taxable income above what’s already been paid out, then it’s legally required to “catch up” by distributing the remainder before year-end.
This is why we have twice seen a massive distribution paid out by QYLG at the end of the year.
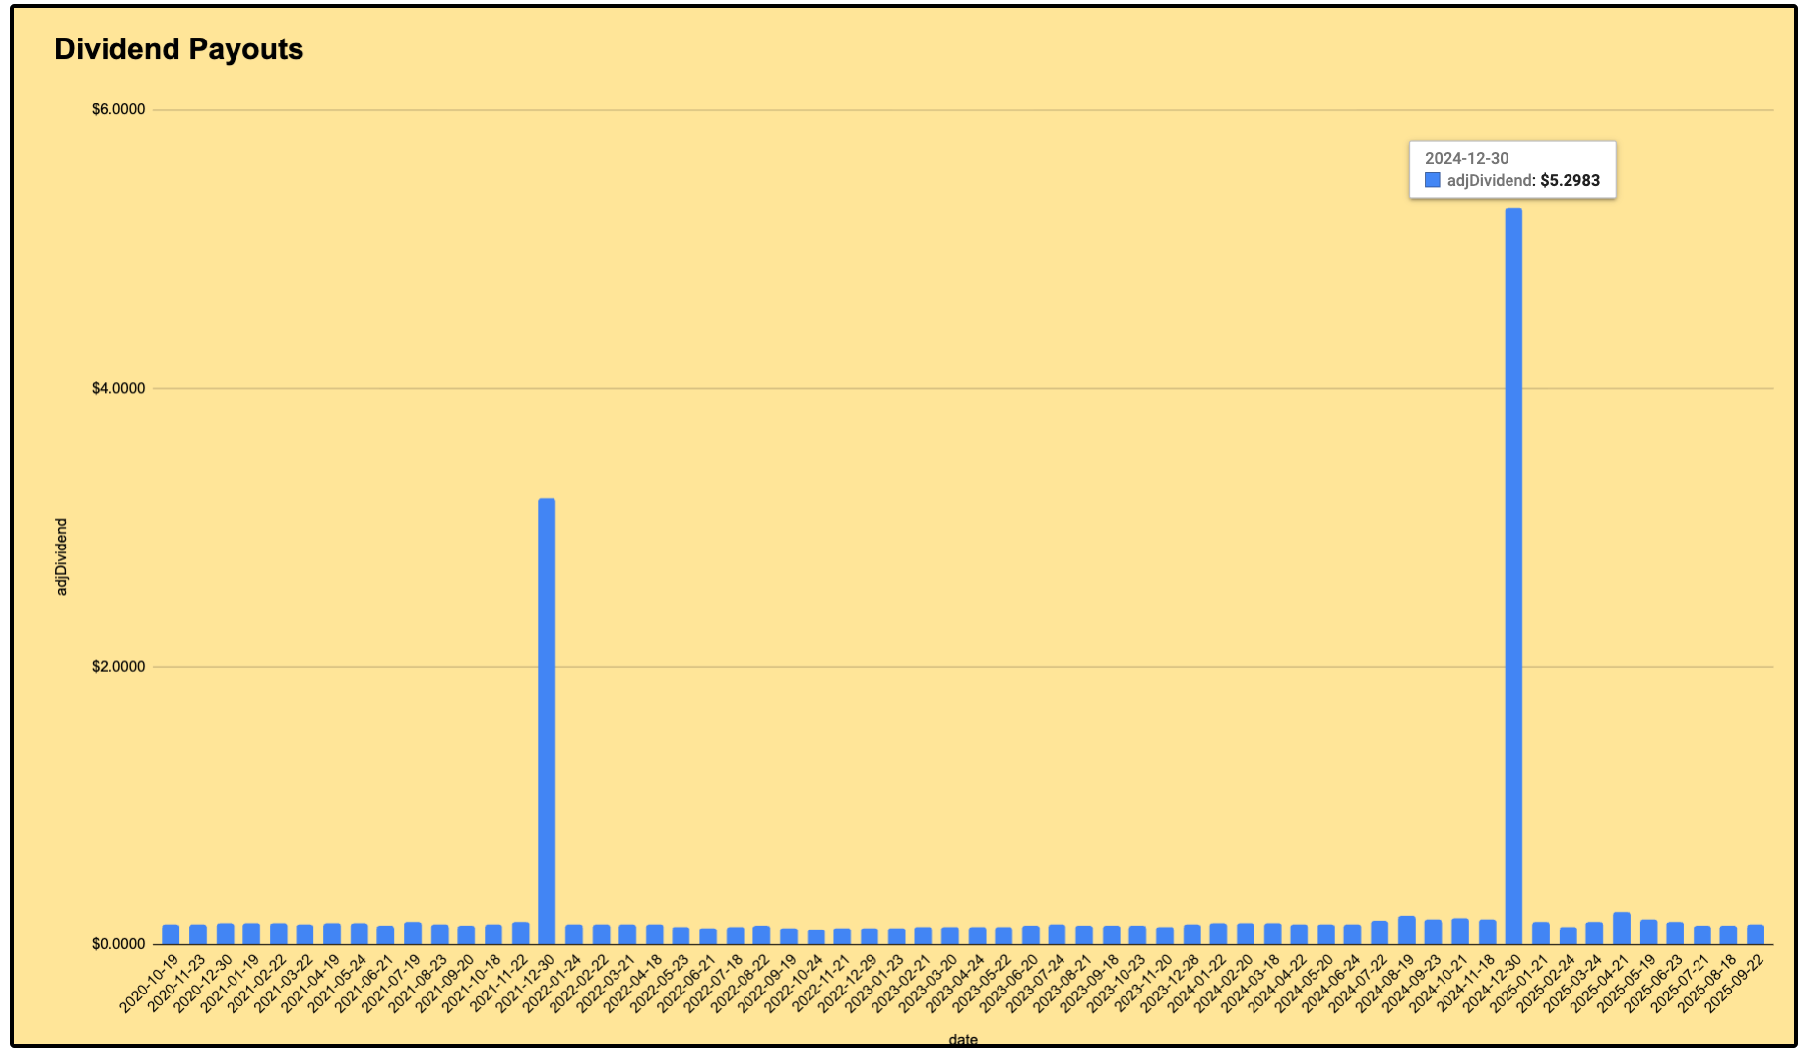
It’s not a “bonus”, it’s just the fund meeting that 90% distribution rule.
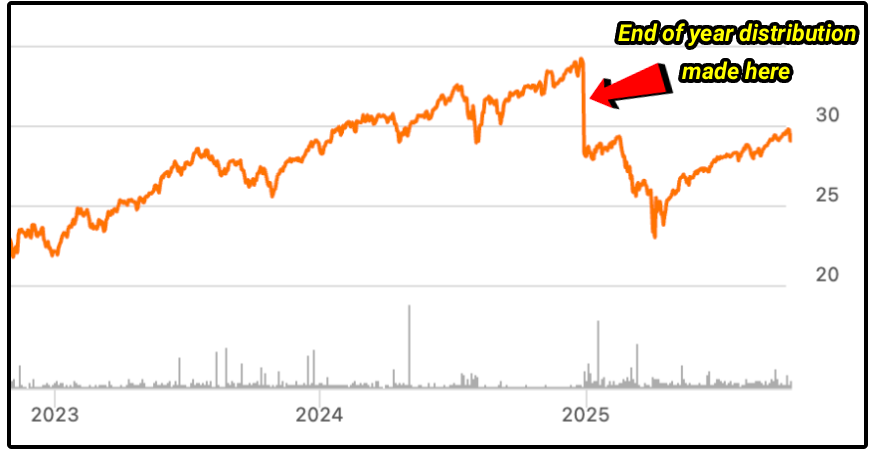
However, there’s an important side effect:
When a fund makes a large catch-up distribution, the NAV drops by that same amount because distributions are paid out of the fund’s assets.
So, while investors receive the cash, the share price adjusts downward.
It’s the same total value, just shifted from NAV into your pocket.
This is a natural consequence of the fund only having 50% portfolio options coverage.
The fund has more capital gains from the uncapped 50%-
But it still has to be distributed to avoid being taxed at the corporate level.
Because of this, the yield appears much higher than usual when a large distribution is made at the end of the year.
⚡ High Yield Portfolio
Last, we began the process of building out our real money Dividend Growth Portfolio and High Yield Portfolio.
Last week, we added our second position to the high yield portfolio.
Very soon, we will be adding more positions, with one of them being a covered call ETF in our database.
If you want to be a part of the process of building these portfolios and also get access to everything mentioned below, you can join here:
Here’s everything you’ll get as a paid Dividendology member 👇
📊 Full Access to the Dividendology Database
Built with over $10,000 invested in tools and research, this powerful database tracks dividend stocks and alternative income assets like Covered Call ETFs, REITs, and BDCs.📈 The Dividend Growth Portfolio
A real-money portfolio built from scratch, focused on long-term wealth creation and building a rapidly growing stream of dividend income💸 The High Yield Portfolio
A real-money portfolio, designed to generate massive sustainable income with an average yield of 8%+📉 Running List of Undervalued Dividend Stocks
Updated regularly — stay ahead with a curated list of the most attractively valued dividend opportunities in the market🧠 In-Depth Research & Reports
Deep dives into dividend stocks and income strategies you won’t find on mainstream platforms
Check out these resources:
Tickerdata 🚀 (My automated spreadsheets and instant stock data for Google Sheets!)
Interactive Brokers 💰 (My favorite place to buy and sell stocks all around the world!)
Seeking Alpha 🔥 (Research stocks $30 off! + 7 day free trial)
The Dividend Report 📊 (Free Newsletter for Straightforward Dividend Stock News)
Icap has extremely high management fees. Why aren’t you recommending much cheaper CC ETFs such as Spyi or Gpix? Is Jay Hatfield a friend of yours?
Do you recommend any other QQQ CC ETFs in addition to QYLG? Such as QQQI or Gpiq?