
🏆 List of Undervalued Dividend Stocks (February '26)
These Stocks are Undervalued! 🔥

At the beginning of each month, I send out a spreadsheet that lists out the dividend stocks that I believe to be undervalued.
This is the end result of 100’s of hours of research every month.
It’s time to dive in.

🔍 Quick Market Update
It’s been a brutal week in the market-
But not all sectors have been impacted the same.
Those that are heavily invested in tech, software, and crypto saw their portfolios drop substantially.
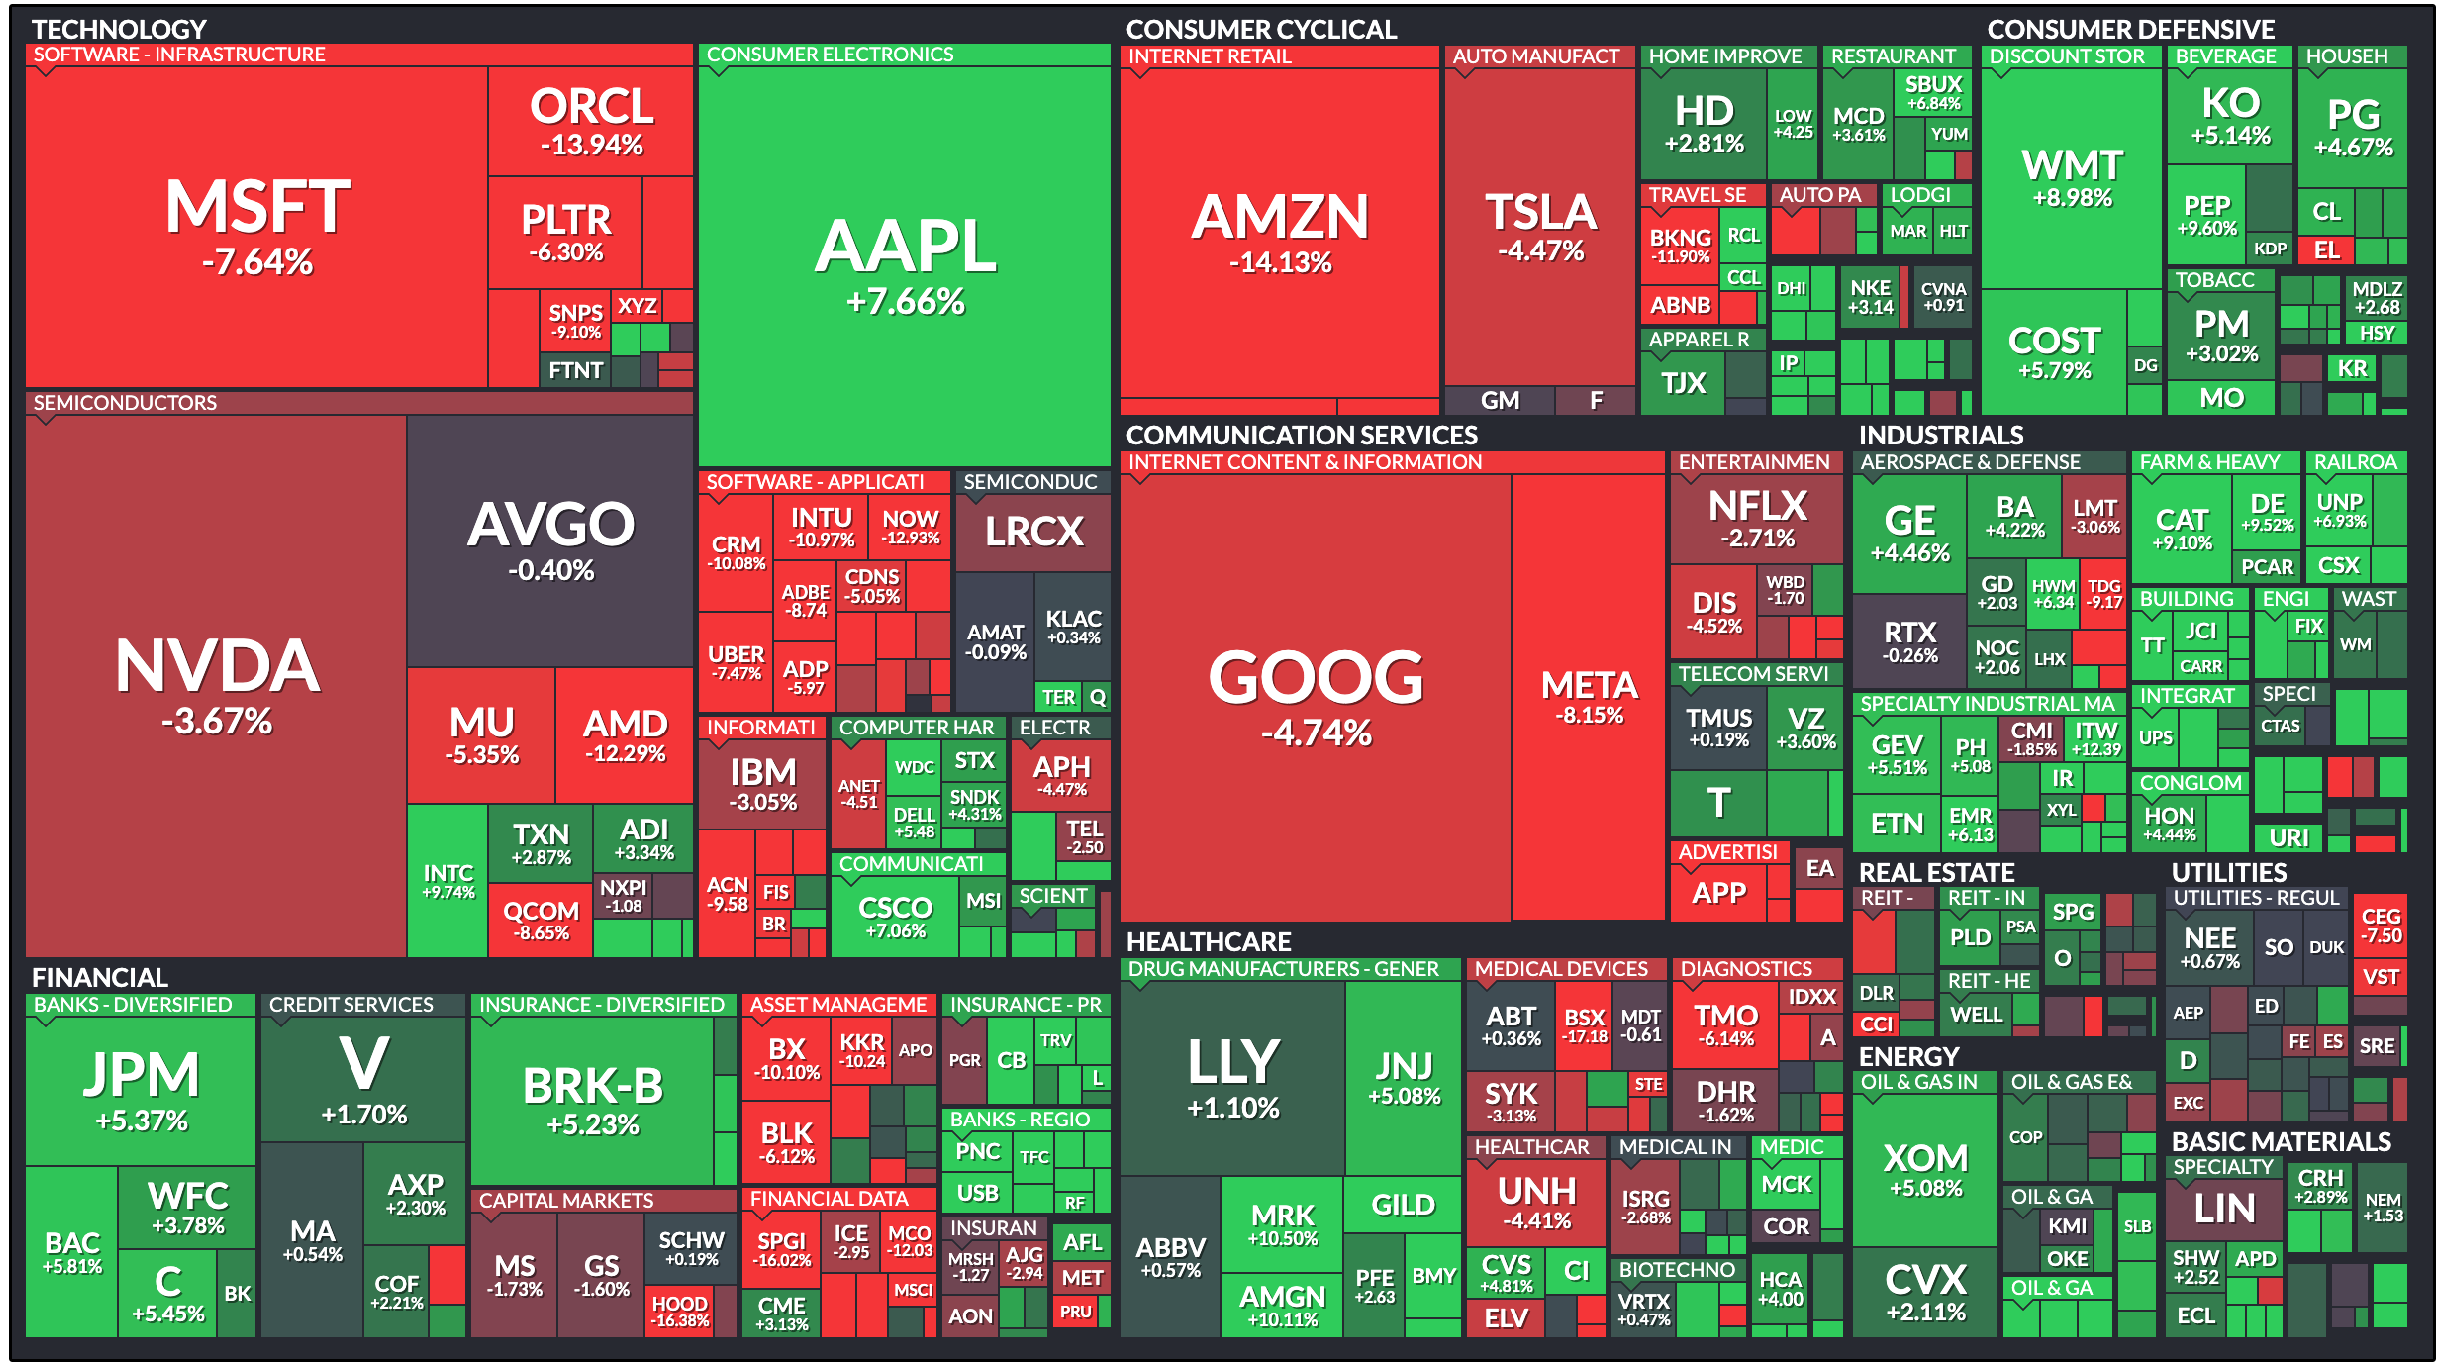
But in the midst of all this, a clear market rotation has taken place.
One of the main beneficiaries of this rotation has been the dividend ETF, SCHD, which is already up over 14% year to date.
This was a market rotation that I saw as very likely.
In fact, I wrote about it in depth in early December, which you can go back and read here:

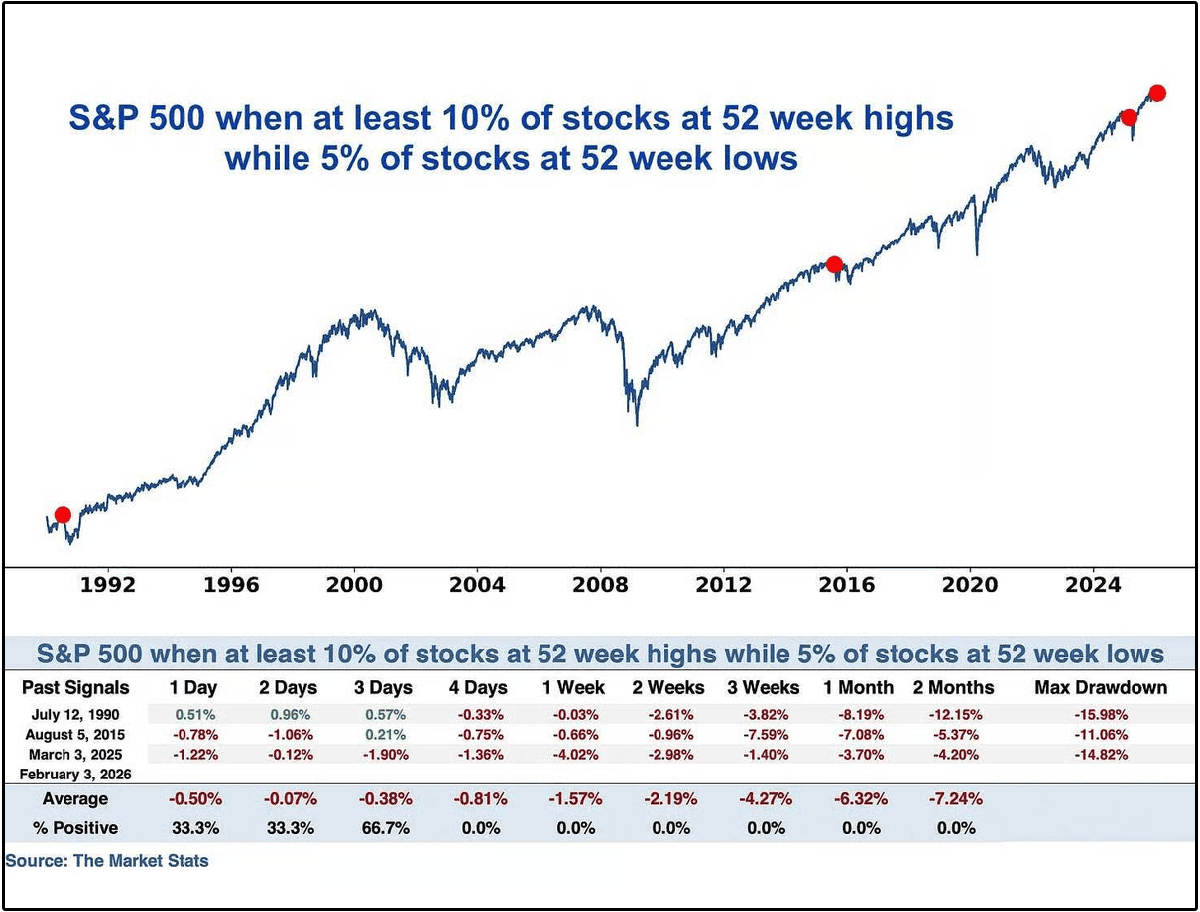
However, this sell off has sent the market in two different directions.
We now have:
16% of S&P 500 stocks are trading at 52-week highs
5% are sitting at 52-week lows
This has only occurred 3 other times:
July 1990
August 2015
March 2025
Every time, the S&P 500 saw a 10%+ correction within around 2 months.
I’m by no means looking to try and time the market, but periods like this are exactly when long-term investors are rewarded for staying disciplined, focusing on valuation, and selectively putting capital to work in high-quality stocks trading at a discount.
Let’s dive in.
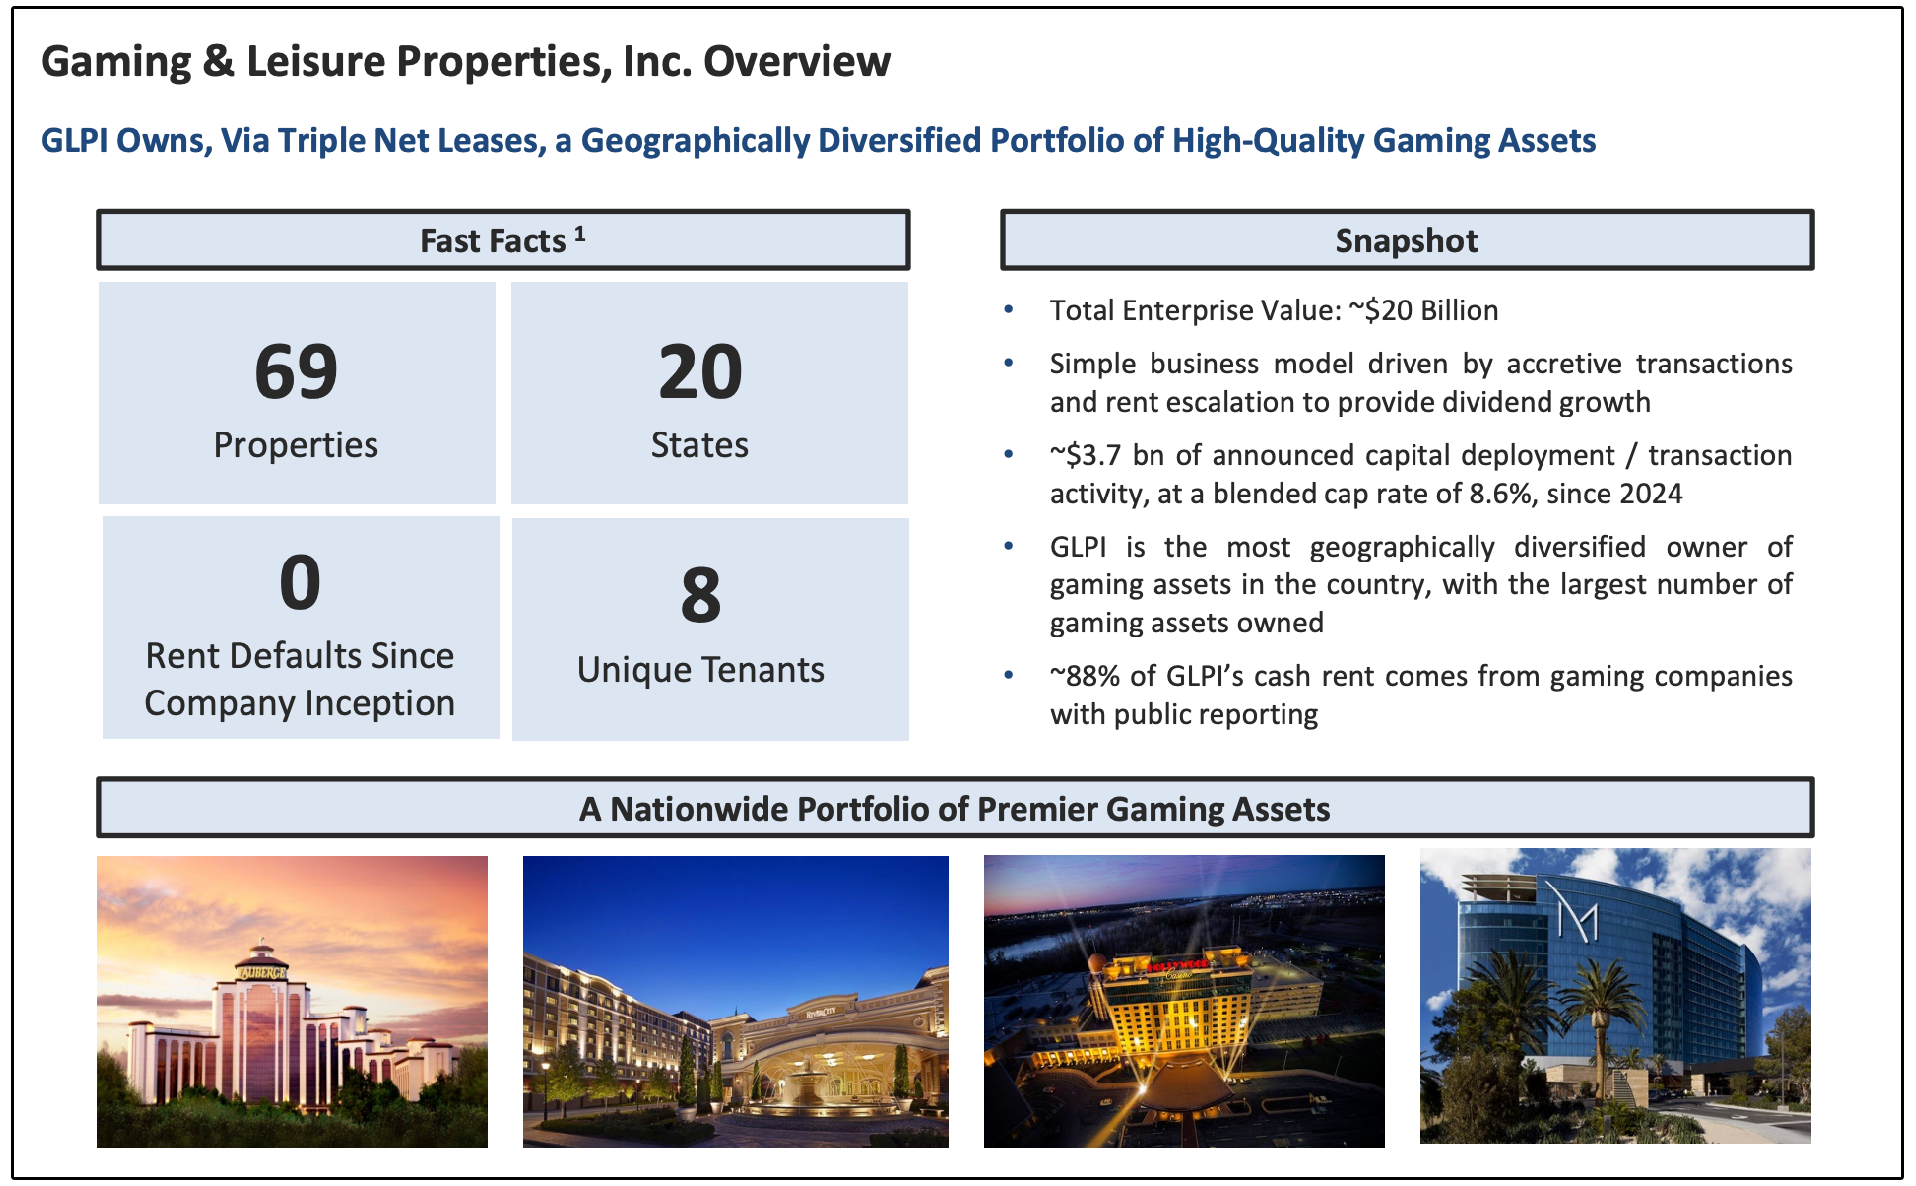
1. Gaming and Leisure Properties (GLPI)
Gaming & Leisure Properties is a specialized triple-net REIT that owns the real estate beneath casinos and gaming destinations.
Under this structure, tenants are responsible for:
Property taxes
Insurance
Maintenance and capital expenditures
Due to this triple-net lease structure, GLPI’s cash flows are much more predictable, inflation-resistant, and largely insulated from day-to-day operating volatility.
If you’ve been utilizing the Dividendology REIT Database on Dividendology.com, then you’ve likely noticed some attractive characteristics surrounding this REIT:
5 YR AFFO per share CAGR: 10.2%
Projected 3 YR AFFO per share CAGR: 5.16%
Dividend Yield: 6.88%
Trading below historic valuation multiples
However, their current position stands out far more when you compare them to their triple-net lease peers.
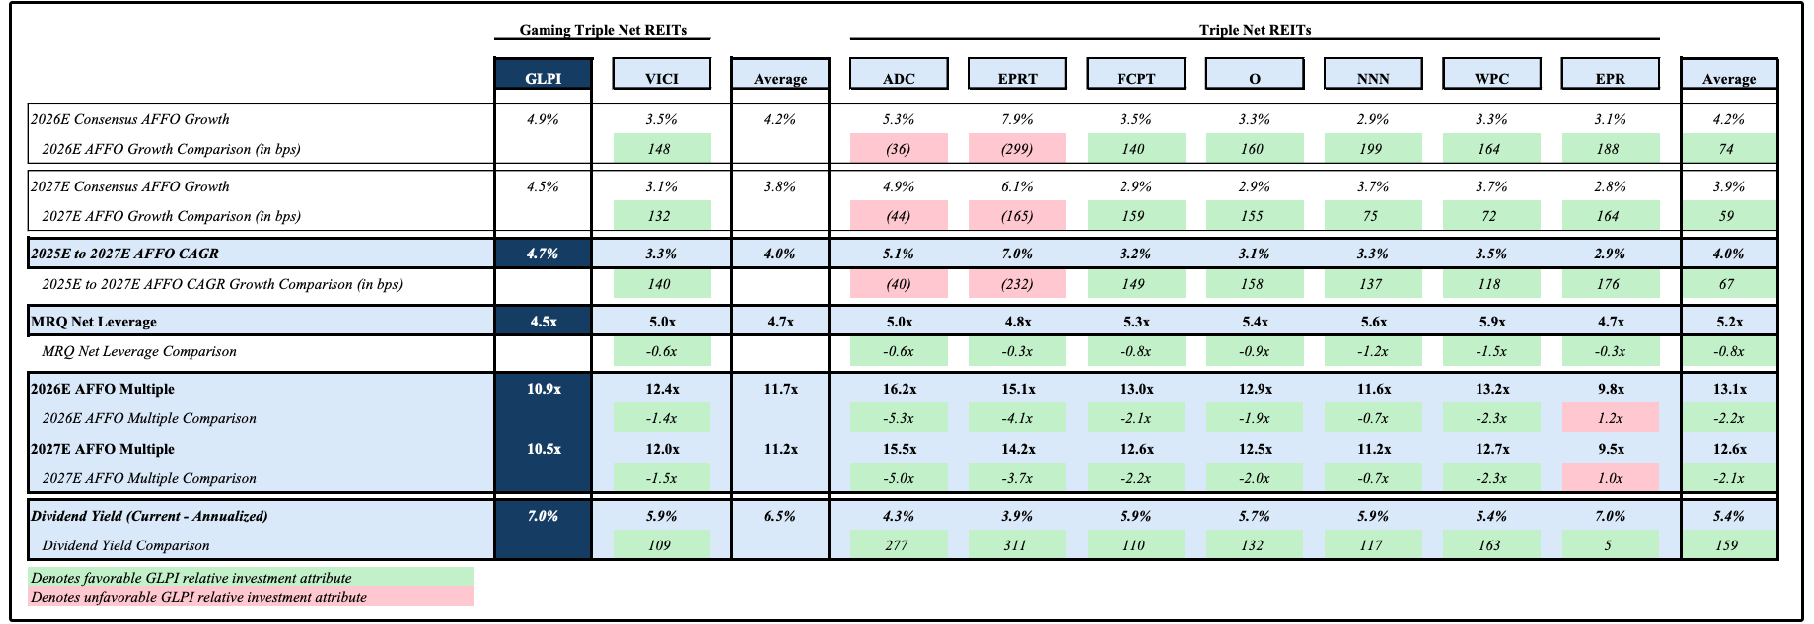
Despite offering above-average AFFO growth relative to both its gaming peer VICI Properties and the broader triple-net REIT group, GLPI trades at a meaningfully lower AFFO multiple while maintaining reasonable leverage and one of the highest dividend yields (~7%) in the group.
In other words, investors are getting comparable or better growth and balance-sheet quality at a discount, while being paid more income to wait.
Of course, the main risk investors are concerned about is the concentration of tenants.
But unlike their peer VICI (which I’m generally still a fan of), who is heavily exposed to Las Vegas or destination markets, GLPI focuses on domestic regional gaming markets across 20 states. These properties tend to benefit from:
More stable, local customer bases
Lower peak-to-trough volatility across economic cycles
Less reliance on tourism and airfare-driven demand
This regional focus pairs extremely well with the triple-net lease model and results in more durable, recession-resistant rental income.
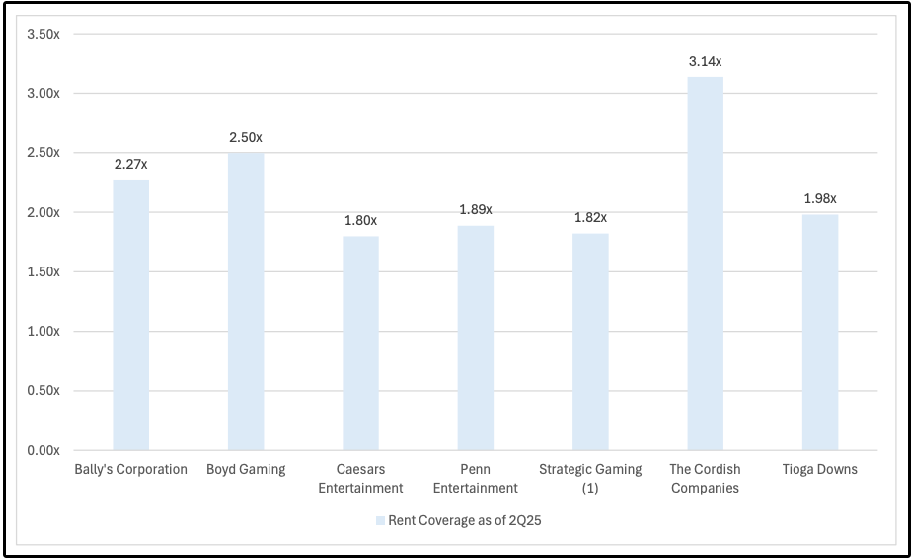
On top of this, while they are heavily concentrated to just a few tenants, the tenants rent coverage as of 2025 is still quite healthy.
When it comes to valuation, if GLPI can achieve dividend growth of just 3% moving forward, this would give them a fair value of $58.05.
That means over 27% upside from current prices.
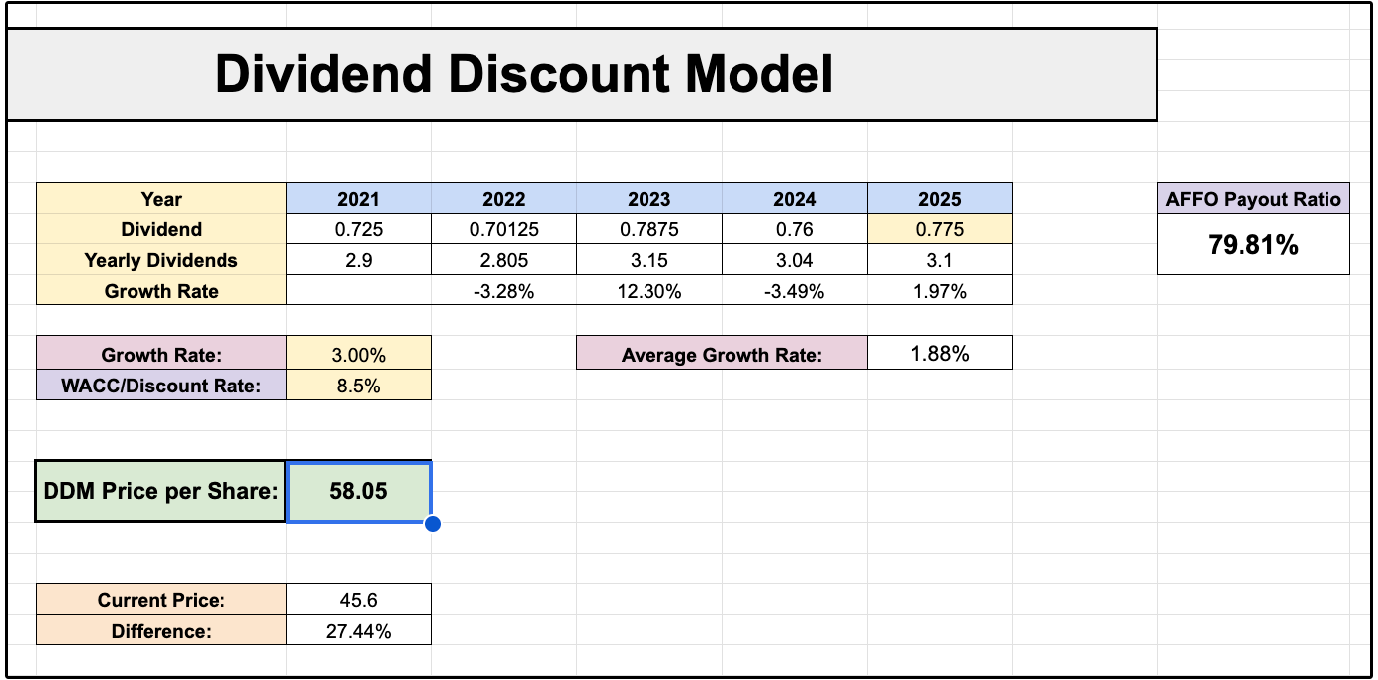
While the AFFO payout ratio is slightly higher than I like to see currently, keep in mind they are projected to grow AFFO per share at around 5% moving forward.
So if dividend growth is below 5% during that time, the payout ratio will continue to go lower, pushing the company into a healthier position.
2. Microsoft (MSFT)
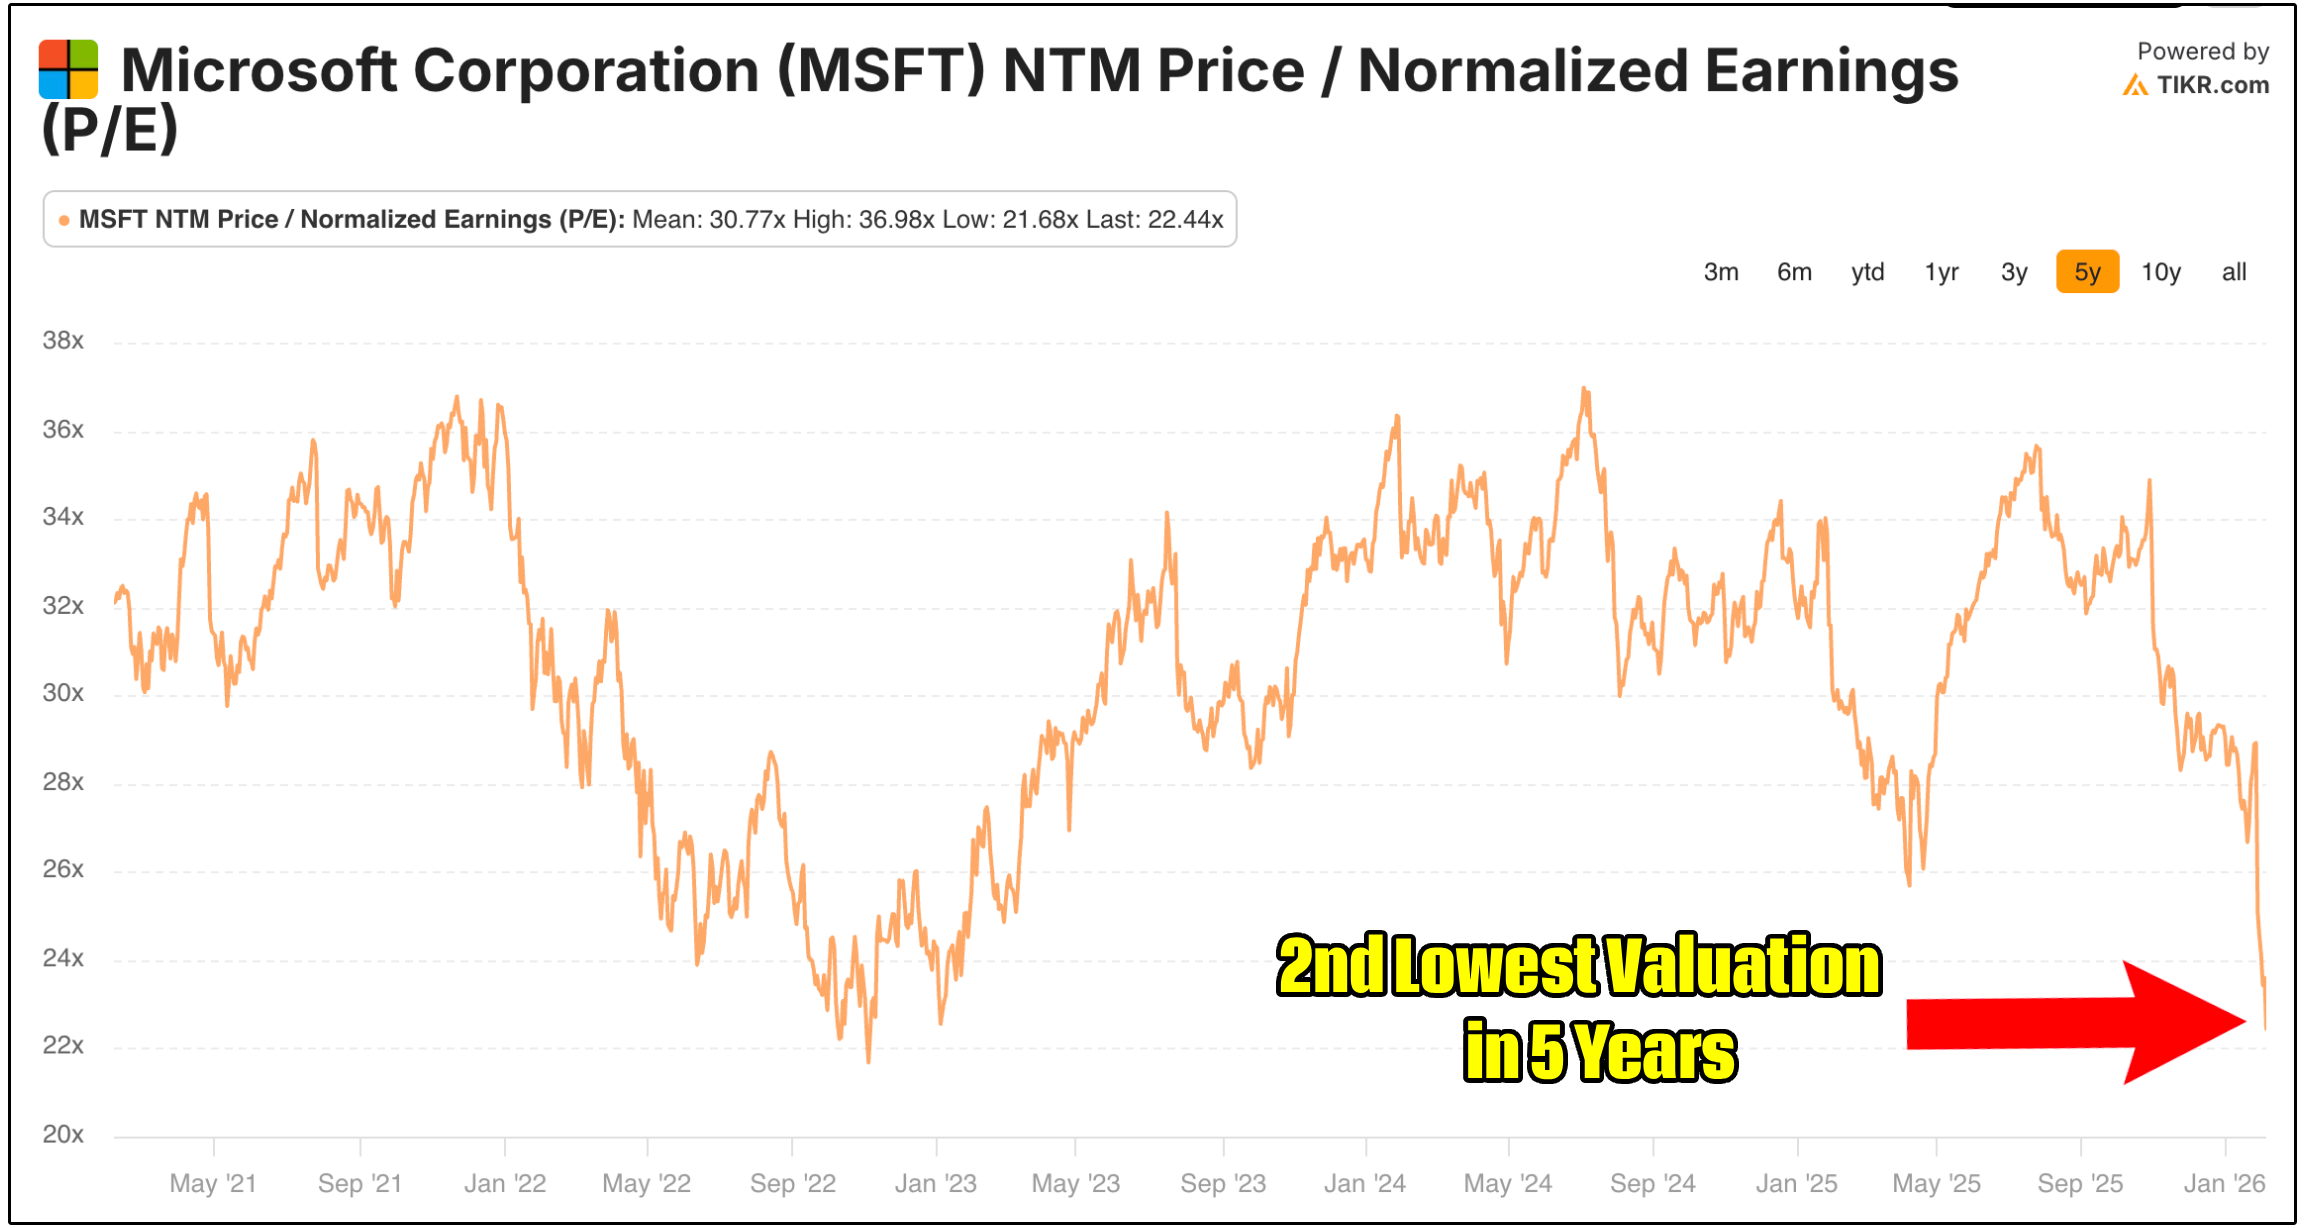
Microsoft has quietly become one of the most interesting large-cap dividend opportunities in the market after a sharp tech-led selloff pushed the stock below $400 for the first time since the April 2025 tariff scare.
Trading at this price puts them at their 2nd lowest forward PE multiple in the last five years.
The surface level concern is that free cash flow stagnated in 2025.
For a company historically growing free cash flow at double digits, this obviously caught the market’s eyes.
However, this lack of FCF growth was completely expected as management let us know throughout the year.
This decline is almost entirely the result of aggressive growth capex tied to cloud and AI infrastructure, not deteriorating fundamentals.
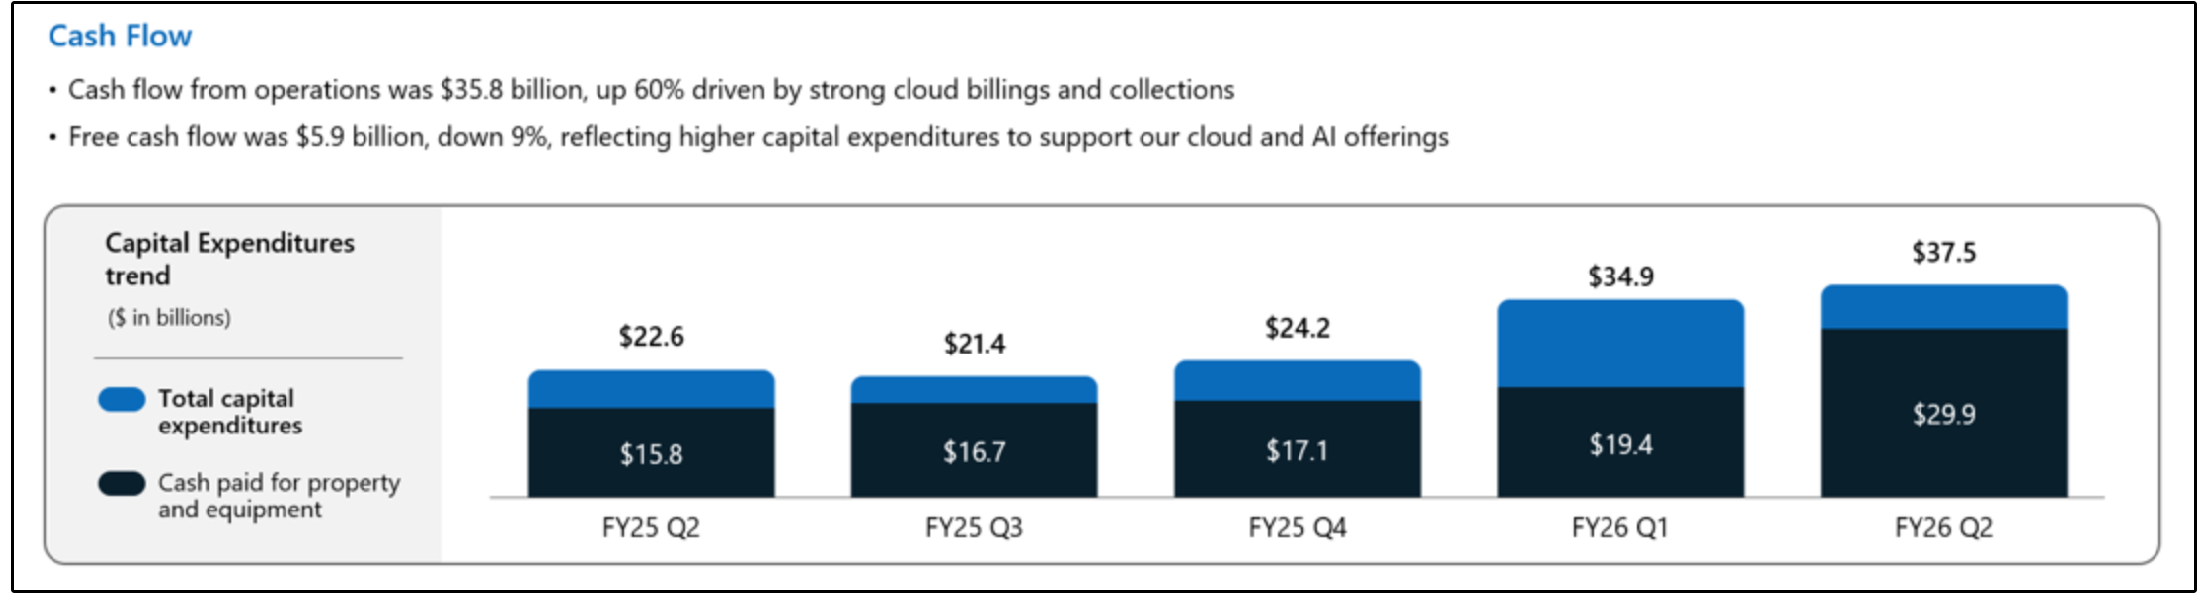
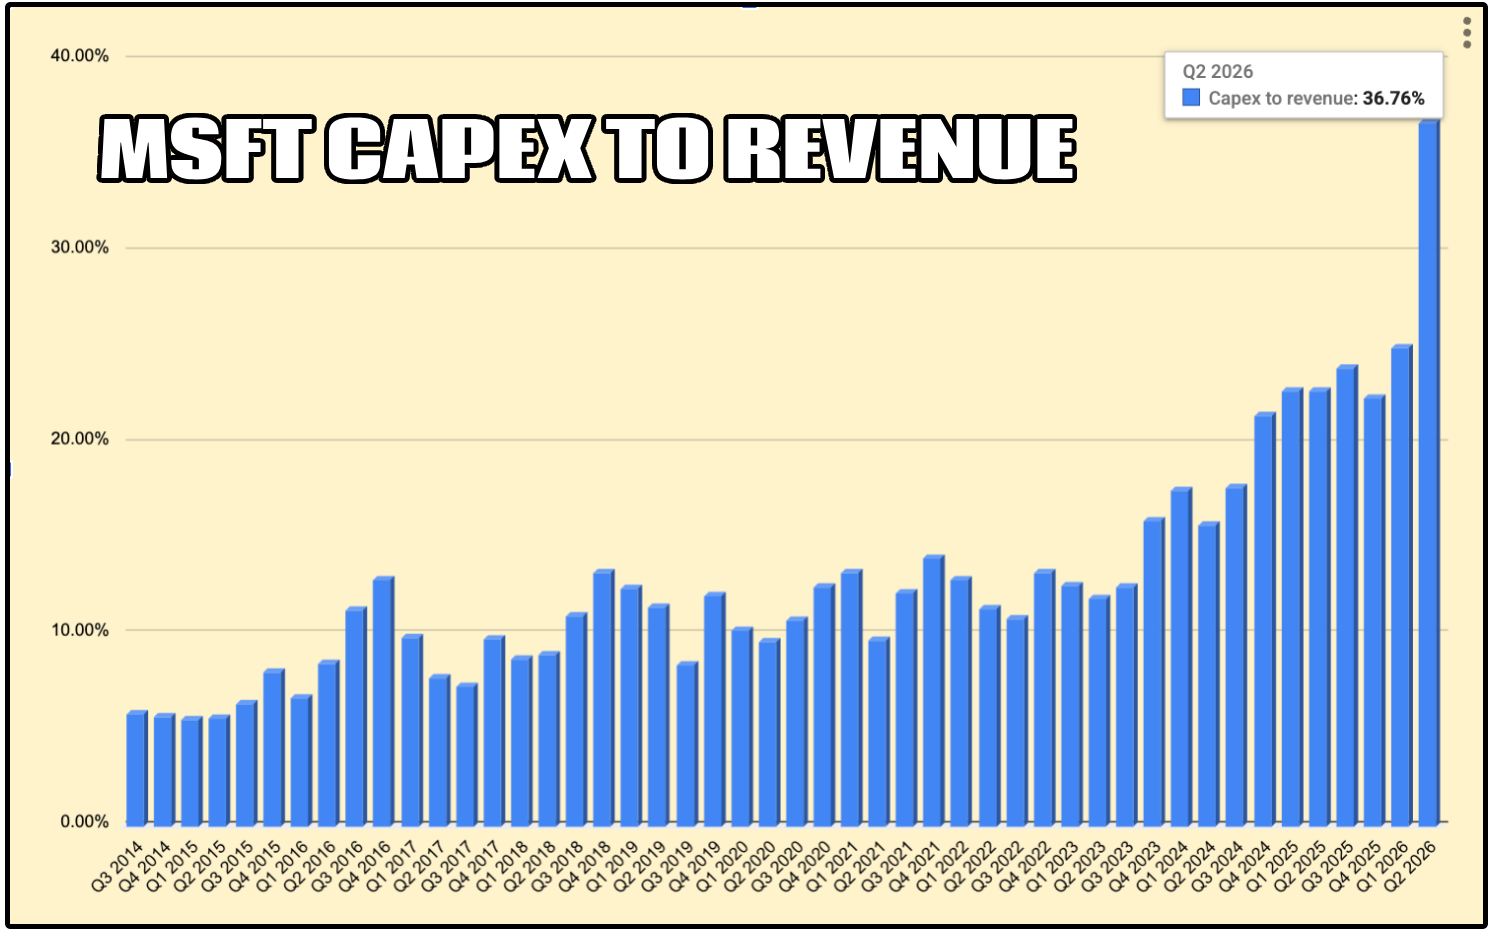
The level of capex spending for MSFT has been unprecedented.
The company’s capex to revenue ratio historically sat near 10%-
But it hit 36.76% in the recent quarter.
We’ve seen tech stocks punished in the past for a significant growth in capex spending.
But Microsoft has one of the strongest backlogs in all of big tech, as commercial RPOs surged to $392B (+51% YoY).
The true concern of the market centers on one issue:
The fact that roughly 45% of that backlog is tied to OpenAI-related commitments, introducing a new perceived concentration risk.
While OpenAI does not represent anything close to 45% of Microsoft’s current revenue, it does account for a meaningful share of future contracted cloud demand, which means a disproportionate amount of Microsoft’s near-term growth expectations are linked to the success, scalability, and capital needs of a single customer.
This has raised concerns around customer concentration, long-term pricing power, and the durability of returns on Microsoft’s massive AI-driven capital expenditures.
If OpenAI’s growth were to slow, renegotiate terms, or shift workloads over time, it could create volatility in cloud revenue realization.
That said, it’s important to note that these are signed, multi-year commitments with a roughly two-year weighted duration, and they exist precisely because demand is already in place, not speculative.
The risk is real and worth monitoring, but it’s also being more than reflected in the stock’s current valuation.
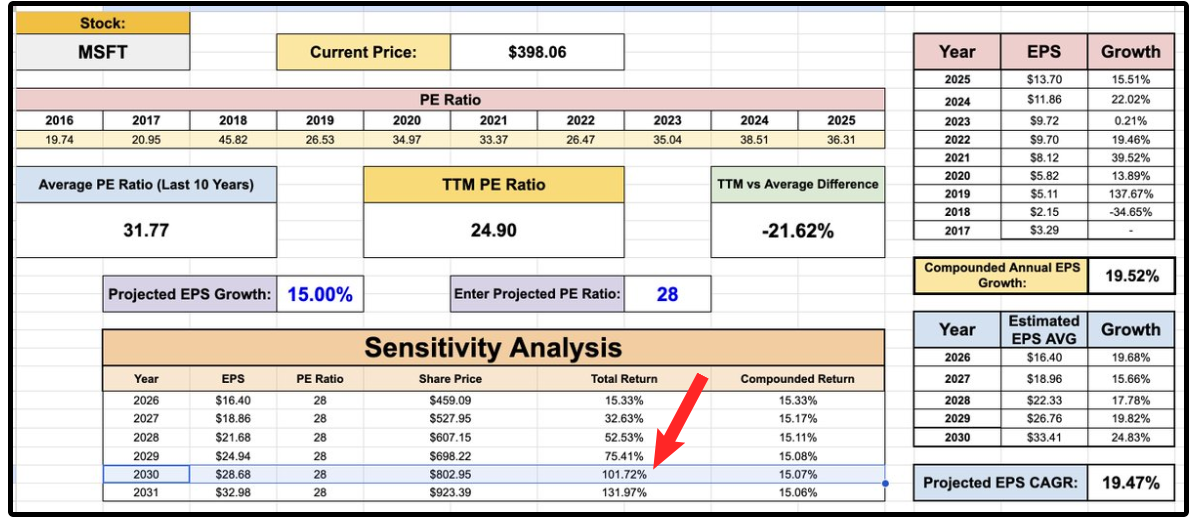
If MSFT:
Grows EPS at 15% (below expectations)
TTM Pe Multiple reverts to 28 (10% below average)
Then MSFT would provide a return of 101.72% by 2030, not including dividends.
3. S&P Global (SPGI)
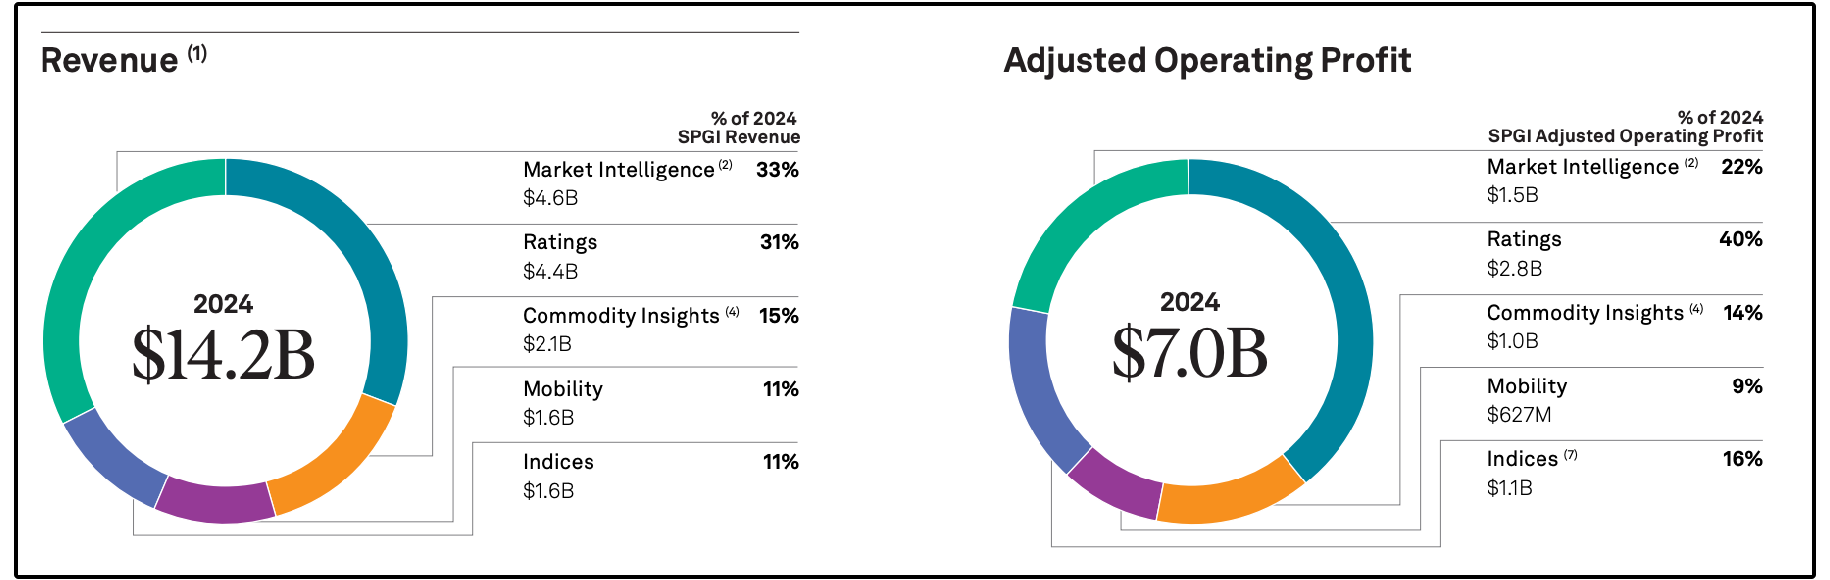
SPGI provides essential financial infrastructure through four main segments:
S&P Global Ratings – Provides credit ratings for corporate, sovereign, and structured debt. (~31% of revenue, ~40% of operating income)
S&P Dow Jones Indices – Home to the S&P 500 and thousands of benchmarks used globally by ETFs, index funds, and pension plans. (~11% of revenue, ~16% of operating income)
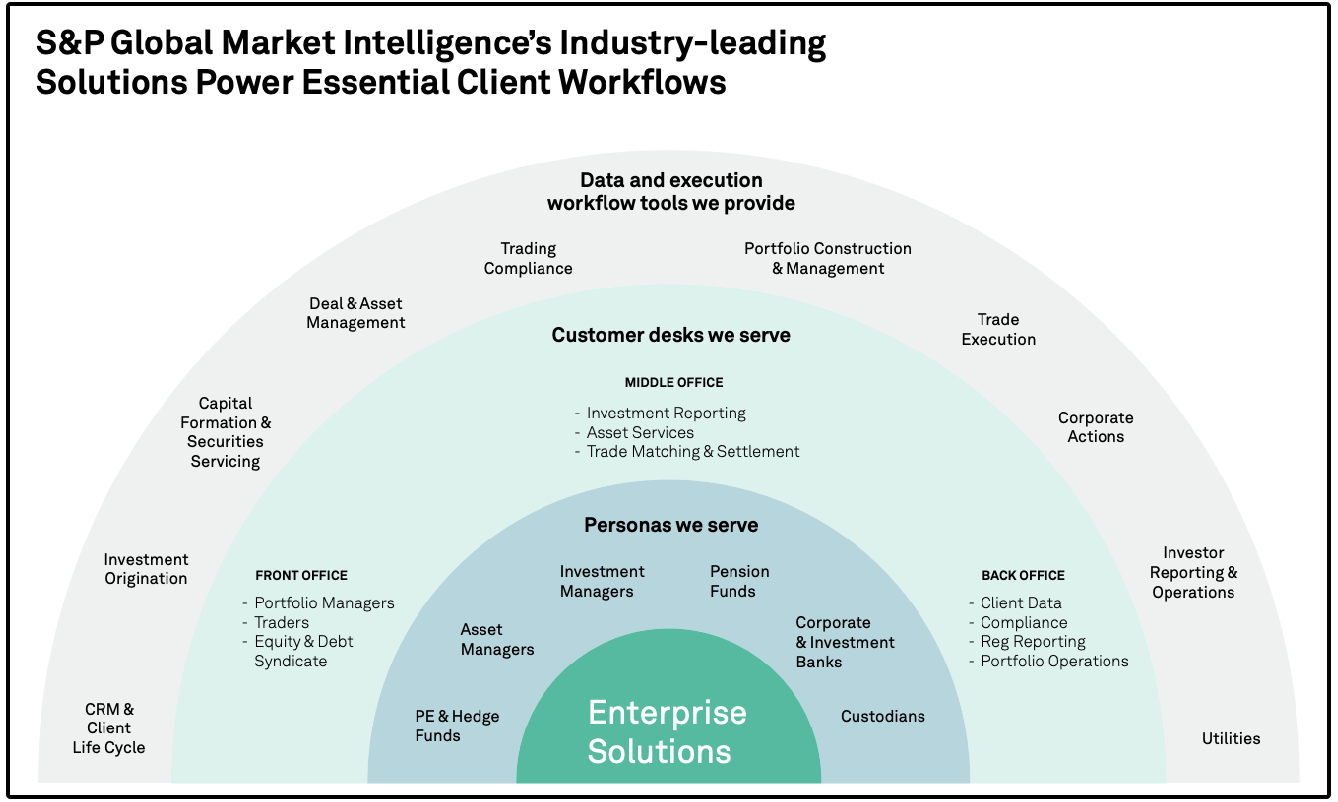
S&P Global Market Intelligence – Offers platforms like Capital IQ that analysts, bankers, and corporations use for market research and data. (~33% of revenue, ~22% of operating income)
S&P Global Commodity Insights & Engineering Solutions – Delivers proprietary energy, commodities, and industrial data analytics. (~15% of revenue, ~14% of operating income)
Through its Ratings, Indices, Market Intelligence, and Commodity Insights segments, SPGI sits at the center of debt issuance, equity markets, and institutional decision making worldwide.
What makes the business so powerful is the combination of deep entrenchment and extreme cash-flow predictability:
Nearly 96% of revenue is recurring,
Free cash flow margins approach 40%
Free cash flow per share compounded at roughly 16% annually over the last five years
Despite recent fears around AI and the broad selloff in so-called “software-adjacent” stocks, the market is fundamentally mischaracterizing what S&P Global actually does.
AI may enhance data processing, but it does not replace credit judgment, regulatory-recognized ratings, or globally accepted benchmarks like the S&P 500 that are embedded into trillions of dollars of capital, investment mandates, and legal frameworks.
Credit ratings require qualitative assessment, management behavior, capital allocation, political and regulatory risk, areas where human oversight and institutional credibility are indispensable.
Likewise, indices are not just datasets; they are standards.
The S&P 500 is hard-wired into ETFs, pensions, derivatives, and asset allocation models worldwide, and that kind of entrenchment cannot be disrupted by a new algorithm.
As interest rates begin to fall, debt issuance is already rebounding, ETF assets continue to grow, and private capital markets are re-accelerating, all trends that SPGI monetizes directly by earning a toll on each transaction, issuance, and dollar of assets tied to its ecosystem.
In other words, the business model has not weakened at all.
What has changed is sentiment.
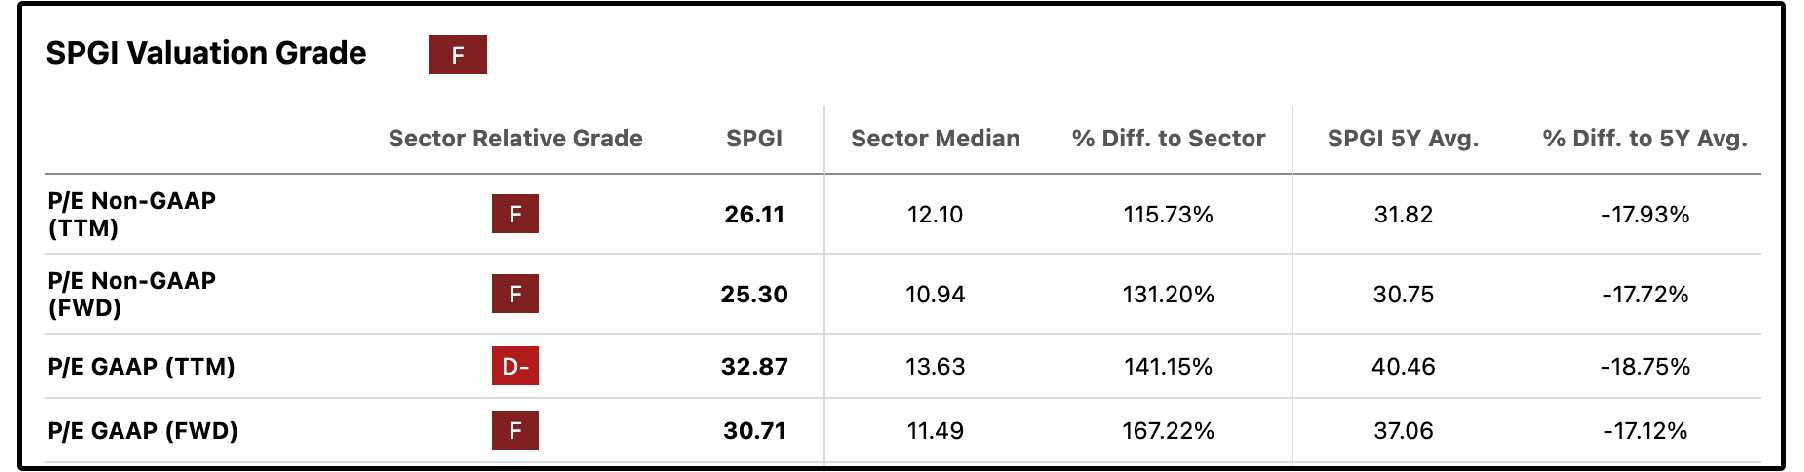
SPGI is now trading nearly 20% below their historic average valuation multiples.
Now, let’s review the full list for February.